ES Daily Plan | February 28, 2024
Last Thursday's breakout point was tested and held during today's session, keeping the breakout intact. The levels on the chart remain unchanged, reflecting the unchanged context. 5093 remains key.
Visual Representation
For new followers, the yellow levels highlighted at the bottom are the primary levels that I focus on intraday. My strategy for preventing impulsive decisions at unfavorable locations involves following a simple yet effective rule of exercising caution when initiating trades outside of the yellow levels. This implies that I am cautious chasing longs above the final yellow upside target and shorts below the final yellow downside target. It is crucial to understand that refraining from chasing a trade is not an automatic invitation to initiate a trade in the opposite direction.
Contextual Analysis
The overnight session mirrored yesterday's closely, with early weakness and price exploration below the previous day's low seen during the Asian hours. Once again, buyers capitalized on the absence of significant downside momentum, resulting in a return within yesterday’s value area. Keep in mind that since yesterday's session, the short-term value (5D VPOC) is positioned above price. This implies that the mere absence of initiative sellers below value is enough to attract responsive buyers.
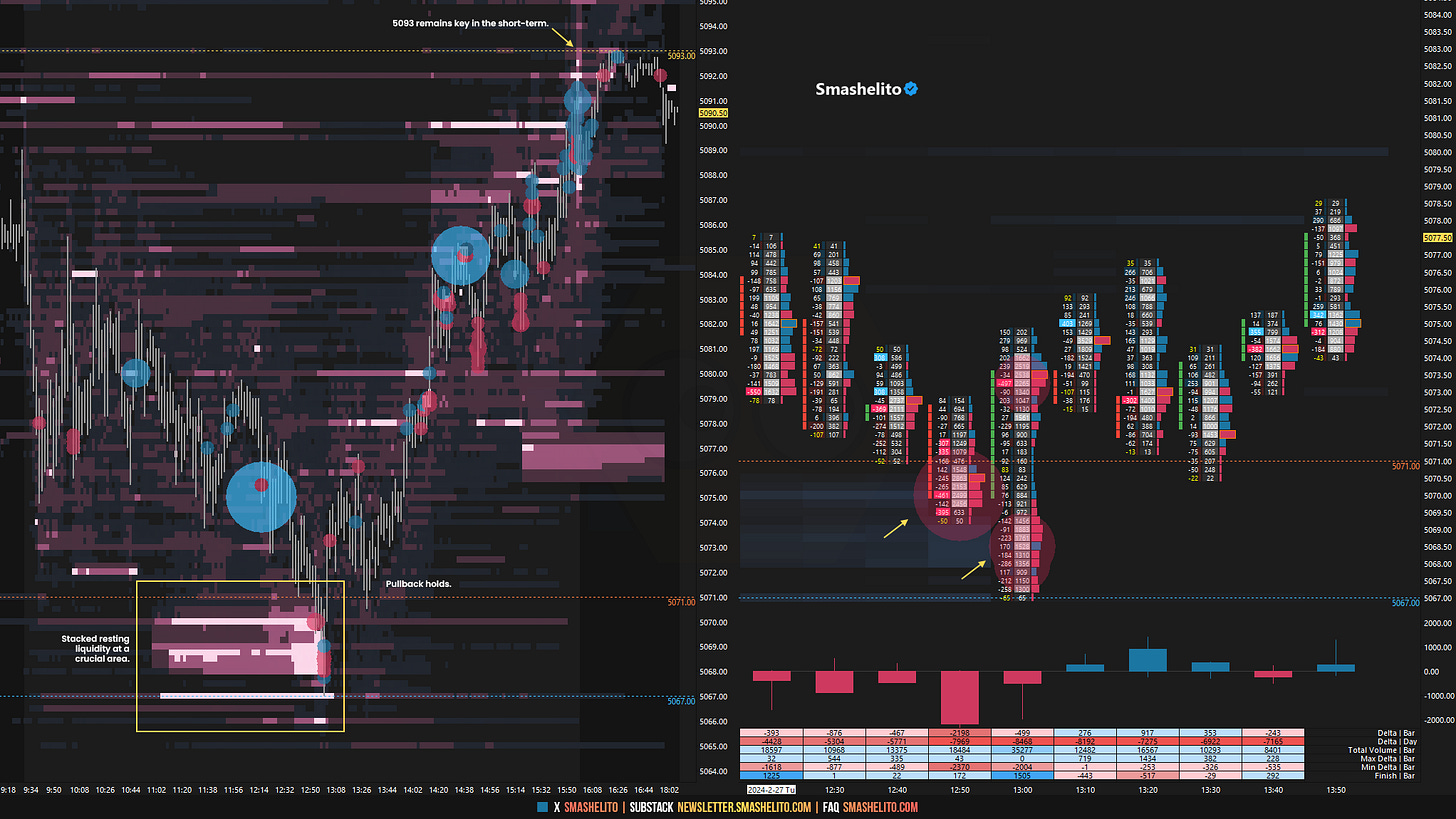
The RTH session was also very similar to yesterday’s, marked by selling pressure right from the opening bell. As outlined in the previous plan, buyers main objective was to return within the two highlighted distributions. Failure to do so would open the door for a retest of Thursday’s breakout point and potential fills of its A-period excess. The former was successfully achieved in the H-period, as the Monthly Extreme High (February) of 5067 was tagged to the tick. The 5071/67 area has been something we have monitored closely for quite some time, and it remains crucial moving forward. If you're tracking resting liquidity, you'll notice it was concentrated within the 5071/67 area today. I'll provide a snapshot on Substack for reference. It's crucial to understand that resting liquidity alone doesn't establish support or resistance levels. What truly matters is how the market reacts when it reaches those levels. This is the fundamental principle of order flow trading, the presence or absence of absorption. The liquidity was filled, prompting an immediate market bounce. The pullback is when the real story is told, and it held, leaving late sellers in a tricky situation. The PM session retraced the AM weakness, closing within yesterday’s value, tagging the Smashlevel of 5093 to the tick after-hours.
Last Thursday's breakout point was tested and held during today's session, keeping the breakout intact. The easy work of technical fills for sellers has been completed, marking the beginning of a more challenging phase. The levels on the chart remain unchanged, reflecting the unchanged context. The 5093 level remains key for buyers to establish acceptance above (rejected after-hours), with their primary objective being to negate Friday’s excess high. Failure to do so would prompt another test of Thursday’s breakout point.
For tomorrow, the Smashlevel (Pivot) is 5093, representing Friday’s low, and aligning with the lower end of the two highlighted distributions. Break and hold above 5093 would target the resistance area from 5111 to 5121, marking the upper end of the current 3-day balance area. Holding below 5093, signaling continued weakness, would target the Quarterly and Monthly Extreme Highs at 5071 and 5067, which also represent the breakout point. In the case of continued weakness, the target is a full traverse of Thursday’s lower distribution toward the support area from 5055 to 5045.
Levels of Interest
Going into tomorrow's session, I will observe 5093.
Break and hold above 5093 would target 5111 / 5121
Holding below 5093 would target 5071 / 5067 / 5055 / 5045
Additionally, pay attention to the following VIX levels: 14.02 and 12.84. These levels can provide confirmation of strength or weakness.
Break and hold above 5121 with VIX below 12.84 would confirm strength.
Break and hold below 5045 with VIX above 14.02 would confirm weakness.
Overall, it's important to exercise caution when trading outside of the highlighted yellow levels. A non-cooperative VIX may suggest possible reversals i.e trade setups.
Weekly Plan
Be sure to check out the Weekly Plan, which provides a broader perspective and highlights significant levels of interest to watch in the coming week.
Disclaimer: Futures and options trading involves a high level of risk, with the potential for substantial losses. The information provided in this newsletter is for informational purposes only and is not intended to be a trade recommendation. It is the responsibility of the reader to make their own investment decisions and they should seek the advice of a qualified securities professional before making any investments. The owners/authors of this newsletter are not certified as registered financial professionals or investment advisers.


Thank buddy, another amazing day, made some errors in the AM session but after 1 PM, was long on ES/NQ held it until MOC.
Hello Sir, what a beautiful chart, much colors great for visual learner. I was wondering why at is the soft ware that you use for charting. Thank you!