
ES Daily Plan | February 13, 2026
Market Context & Key Levels for the Day Ahead

— For new subscribers
The yellow levels highlighted at the bottom left of the chart are the primary intraday levels I focus on. To avoid impulsive decisions at poor trade locations, I follow a simple but effective rule: exercise caution when initiating trades outside of these yellow levels.
This means I’m cautious about chasing longs above the Final Upside Target (FUT) and shorts below the Final Downside Target (FDT). It’s important to understand that not chasing does not imply initiating a trade in the opposite direction — discipline over impulse.
Be sure to review the Weekly Plan for a broader perspective, key levels, and market expectations for the week ahead.

Contextual Analysis & Plan
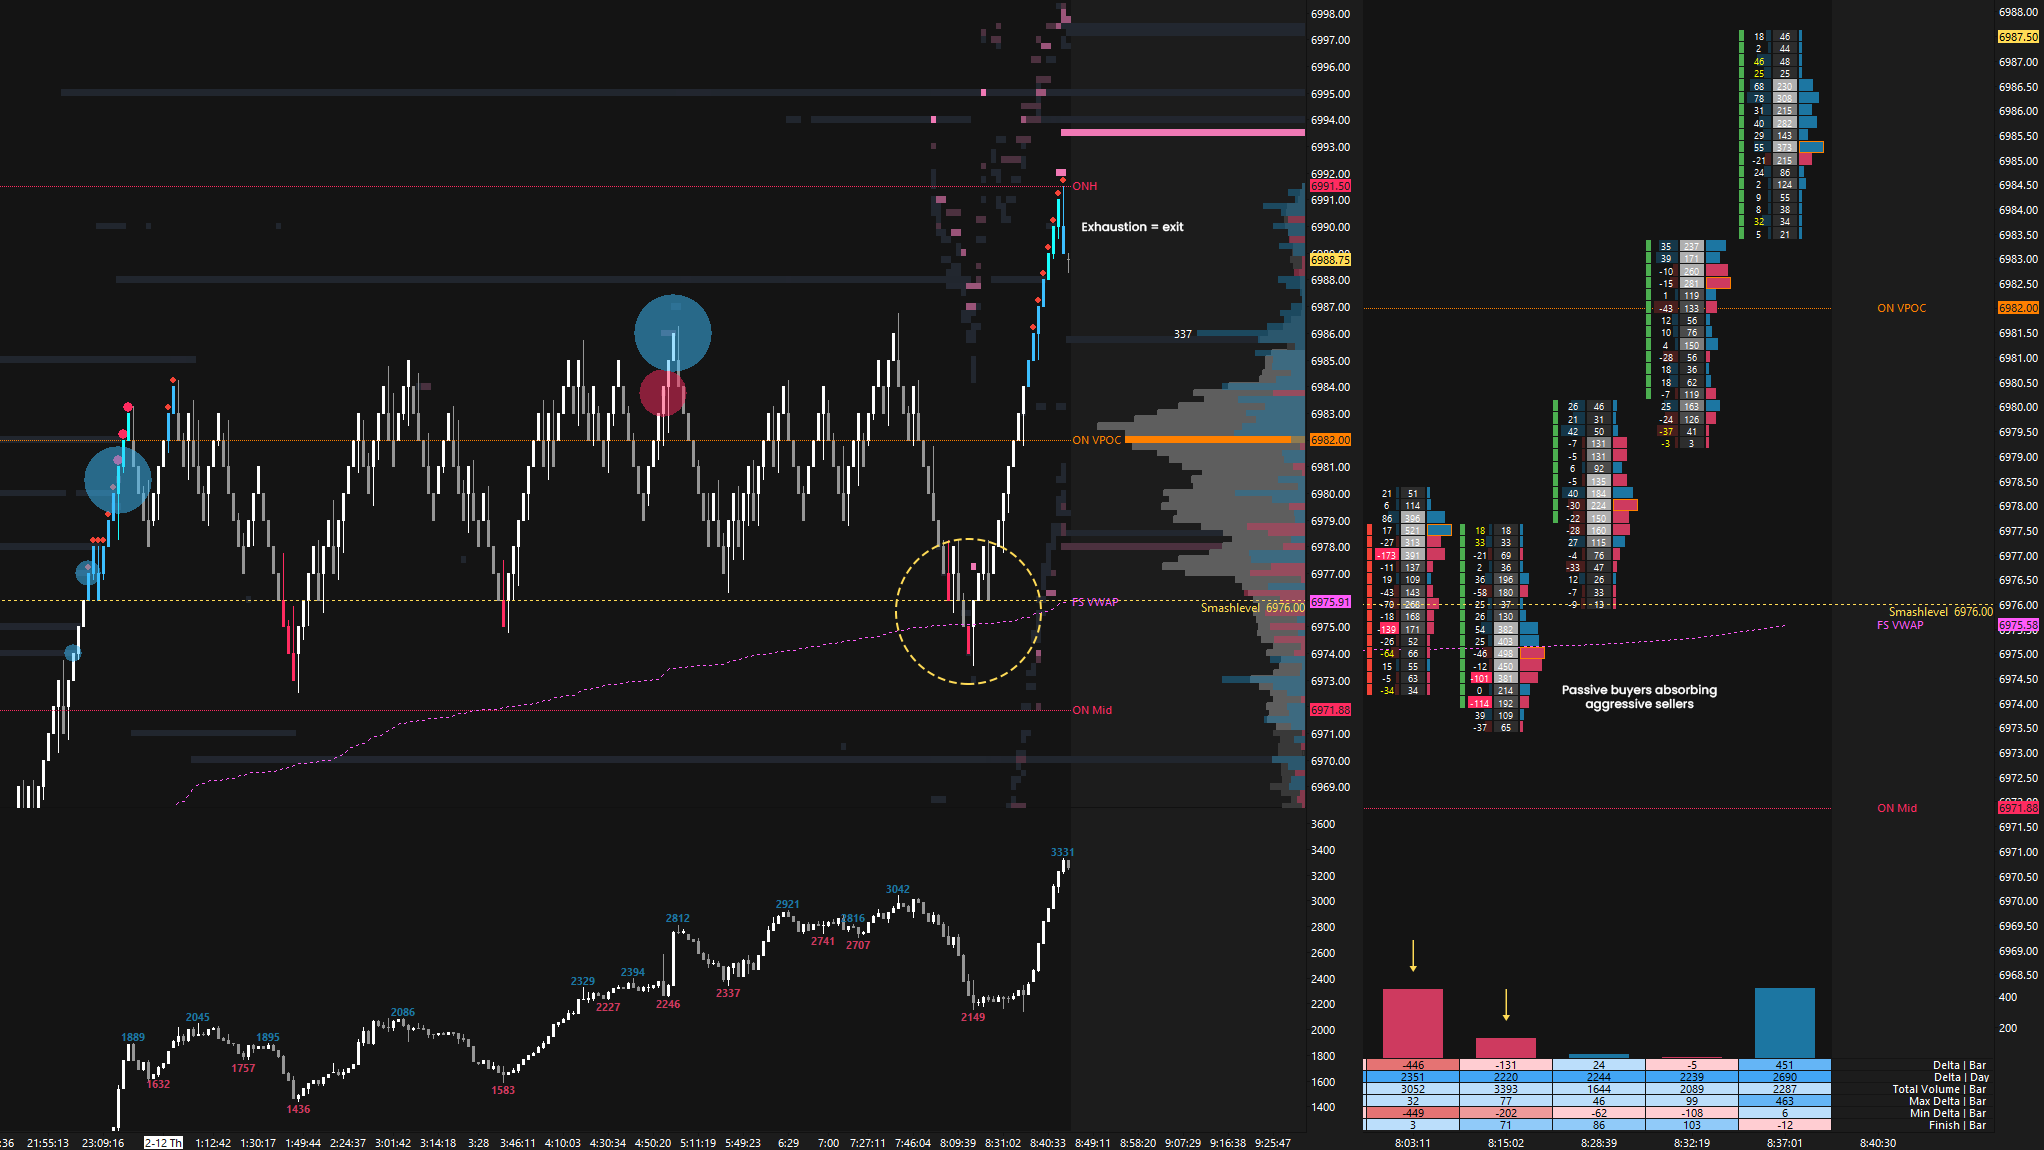
The overnight session quickly reclaimed the Smashlevel at 6976, presenting solid scalping opportunities, particularly during the push higher ahead of the RTH open (see Figure 1). However, sellers were responsive within Wednesday’s excess high. The key for the RTH session was whether buyers could continue to defend 6976, having already done so on multiple occasions overnight.
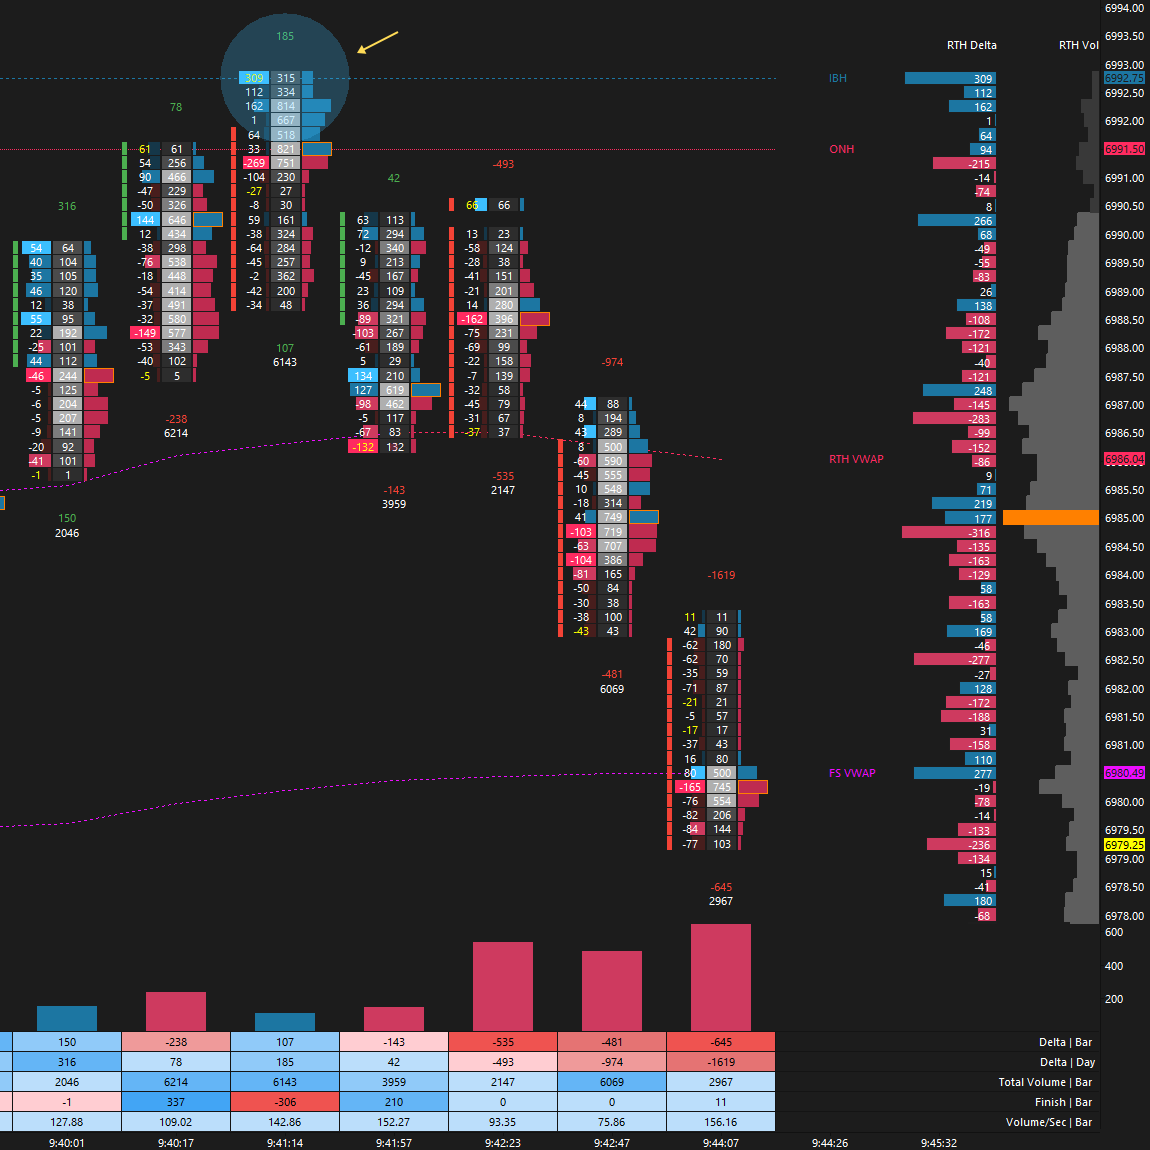
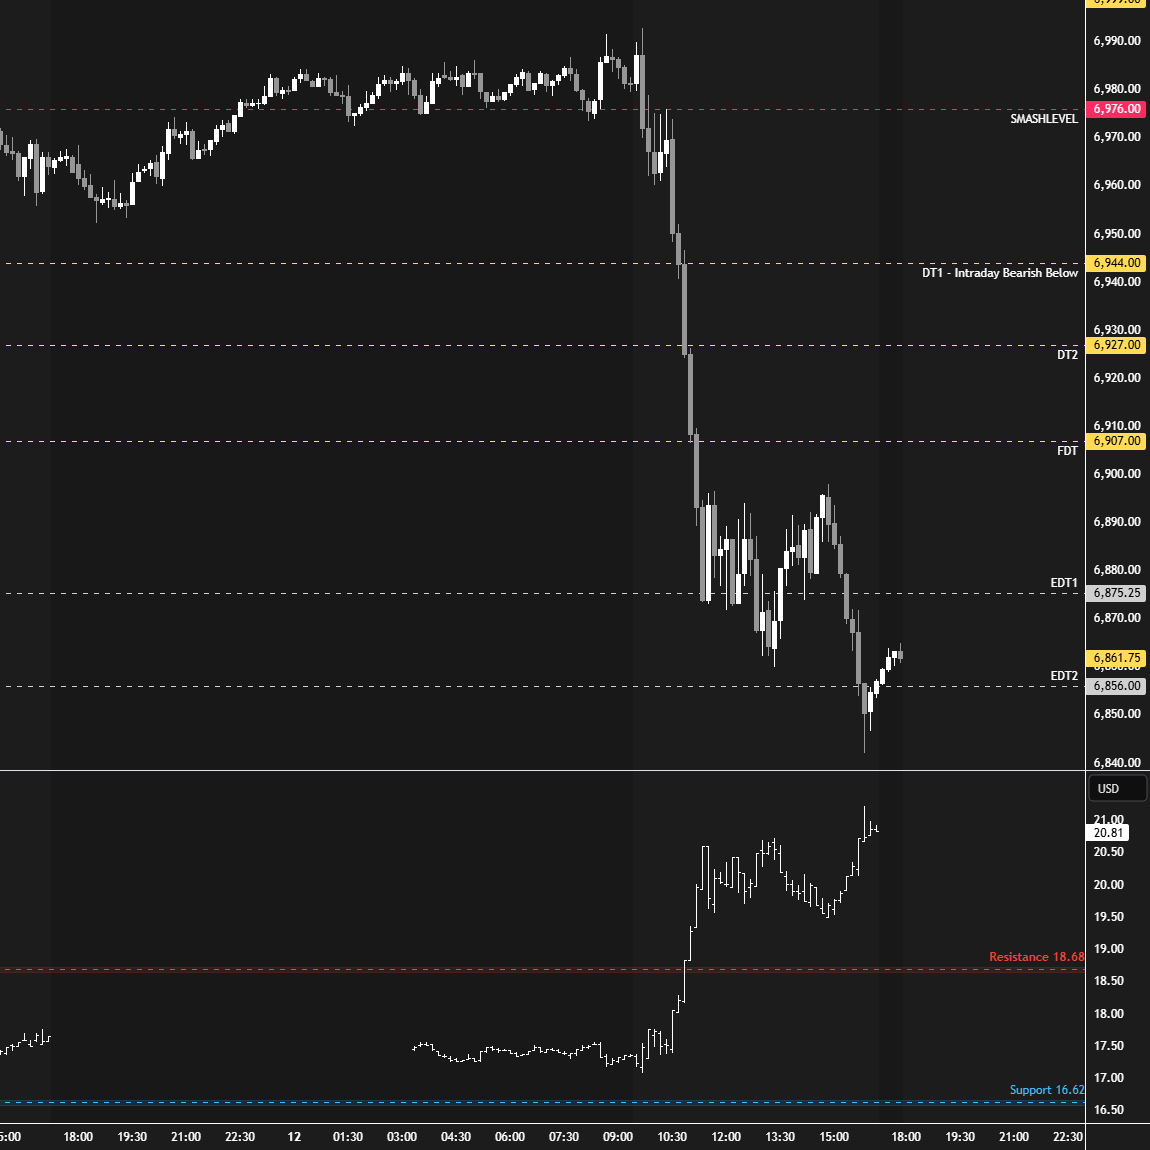
The RTH session looked above the overnight high and failed, offering an excellent reversal from an order-flow perspective—absorption followed by selling aggression (see Figure 2). The Smashlevel at 6976 was breached and subsequently re-offered, quickly putting overnight participants in a tricky position. The B-period high tagged 6976 to the tick. Failure to defend 6976 led to an initial balance extension to the downside in the C-period, marking the start of a rather nasty liquidation break. To shift the short-term tone, sellers needed traction below 6944, as discussed, which they ultimately achieved after the auction temporarily stalled around the 6944 area. The final downside target at 6907 (FDT) was tagged and exceeded during the D-period, with the VIX already having breached its resistance level at 18.68. A VIX confirming weakness is, as always, not the time to play hero—something today’s session clearly illustrated as the market went on to drop another 65 handles. The auction is attempting a directional move away from both short-term (5D VPOC) and medium-term value (20D VPOC)—monitor for continuation or lack thereof.
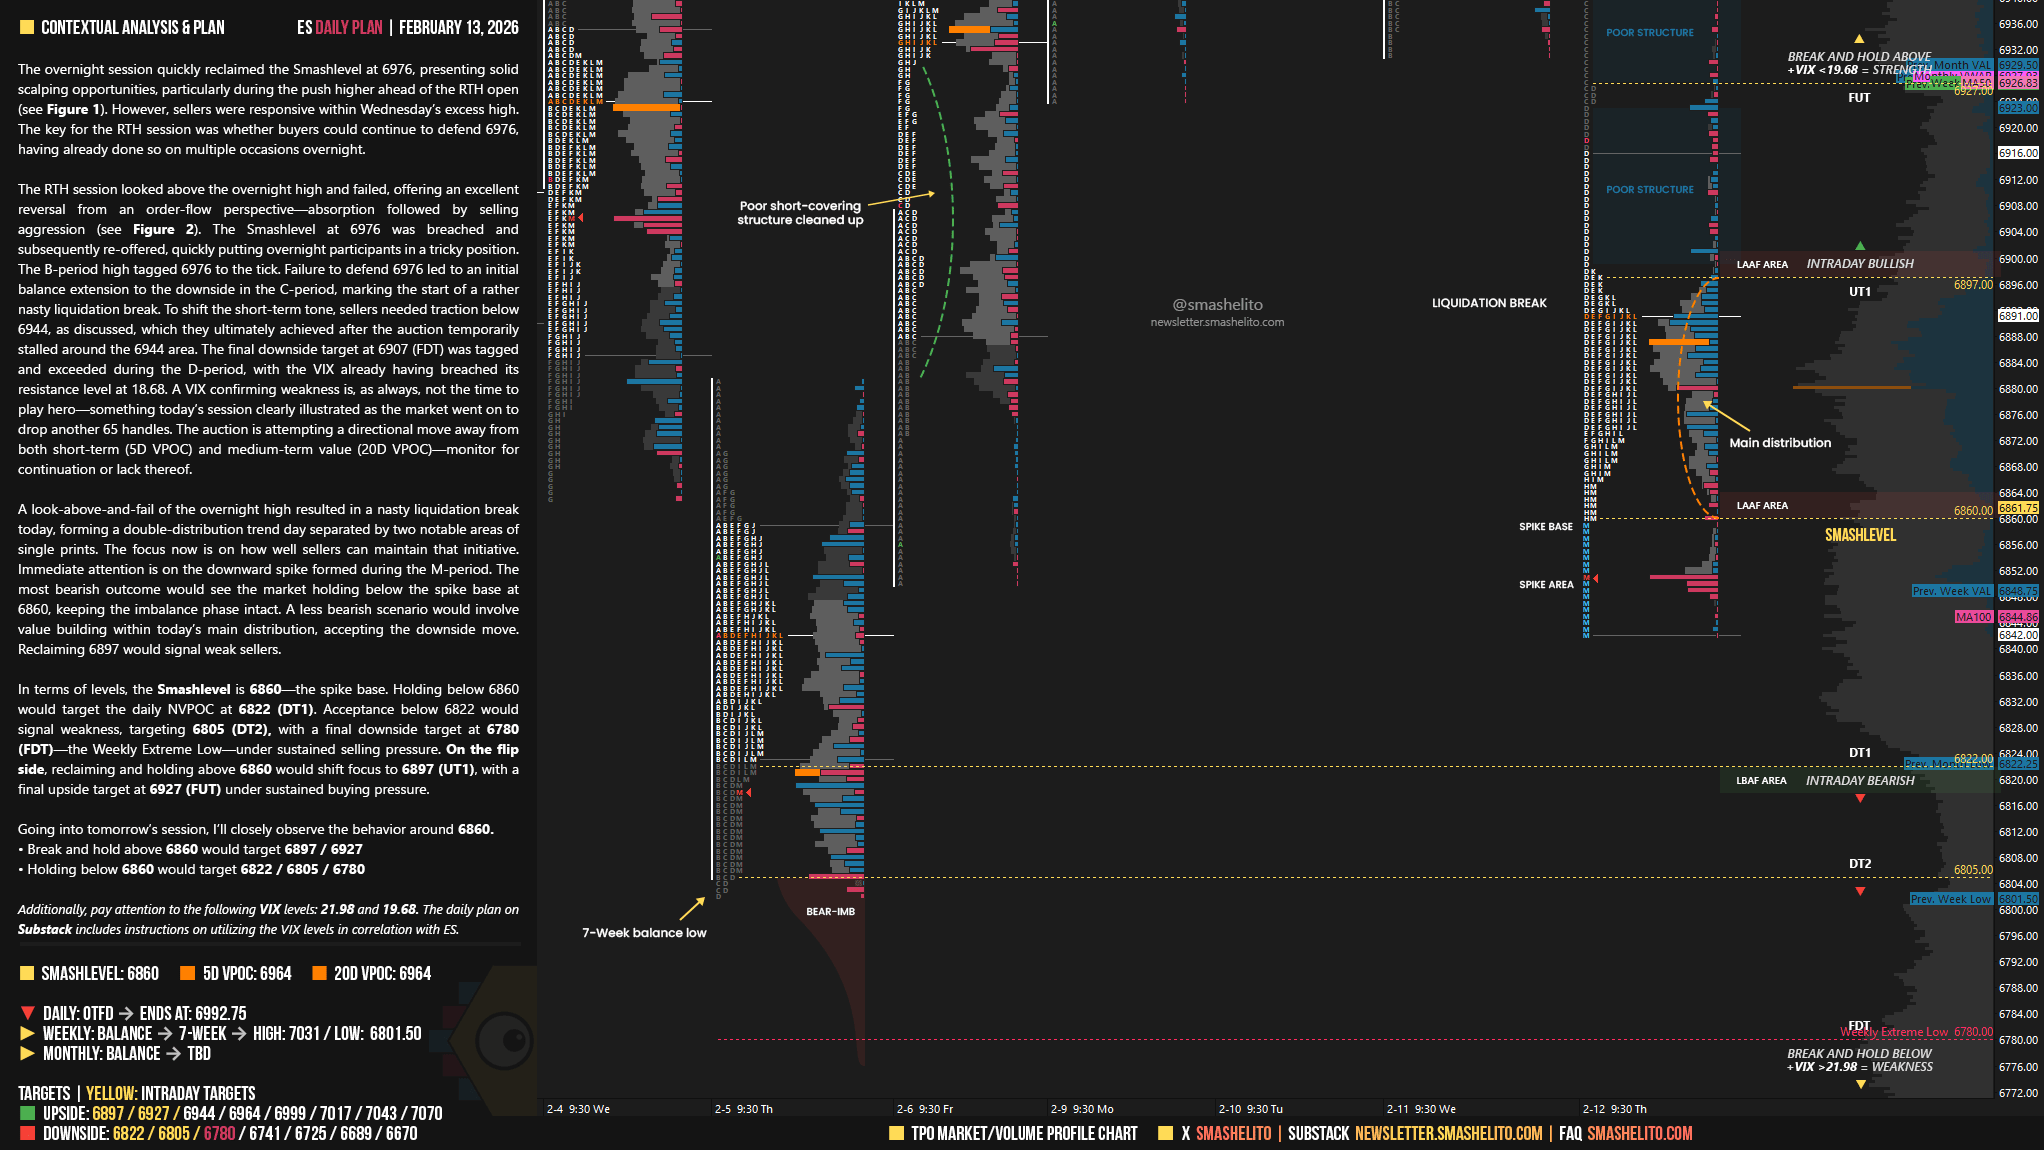
A look-above-and-fail of the overnight high resulted in a nasty liquidation break today, forming a double-distribution trend day separated by two notable areas of single prints. The focus now is on how well sellers can maintain that initiative. Immediate attention is on the downward spike formed during the M-period.
The most bearish outcome would see the market holding below the spike base at 6860, keeping the imbalance phase intact. A less bearish scenario would involve value building within today’s main distribution, accepting the downside move. Reclaiming 6897 would signal weak sellers.
In terms of levels, the Smashlevel is 6860—the spike base. Holding below 6860 would target the daily NVPOC at 6822 (DT1). Acceptance below 6822 would signal weakness, targeting 6805 (DT2), with a final downside target at 6780 (FDT)—the Weekly Extreme Low—under sustained selling pressure.
On the flip side, reclaiming and holding above 6860 would shift focus to 6897 (UT1), with a final upside target at 6927 (FUT) under sustained buying pressure.
Levels of Interest
Going into tomorrow’s session, I’ll closely observe the behavior around 6860.
Break and hold above 6860 would target 6897 / 6927
Holding below 6860 would target 6822 / 6805 / 6780
Additionally, pay attention to the following VIX levels: 21.98 and 19.68. These levels can provide confirmation of strength or weakness.
Break and hold above 6927 with VIX below 19.68 would confirm strength.
Break and hold below 6780 with VIX above 21.98 would confirm weakness.
Overall, it's important to exercise caution when trading outside of the highlighted yellow levels. A non-cooperative VIX may suggest possible reversals i.e trade setups.
Great work always smash 💥
Today at 6897 I was thinking to to short but $VIX was below support so did not take the trade. Any thoughts on this ? Thank you
Thanks Smash for everything, thanks for answering my emails and helping me improve as a trader. Have a great session and I wish you a very good weekend. Another week learning from you!