
ES Daily Plan | February 11, 2026
Market Context & Key Levels for the Day Ahead

— For new subscribers
The yellow levels highlighted at the bottom left of the chart are the primary intraday levels I focus on. To avoid impulsive decisions at poor trade locations, I follow a simple but effective rule: exercise caution when initiating trades outside of these yellow levels.
This means I’m cautious about chasing longs above the Final Upside Target (FUT) and shorts below the Final Downside Target (FDT). It’s important to understand that not chasing does not imply initiating a trade in the opposite direction — discipline over impulse.
Be sure to review the Weekly Plan for a broader perspective, key levels, and market expectations for the week ahead.

10,000+ Subscribers
We’ve just surpassed 10,000 subscribers—a huge milestone for a newsletter focused on a single market! So much work happens behind the scenes, and it’s your support that keeps this project alive. Every read, share, and comment matters.
I also want to take a moment to show my appreciation to everyone who has pledged their support—it will not go unnoticed. Thank you for being part of this journey!
Contextual Analysis & Plan
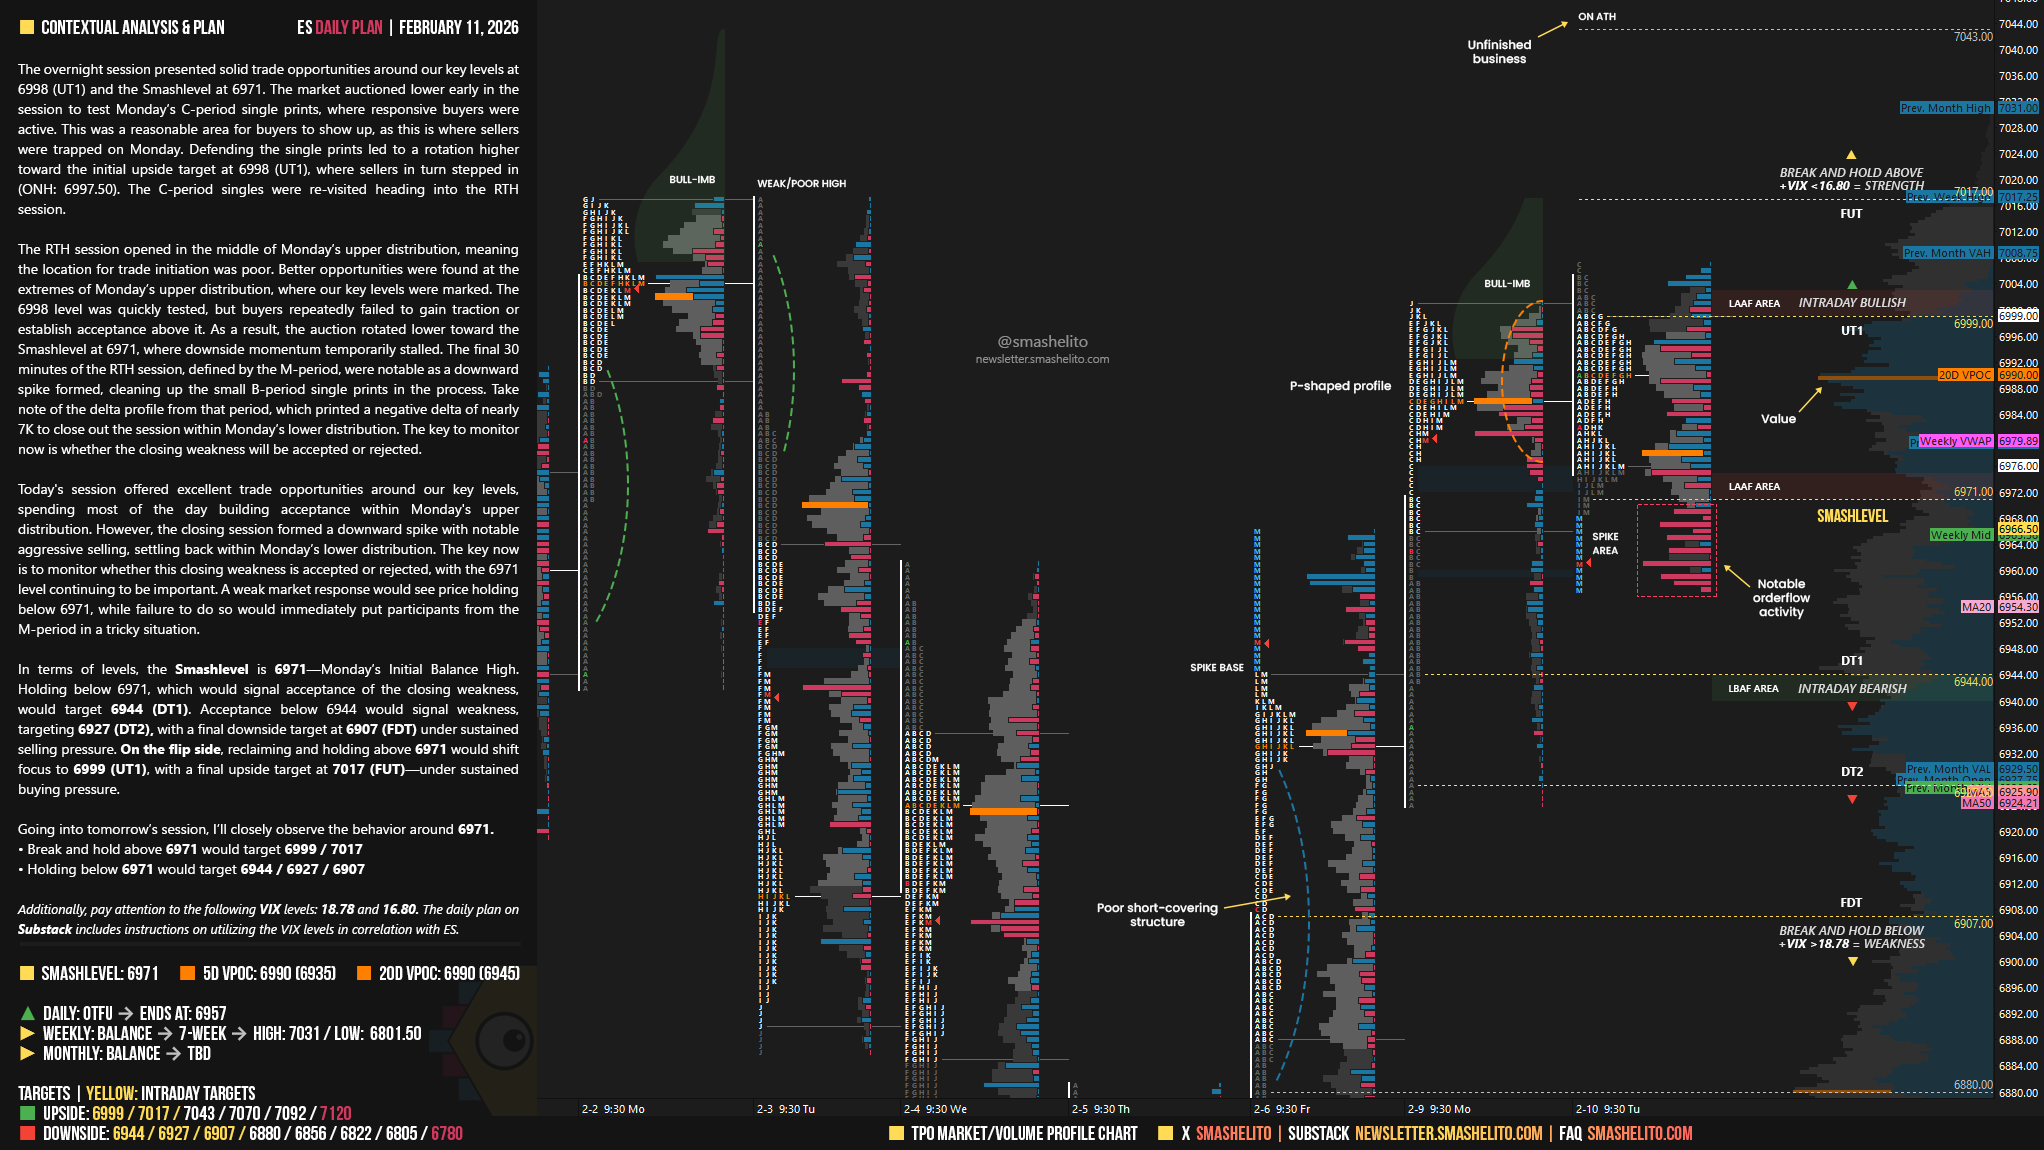
The overnight session presented solid trade opportunities around our key levels at 6998 (UT1) and the Smashlevel at 6971. The market auctioned lower early in the session to test Monday’s C-period single prints, where responsive buyers were active. This was a reasonable area for buyers to show up, as this is where sellers were trapped on Monday. Defending the single prints led to a rotation higher toward the initial upside target at 6998 (UT1), where sellers in turn stepped in (ONH: 6997.50). The C-period singles were re-visited heading into the RTH session.
The RTH session opened in the middle of Monday’s upper distribution, meaning the location for trade initiation was poor. Better opportunities were found at the extremes of Monday’s upper distribution, where our key levels were marked. The 6998 level was quickly tested, but buyers repeatedly failed to gain traction or establish acceptance above it. As a result, the auction rotated lower toward the Smashlevel at 6971, where downside momentum temporarily stalled. The final 30 minutes of the RTH session, defined by the M-period, were notable as a downward spike formed, cleaning up the small B-period single prints in the process. Take note of the delta profile from that period, which printed a negative delta of nearly 7K to close out the session within Monday’s lower distribution. The key to monitor now is whether the closing weakness will be accepted or rejected.
Today’s session offered excellent trade opportunities around our key levels, spending most of the day building acceptance within Monday’s upper distribution. However, the closing session formed a downward spike with notable aggressive selling, settling back within Monday’s lower distribution.
The key now is to monitor whether this closing weakness is accepted or rejected, with the 6971 level continuing to be important. A weak market response would see price holding below 6971, while failure to do so would immediately put participants from the M-period in a tricky situation.
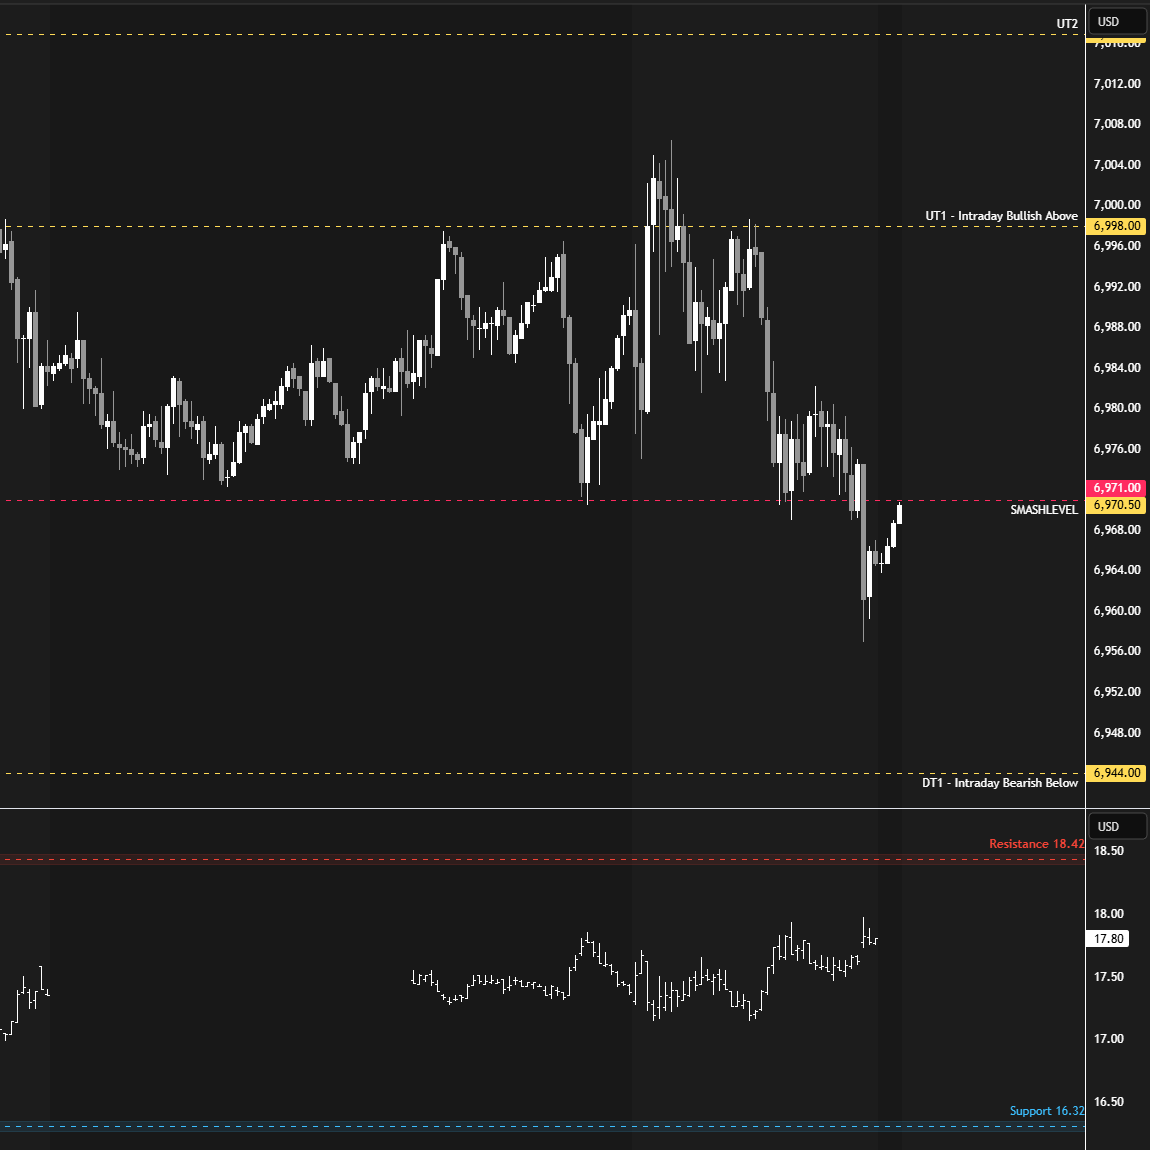
In terms of levels, the Smashlevel is 6971—Monday’s Initial Balance High. Holding below 6971, which would signal acceptance of the closing weakness, would target 6944 (DT1). Acceptance below 6944 would signal weakness, targeting 6927 (DT2), with a final downside target at 6907 (FDT) under sustained selling pressure.
On the flip side, reclaiming and holding above 6971 would shift focus to 6999 (UT1), with a final upside target at 7017 (FUT)—under sustained buying pressure.
Levels of Interest
Going into tomorrow’s session, I’ll closely observe the behavior around 6971.
Break and hold above 6971 would target 6998 / 7017
Holding below 6971 would target 6944 / 6927 / 6907
Additionally, pay attention to the following VIX levels: 18.78 and 16.80. These levels can provide confirmation of strength or weakness.
Break and hold above 7017 with VIX below 16.80 would confirm strength.
Break and hold below 6907 with VIX above 18.78 would confirm weakness.
Overall, it's important to exercise caution when trading outside of the highlighted yellow levels. A non-cooperative VIX may suggest possible reversals i.e trade setups.
Thanks. Congrats on 10k! This newsletter has been the best teacher to learn market profile and order flow.
Thanks Smash!