
ES Daily Plan | February 10, 2026
Market Context & Key Levels for the Day Ahead

— For new subscribers
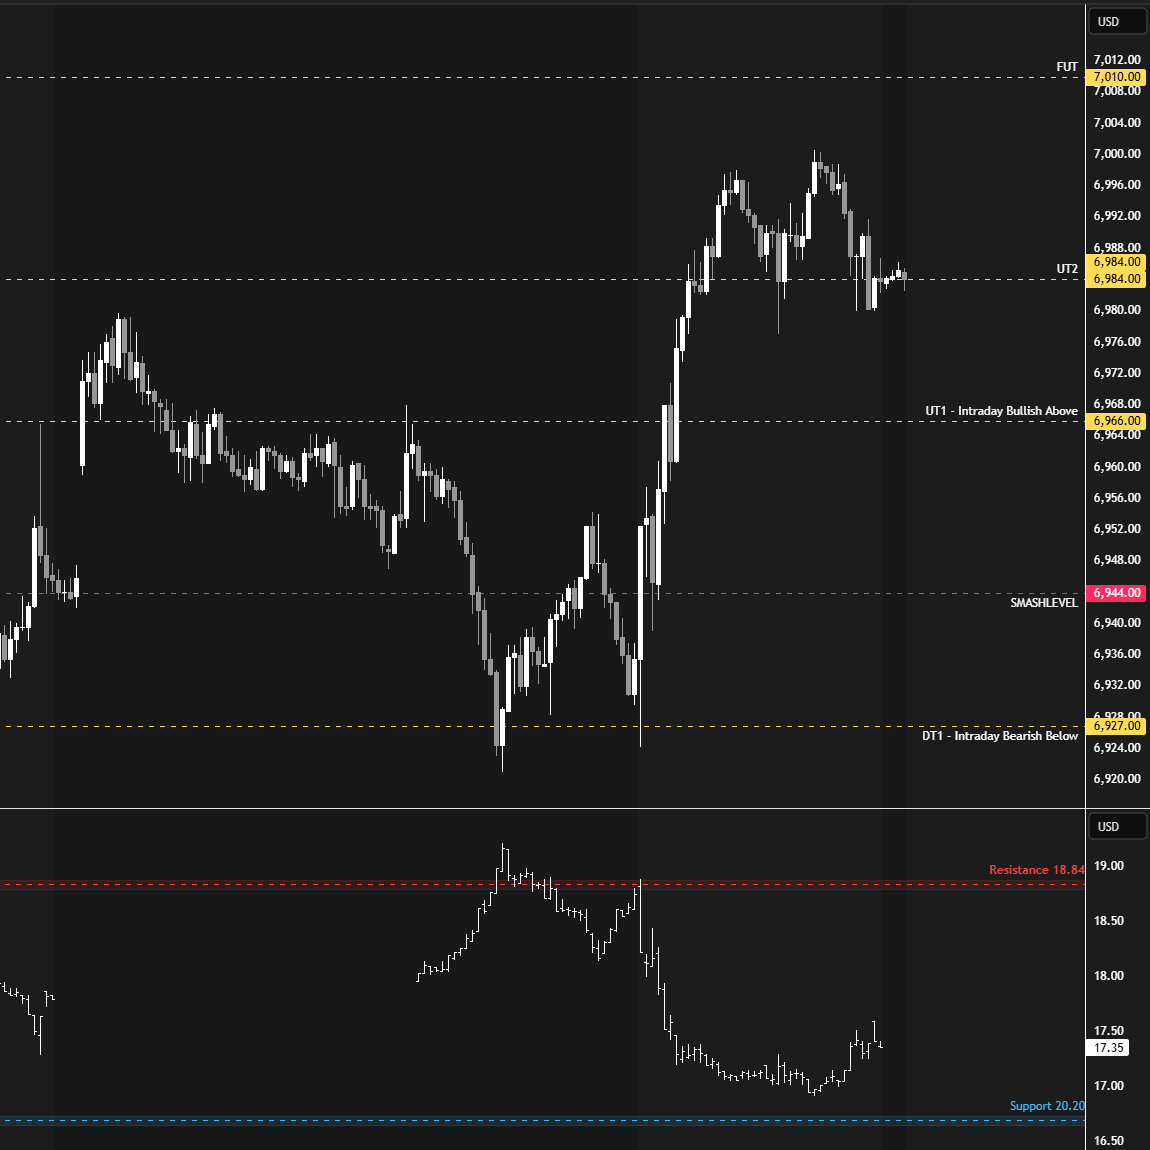
The yellow levels highlighted at the bottom left of the chart are the primary intraday levels I focus on. To avoid impulsive decisions at poor trade locations, I follow a simple but effective rule: exercise caution when initiating trades outside of these yellow levels.
This means I’m cautious about chasing longs above the Final Upside Target (FUT) and shorts below the Final Downside Target (FDT). It’s important to understand that not chasing does not imply initiating a trade in the opposite direction — discipline over impulse.
Be sure to review the Weekly Plan for a broader perspective, key levels, and market expectations for the week ahead.

10,000+ Subscribers
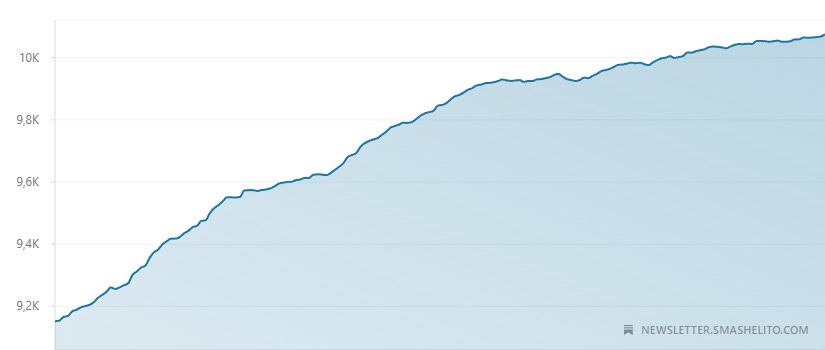
We’ve just surpassed 10,000 subscribers—a huge milestone for a newsletter focused on a single market! So much work happens behind the scenes, and it’s your support that keeps this project alive. Every read, share, and comment matters.
I also want to take a moment to show my appreciation to everyone who has pledged their support—it will not go unnoticed. Thank you for being part of this journey!
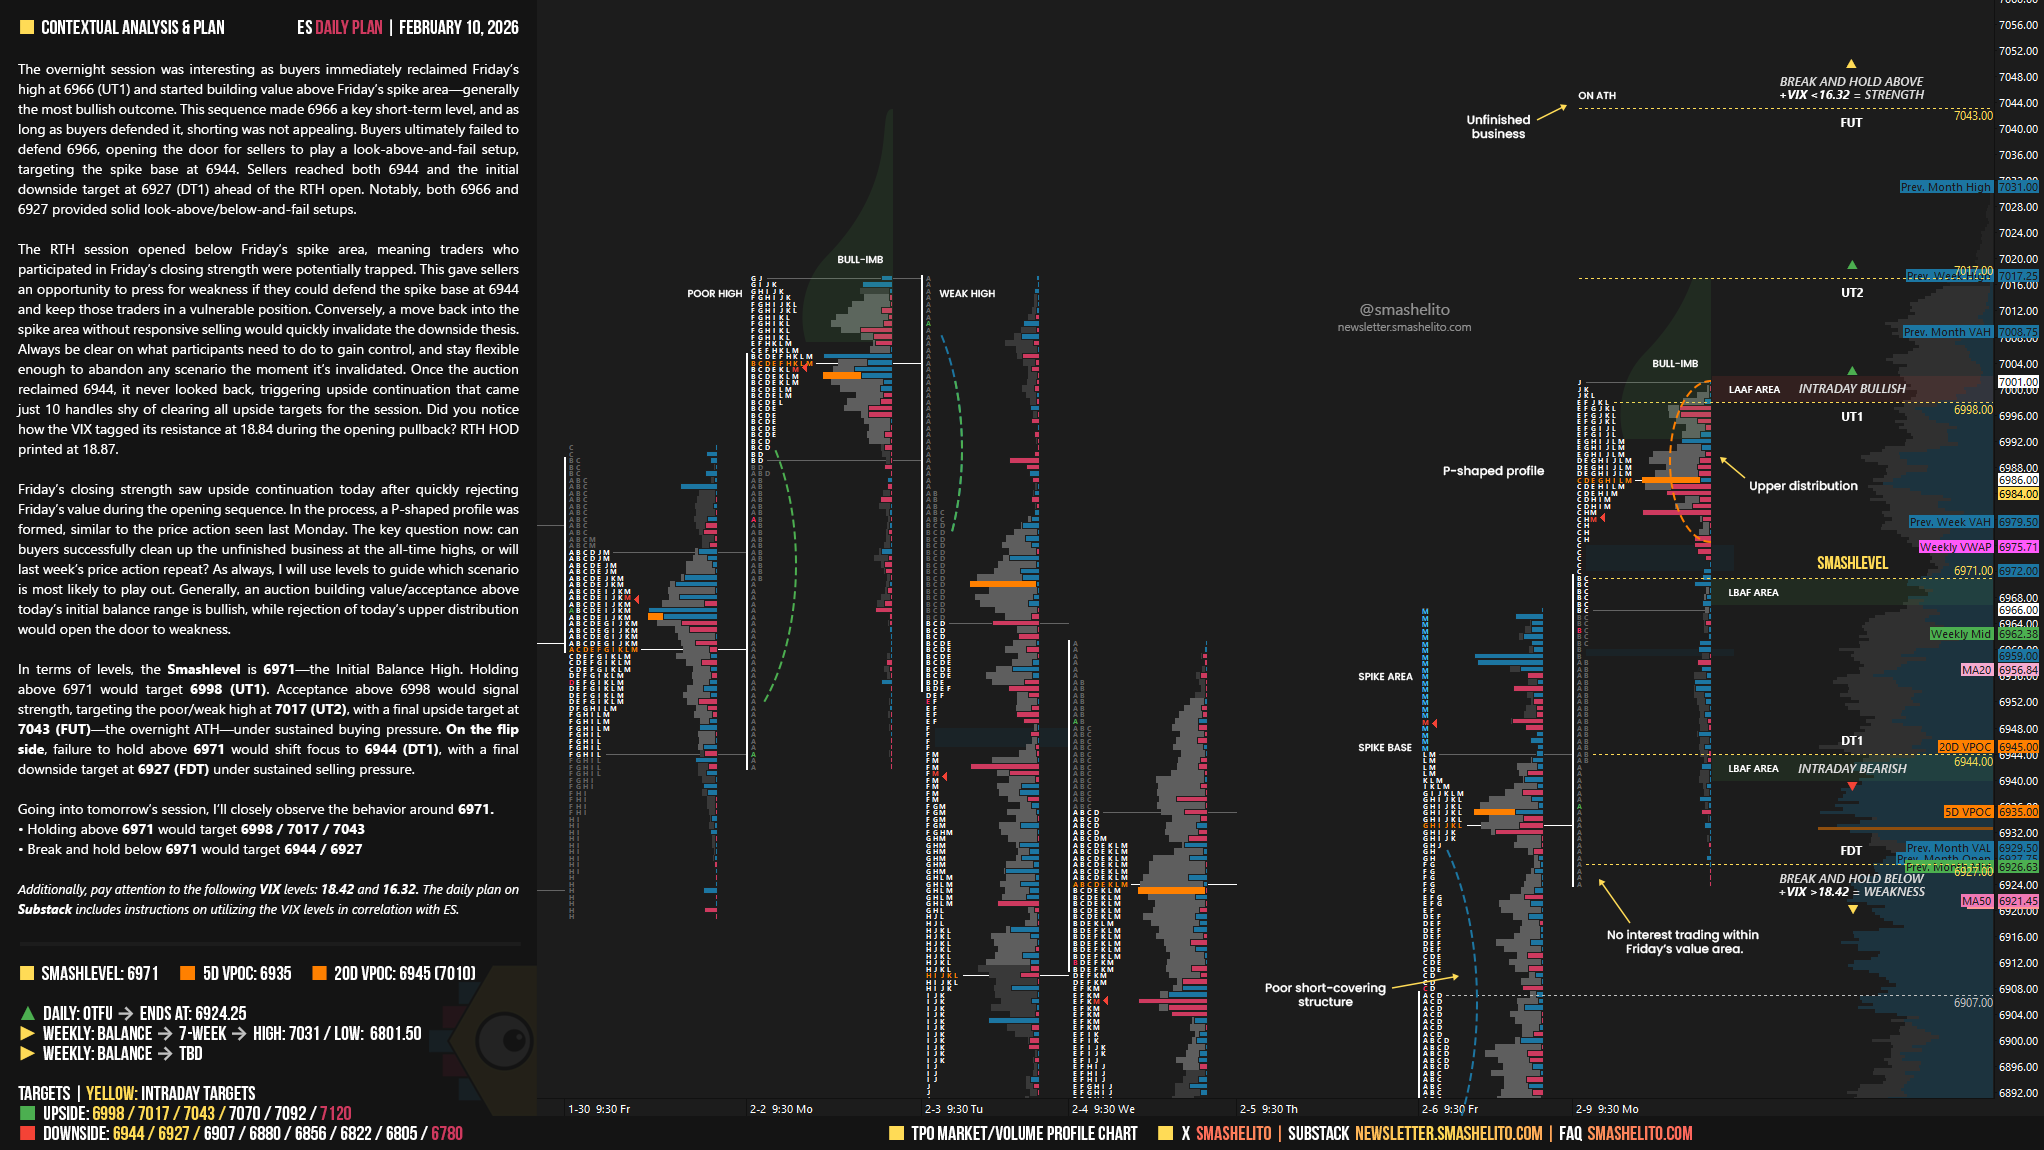
Contextual Analysis & Plan
The overnight session was interesting as buyers immediately reclaimed Friday’s high at 6966 (UT1) and started building value above Friday’s spike area—generally the most bullish outcome. This sequence made 6966 a key short-term level, and as long as buyers defended it, shorting was not appealing. Buyers ultimately failed to defend 6966, opening the door for sellers to play a look-above-and-fail setup, targeting the spike base at 6944. Sellers reached both 6944 and the initial downside target at 6927 (DT1) ahead of the RTH open. Notably, both 6966 and 6927 provided solid look-above/below-and-fail setups.
The RTH session opened below Friday’s spike area, meaning traders who participated in Friday’s closing strength were potentially trapped. This gave sellers an opportunity to press for weakness if they could defend the spike base at 6944 and keep those traders in a vulnerable position. Conversely, a move back into the spike area without responsive selling would quickly invalidate the downside thesis. Always be clear on what participants need to do to gain control, and stay flexible enough to abandon any scenario the moment it’s invalidated. Once the auction reclaimed 6944, it never looked back, triggering upside continuation that came just 10 handles shy of clearing all upside targets for the session. Did you notice how the VIX tagged its resistance at 18.84 during the opening pullback? RTH HOD printed at 18.87.
Friday’s closing strength saw upside continuation today after quickly rejecting Friday’s value during the opening sequence. In the process, a P-shaped profile was formed, similar to the price action seen last Monday. The key question now: can buyers successfully clean up the unfinished business at the all-time highs, or will last week’s price action repeat?
As always, I will use levels to guide which scenario is most likely to play out. Generally, an auction building value/acceptance above today’s initial balance range is bullish, while rejection of today’s upper distribution would open the door to weakness.
In terms of levels, the Smashlevel is 6971—the Initial Balance High. Holding above 6971 would target 6998 (UT1). Acceptance above 6998 would signal strength, targeting the poor/weak high at 7017 (UT2), with a final upside target at 7043 (FUT)—the overnight ATH—under sustained buying pressure.
On the flip side, failure to hold above 6971 would shift focus to 6944 (DT1), with a final downside target at 6927 (FDT) under sustained selling pressure.
Levels of Interest
Going into tomorrow’s session, I’ll closely observe the behavior around 6971.
Holding above 6971 would target 6998 / 7017 / 7043
Break and hold below 6971 would target 6944 / 6927
Additionally, pay attention to the following VIX levels: 18.42 and 16.32. These levels can provide confirmation of strength or weakness.
Break and hold above 7043 with VIX below 16.32 would confirm strength.
Break and hold below 6927 with VIX above 18.42 would confirm weakness.
Overall, it's important to exercise caution when trading outside of the highlighted yellow levels. A non-cooperative VIX may suggest possible reversals i.e trade setups.
Thanks Smash!
Thank you for the daily newsletter, it's a great compass.