
ES Daily Plan | December 9, 2025
Market Context & Key Levels for the Day Ahead

— For new subscribers
The yellow levels highlighted at the bottom left of the chart are the primary intraday levels I focus on. To avoid impulsive decisions at poor trade locations, I follow a simple but effective rule: exercise caution when initiating trades outside of these yellow levels.
This means I’m cautious about chasing longs above the Final Upside Target (FUT) and shorts below the Final Downside Target (FDT). It’s important to understand that not chasing does not imply initiating a trade in the opposite direction — discipline over impulse.
Be sure to review the Weekly Plan for a broader perspective, key levels, and market expectations for the week ahead.

Contextual Analysis & Plan
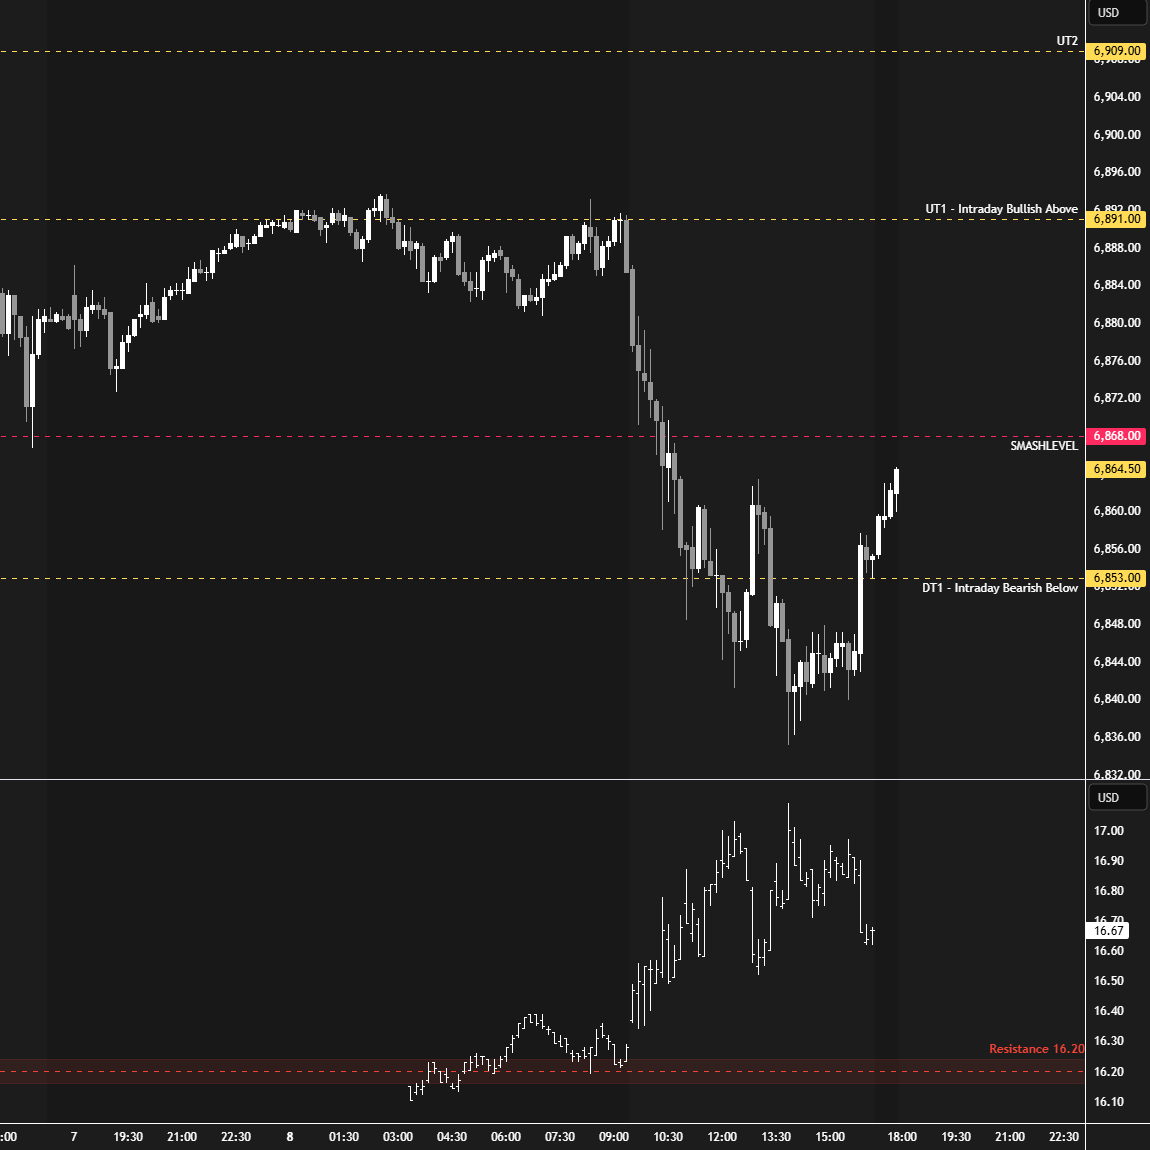
Heading into today’s session, the key was to monitor where value would form and whether buyers could maintain the pattern of higher lows on the daily chart. Failure to hold that pattern would open the door to weakness. The overnight session trended higher early on, testing Friday’s afternoon rally high at 6891 (UT1), which produced a look-above-and-fail setup twice. The second occurrence, which unfolded right before the RTH open, had strong confluence with the VIX testing its broken resistance area from above.
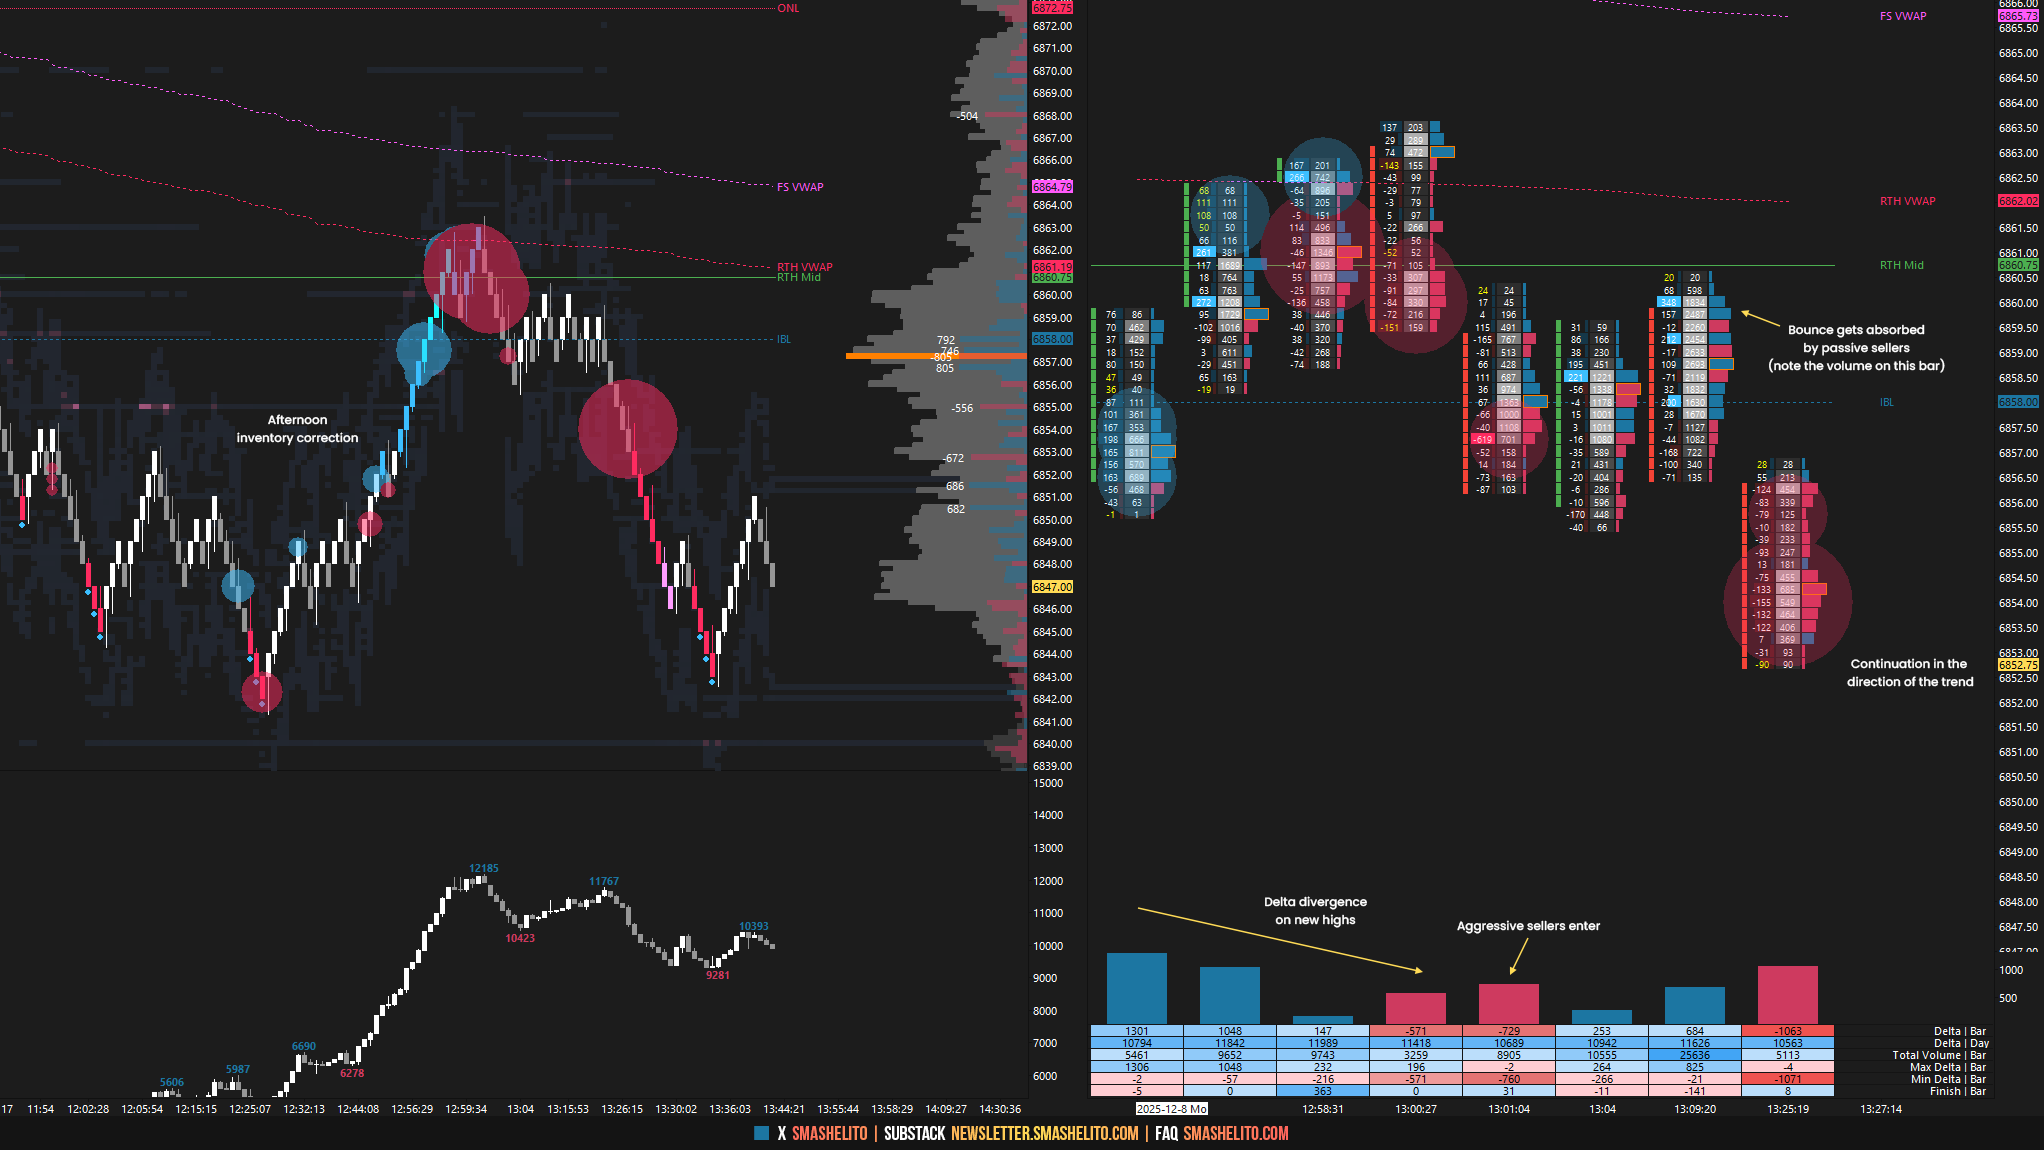
In the RTH session, sellers immediately took control of the auction, ending the daily one-time framing up as they took out Friday’s low during the initial balance. When C-period then struggled to reclaim the Smashlevel at 6868, continued weakness became the expectation—and that’s ultimately what played out. The market was one-time framing down intraday for six straight periods, which is characteristic of a trending environment. In such conditions, it’s common to see a counter-trend move develop in the afternoon session—essentially an inventory correction. These counter-trend moves often present good opportunities to reload shorts, as inexperienced traders tend to misinterpret them as signs of stronger buyers, when in reality they are frequently just inventory corrections. The G-period saw a short-covering bounce that was sold a couple of handles short of 6868 (see Figure 1). Following this, a new intraday low printed, but buyers managed to trigger a bounce into the close.
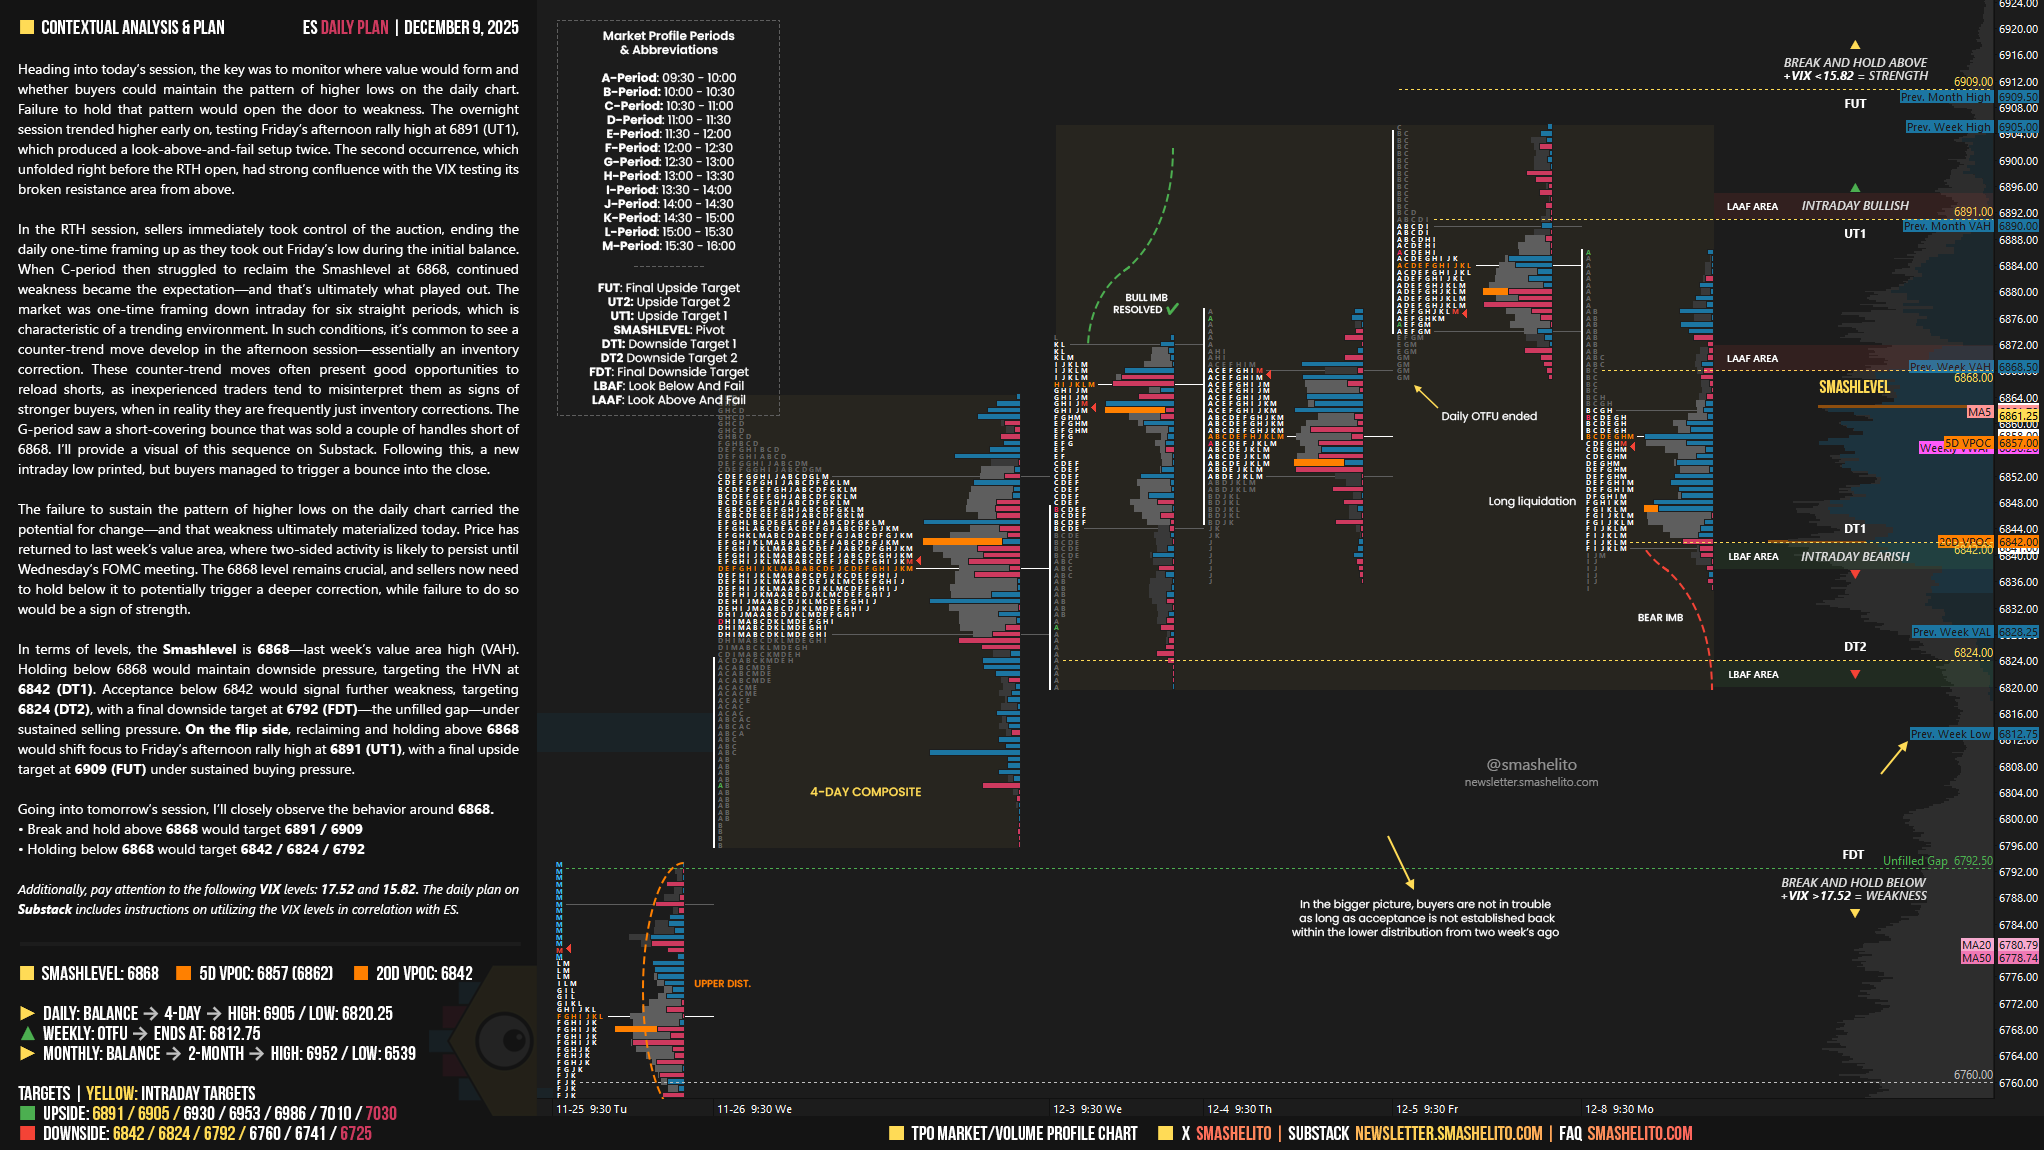
The failure to sustain the pattern of higher lows on the daily chart carried the potential for change—and that weakness ultimately materialized today. Price has returned to last week’s value area, where two-sided activity is likely to persist until Wednesday’s FOMC meeting. The 6868 level remains crucial, and sellers now need to hold below it to potentially trigger a deeper correction, while failure to do so would be a sign of strength.
In terms of levels, the Smashlevel is 6868—last week’s value area high (VAH). Holding below 6868 would maintain downside pressure, targeting the HVN at 6842 (DT1). Acceptance below 6842 would signal further weakness, targeting 6824 (DT2), with a final downside target at 6792 (FDT)—the unfilled gap—under sustained selling pressure.
On the flip side, reclaiming and holding above 6868 would shift focus to Friday’s afternoon rally high at 6891 (UT1), with a final upside target at 6909 (FUT) under sustained buying pressure.
Levels of Interest
Going into tomorrow’s session, I’ll closely observe the behavior around 6868.
Break and hold above 6868 would target 6891 / 6909
Holding below 6868 would target 6842 / 6824 / 6792
Additionally, pay attention to the following VIX levels: 17.52 and 15.82. These levels can provide confirmation of strength or weakness.
Break and hold above 6909 with VIX below 15.82 would confirm strength.
Break and hold below 6792 with VIX above 17.52 would confirm weakness.
Overall, it's important to exercise caution when trading outside of the highlighted yellow levels. A non-cooperative VIX may suggest possible reversals i.e trade setups.
Thank you
Thank you Smash!