
ES Daily Plan | December 19, 2025
Market Context & Key Levels for the Day Ahead

— For new subscribers
The yellow levels highlighted at the bottom left of the chart are the primary intraday levels I focus on. To avoid impulsive decisions at poor trade locations, I follow a simple but effective rule: exercise caution when initiating trades outside of these yellow levels.
This means I’m cautious about chasing longs above the Final Upside Target (FUT) and shorts below the Final Downside Target (FDT). It’s important to understand that not chasing does not imply initiating a trade in the opposite direction — discipline over impulse.
Be sure to review the Weekly Plan for a broader perspective, key levels, and market expectations for the week ahead.

Contract Rollover
A quick reminder: I’ve transitioned to the ESH26 (March) contract. For reference, I do not back-adjust my charts.
Contextual Analysis & Plan
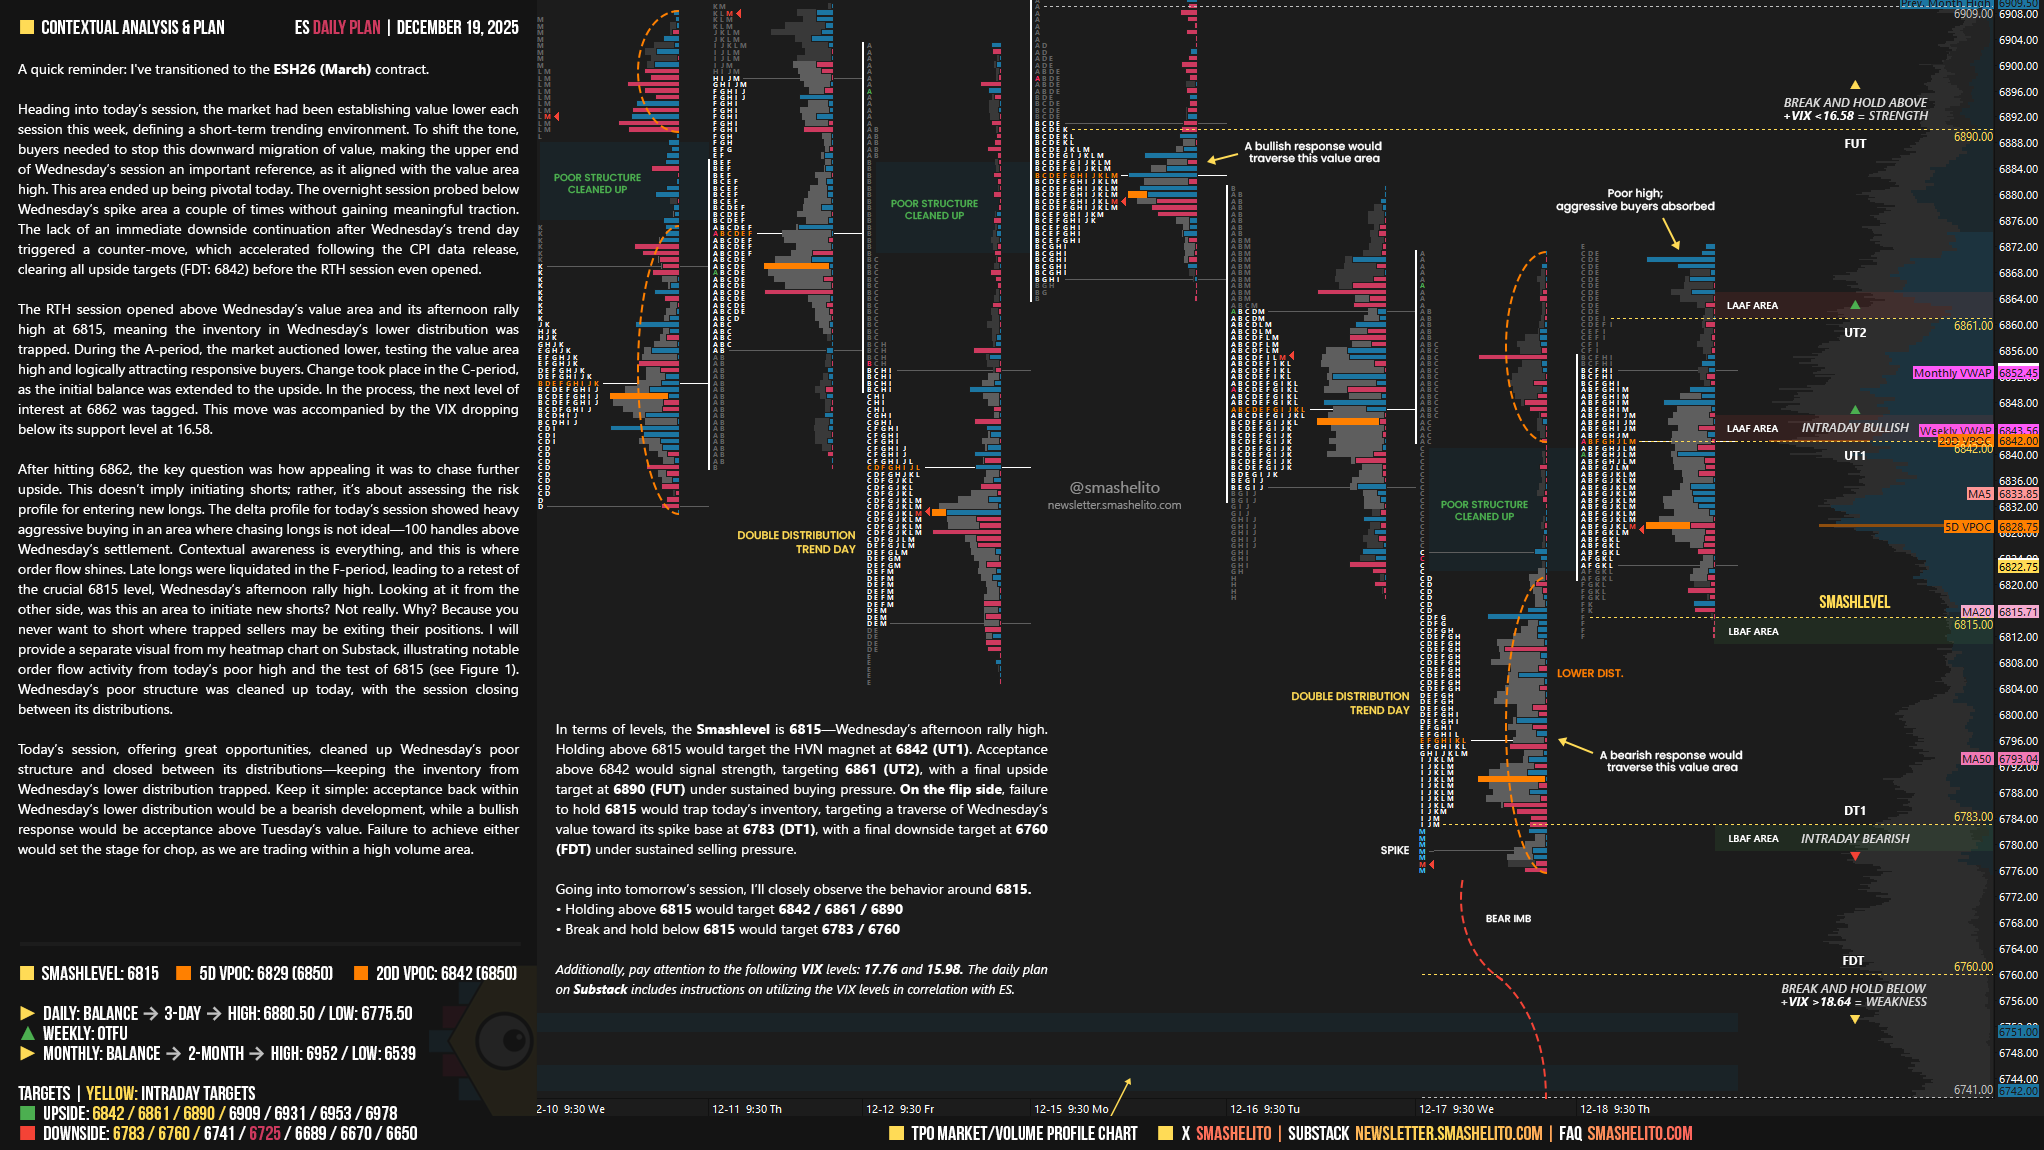
Heading into today’s session, the market had been establishing value lower each session this week, defining a short-term trending environment. To shift the tone, buyers needed to stop this downward migration of value, making the upper end of Wednesday’s session an important reference, as it aligned with the value area high. This area ended up being pivotal today. The overnight session probed below Wednesday’s spike area a couple of times without gaining meaningful traction. The lack of an immediate downside continuation after Wednesday’s trend day triggered a counter-move, which accelerated following the CPI data release, clearing all upside targets (FDT: 6842) before the RTH session even opened.
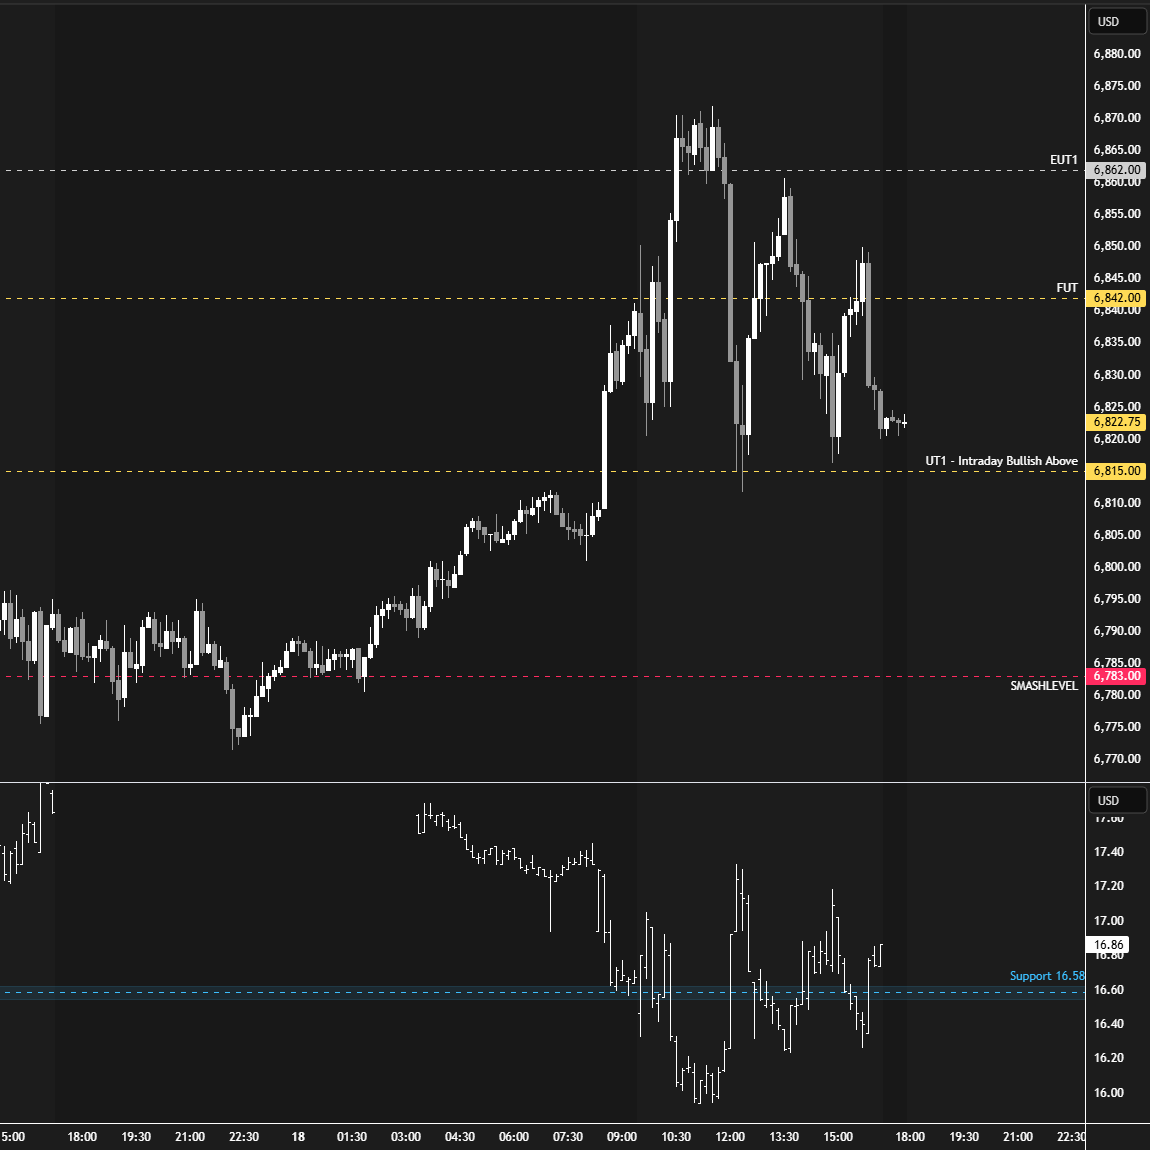
The RTH session opened above Wednesday’s value area and its afternoon rally high at 6815, meaning the inventory in Wednesday’s lower distribution was trapped. During the A-period, the market auctioned lower, testing the value area high and logically attracting responsive buyers. Change took place in the C-period, as the initial balance was extended to the upside. In the process, the next level of interest at 6862 was tagged. This move was accompanied by the VIX dropping below its support level at 16.58.
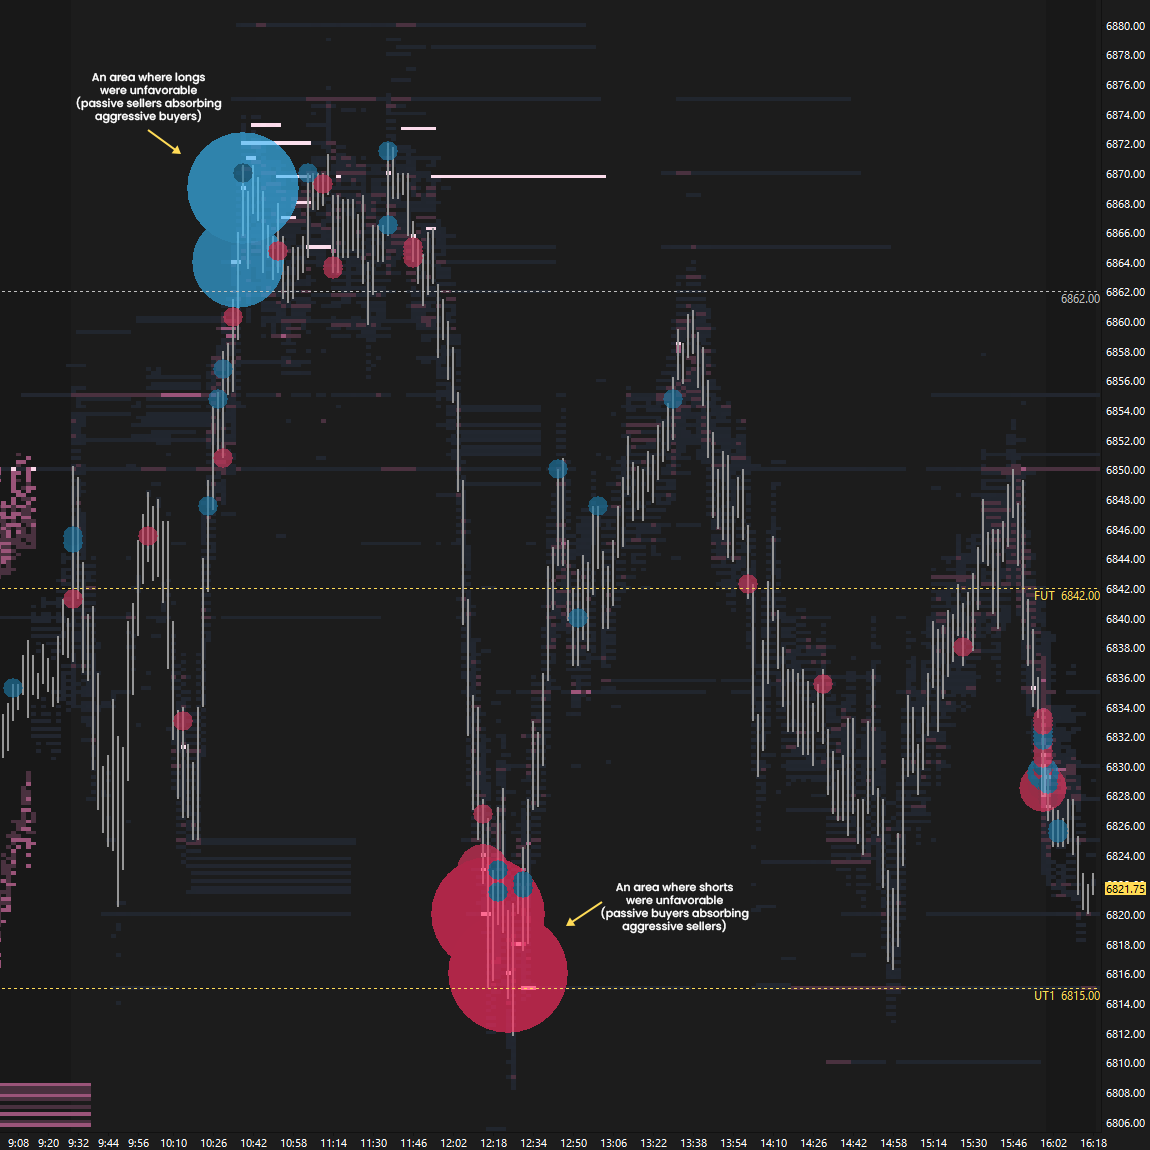
After hitting 6862, the key question was how appealing it was to chase further upside. This doesn’t imply initiating shorts; rather, it’s about assessing the risk profile for entering new longs. The delta profile for today’s session showed heavy aggressive buying in an area where chasing longs is not ideal—100 handles above Wednesday’s settlement. Contextual awareness is everything, and this is where order flow shines. Late longs were liquidated in the F-period, leading to a retest of the crucial 6815 level, Wednesday’s afternoon rally high. Looking at it from the other side, was this an area to initiate new shorts? Not really. Why? Because you never want to short where trapped sellers may be exiting their positions. I will provide a separate visual from my heatmap chart on Substack, illustrating notable order flow activity from today’s poor high and the test of 6815 (see Figure 1). Wednesday’s poor structure was cleaned up today, with the session closing between its distributions.
Today’s session, offering great opportunities, cleaned up Wednesday’s poor structure and closed between its distributions—keeping the inventory from Wednesday’s lower distribution trapped. Keep it simple: acceptance back within Wednesday’s lower distribution would be a bearish development, while a bullish response would be acceptance above Tuesday’s value. Failure to achieve either would set the stage for chop, as we are trading within a high volume area.
In terms of levels, the Smashlevel is 6815—Wednesday’s afternoon rally high. Holding above 6815 would target the HVN magnet at 6842 (UT1). Acceptance above 6842 would signal strength, targeting 6861 (UT2), with a final upside target at 6890 (FUT) under sustained buying pressure.
On the flip side, failure to hold 6815 would trap today’s inventory, targeting a traverse of Wednesday’s value toward its spike base at 6783 (DT1), with a final downside target at 6760 (FDT) under sustained selling pressure.
Levels of Interest
Going into tomorrow’s session, I’ll closely observe the behavior around 6815.
Holding above 6815 would target 6842 / 6861 / 6890
Break and hold below 6815 would target 6783 / 6760
Additionally, pay attention to the following VIX levels: 17.76 and 15.98. These levels can provide confirmation of strength or weakness.
Break and hold above 6890 with VIX below 15.98 would confirm strength.
Break and hold below 6760 with VIX above 17.76 would confirm weakness.
Overall, it's important to exercise caution when trading outside of the highlighted yellow levels. A non-cooperative VIX may suggest possible reversals i.e trade setups.
Love the notes on context. Thanks.
Very useful notes on yesterday session. Thank you!