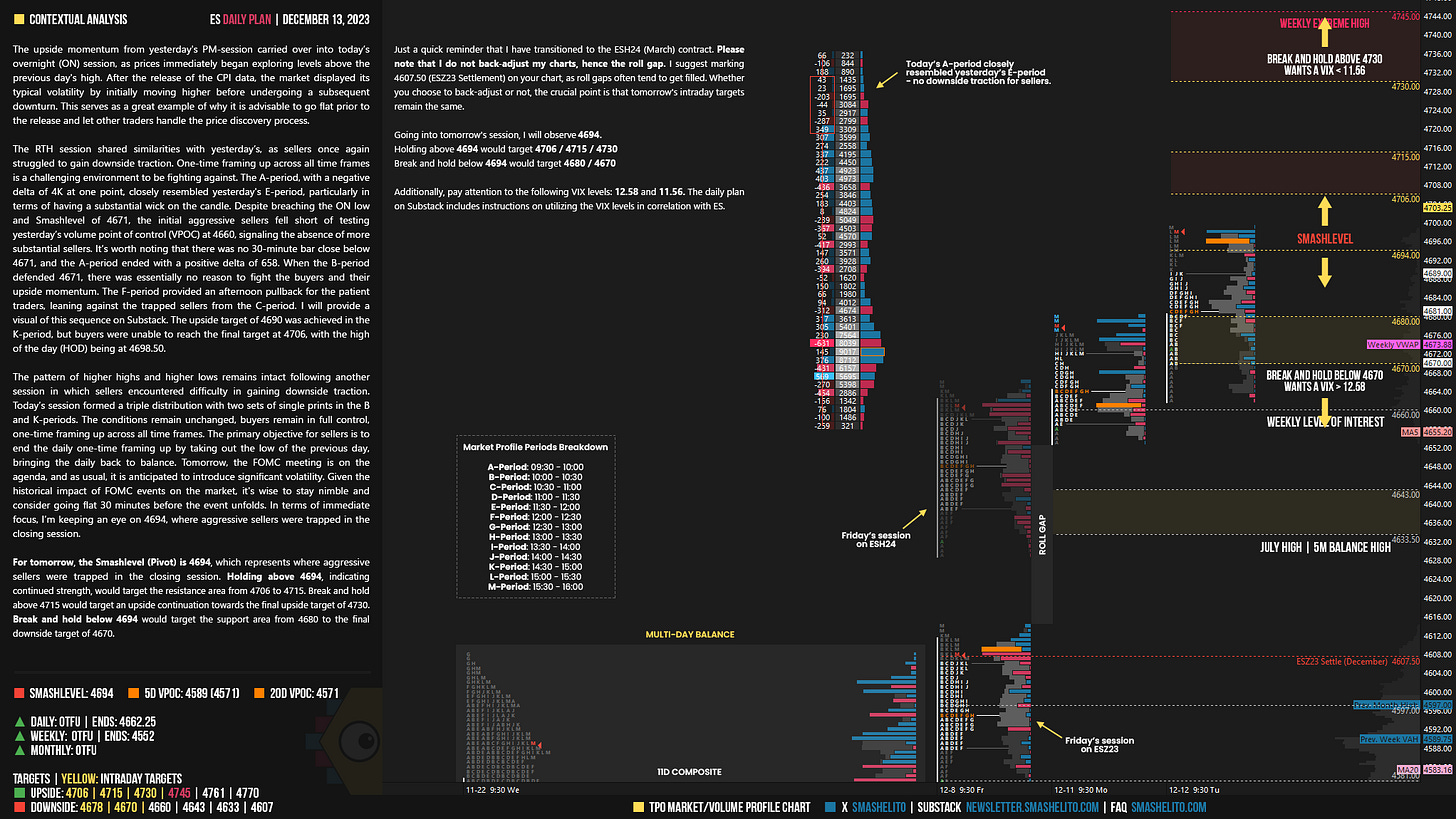
ES Daily Plan | December 13, 2023
The pattern of higher highs and higher lows remains intact following another session in which sellers encountered difficulty in gaining downside traction. FOMC tomorrow.
Visual Representation
For new followers, the yellow levels highlighted at the bottom are the primary levels that I focus on intraday. My strategy for preventing impulsive decisions at unfavorable locations involves following a simple yet effective rule of exercising caution when initiating trades outside of the yellow levels. This implies that I am cautious chasing longs above the final yellow upside target and shorts below the final yellow downside target. It is crucial to understand that refraining from chasing a trade is not an automatic invitation to initiate a trade in the opposite direction.
Contextual Analysis
Just a quick reminder that I have transitioned to the ESH24 (March) contract. Please note that I do not back-adjust my charts, hence the roll gap. I suggest marking 4607.50 (ESZ23 Settlement) on your chart, as roll gaps often tend to get filled. Whether you choose to back-adjust or not, the crucial point is that tomorrow's intraday targets remain the same.
The upside momentum from yesterday's PM-session carried over into today’s overnight (ON) session, as prices immediately began exploring levels above the previous day's high. After the release of the CPI data, the market displayed its typical volatility by initially moving higher before undergoing a subsequent downturn. This serves as a great example of why it is advisable to go flat prior to the release and let other traders handle the price discovery process.
The RTH session shared similarities with yesterday’s, as sellers once again struggled to gain downside traction. One-time framing up across all time frames is a challenging environment to be fighting against. The A-period, with a negative delta of 4K at one point, closely resembled yesterday's E-period, particularly in terms of having a substantial wick on the candle. Despite breaching the ON low and Smashlevel of 4671, the initial aggressive sellers fell short of testing yesterday’s volume point of control (VPOC) at 4660, signaling the absence of more substantial sellers. It’s worth noting that there was no 30-minute bar close below 4671, and the A-period ended with a positive delta of 658. When the B-period defended 4671, there was essentially no reason to fight the buyers and their upside momentum. The F-period provided an afternoon pullback for the patient traders, leaning against the trapped sellers from the C-period. I will provide a visual of this sequence on Substack. The upside target of 4690 was achieved in the K-period, but buyers were unable to reach the final target at 4706, with the high of the day (HOD) being at 4698.50.
The pattern of higher highs and higher lows remains intact following another session in which sellers encountered difficulty in gaining downside traction. Today’s session formed a triple distribution with two sets of single prints in the B and K-periods. The conditions remain unchanged, buyers remain in full control, one-time framing up across all time frames. The primary objective for sellers is to end the daily one-time framing up by taking out the low of the previous day, bringing the daily back to balance. Tomorrow, the FOMC meeting is on the agenda, and as usual, it is anticipated to introduce significant volatility. Given the historical impact of FOMC events on the market, it's wise to stay nimble and consider going flat 30 minutes before the event unfolds. In terms of immediate focus, I’m keeping an eye on 4694, where aggressive sellers were trapped in the closing session.
For tomorrow, the Smashlevel (Pivot) is 4694, which represents where aggressive sellers were trapped in the closing session. Holding above 4694, indicating continued strength, would target the resistance area from 4706 to 4715. Break and hold above 4715 would target an upside continuation towards the final upside target of 4730. Break and hold below 4694 would target the support area from 4680 to the final downside target of 4670.
Levels of Interest
Going into tomorrow's session, I will observe 4694.
Holding above 4694 would target 4706 / 4715 / 4730
Break and hold below 4694 would target 4680 / 4670
Additionally, pay attention to the following VIX levels: 12.58 and 11.56. These levels can provide confirmation of strength or weakness.
Break and hold above 4730 with VIX below 11.56 would confirm strength.
Break and hold below 4670 with VIX above 12.58 would confirm weakness.
Overall, it's important to exercise caution when trading outside of the highlighted yellow levels. A non-cooperative VIX may suggest possible reversals i.e trade setups.
Weekly Plan
Be sure to check out the Weekly Plan, which provides a broader perspective and highlights significant levels of interest to watch in the coming week.
Disclaimer: Futures and options trading involves a high level of risk, with the potential for substantial losses. The information provided in this newsletter is for informational purposes only and is not intended to be a trade recommendation. It is the responsibility of the reader to make their own investment decisions and they should seek the advice of a qualified securities professional before making any investments. The owners/authors of this newsletter are not certified as registered financial professionals or investment advisers.


Thanks for the post, thorough as usual. Can you tell me which study you use to show the candle on each bar on your numbers bars screen?
Great analysis as always. Keep up the good work brother.