ES Daily Plan | August 8, 2025
Market Context & Key Levels for the Day Ahead
— For new subscribers
The yellow levels highlighted at the bottom left of the chart are the primary intraday levels I focus on. To avoid impulsive decisions at poor trade locations, I follow a simple but effective rule: exercise caution when initiating trades outside of these yellow levels.
This means I’m cautious about chasing longs above the Final Upside Target (FUT) and shorts below the Final Downside Target (FDT). It’s important to understand that not chasing does not imply initiating a trade in the opposite direction — discipline over impulse.
Be sure to review the ES Weekly Plan | August 4-8, 2025 for a broader perspective, key levels, and market expectations for the week ahead.
Contextual Analysis & Plan
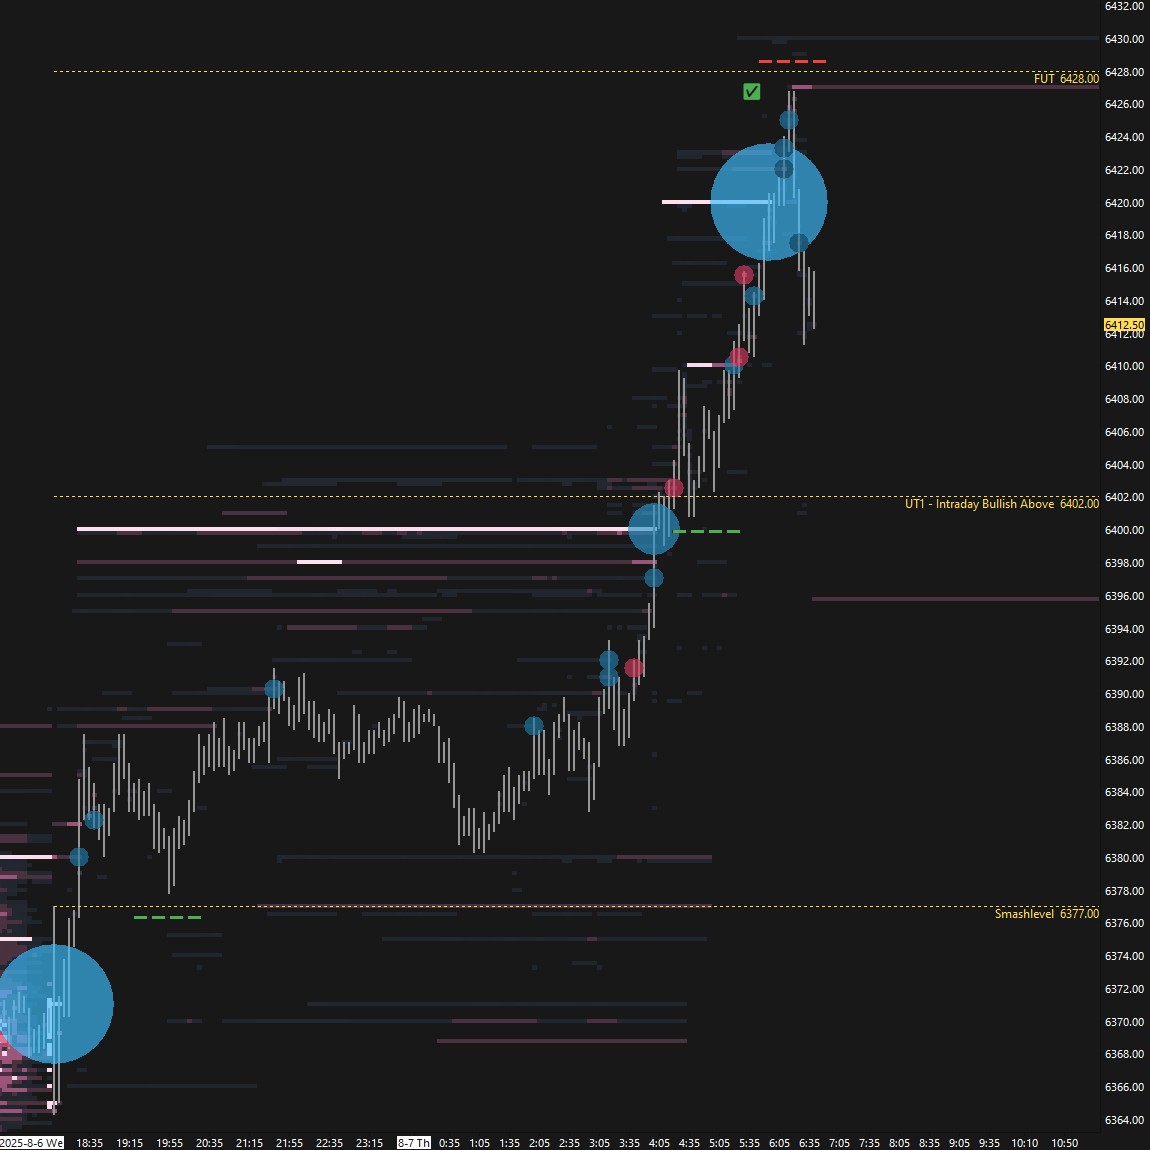
The overnight session immediately reclaimed the Smashlevel at 6377 after an early rejection, signaling strength in the context of Wednesday’s close at the upper end of the range—away from Monday’s and Tuesday’s value. Consolidation above Wednesday’s high led to an upside continuation during the European session. As a result, the UT1 at 6402 was tagged, exceeded, and held on a retest, setting up a move into the final upside target at 6428—driven by relentless initiating buying (see Figure 1). The market then pulled back from 6428 ahead of the RTH open, as the VIX approached its support level at 15.80 (LOD: 15.98).
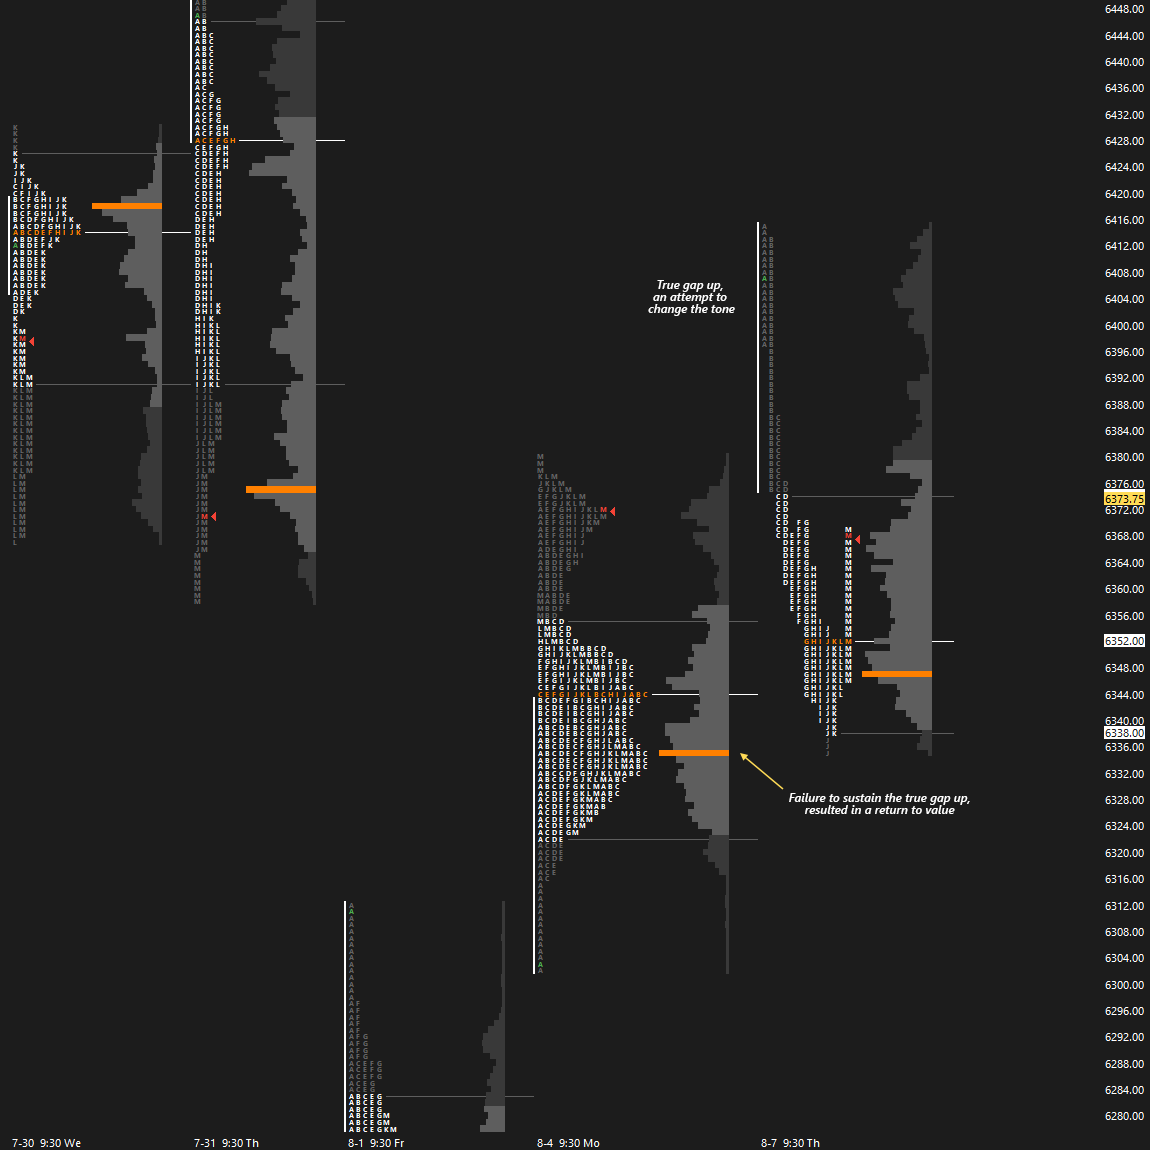
The RTH session opened on a true gap up, and similar to Tuesday’s session, buyers struggled to hold above the opening level while initially defending UT1 at 6402. Failure to hold above 6402 led to the formation of single prints in the B-period, also reminiscent of Tuesday’s session. As always, an inventory correction isn’t inherently bearish unless acceptance is established back within the prior day’s range. It’s important not to mistake early weakness for stronger sellers. The gap was filled in the B-period, stalling downside momentum—but only temporarily. Traction within the prior day’s range began to unfold during the second half of the C-period, a bearish development when gapping higher, as the attempt to change tone relative to the previous session was rejected.
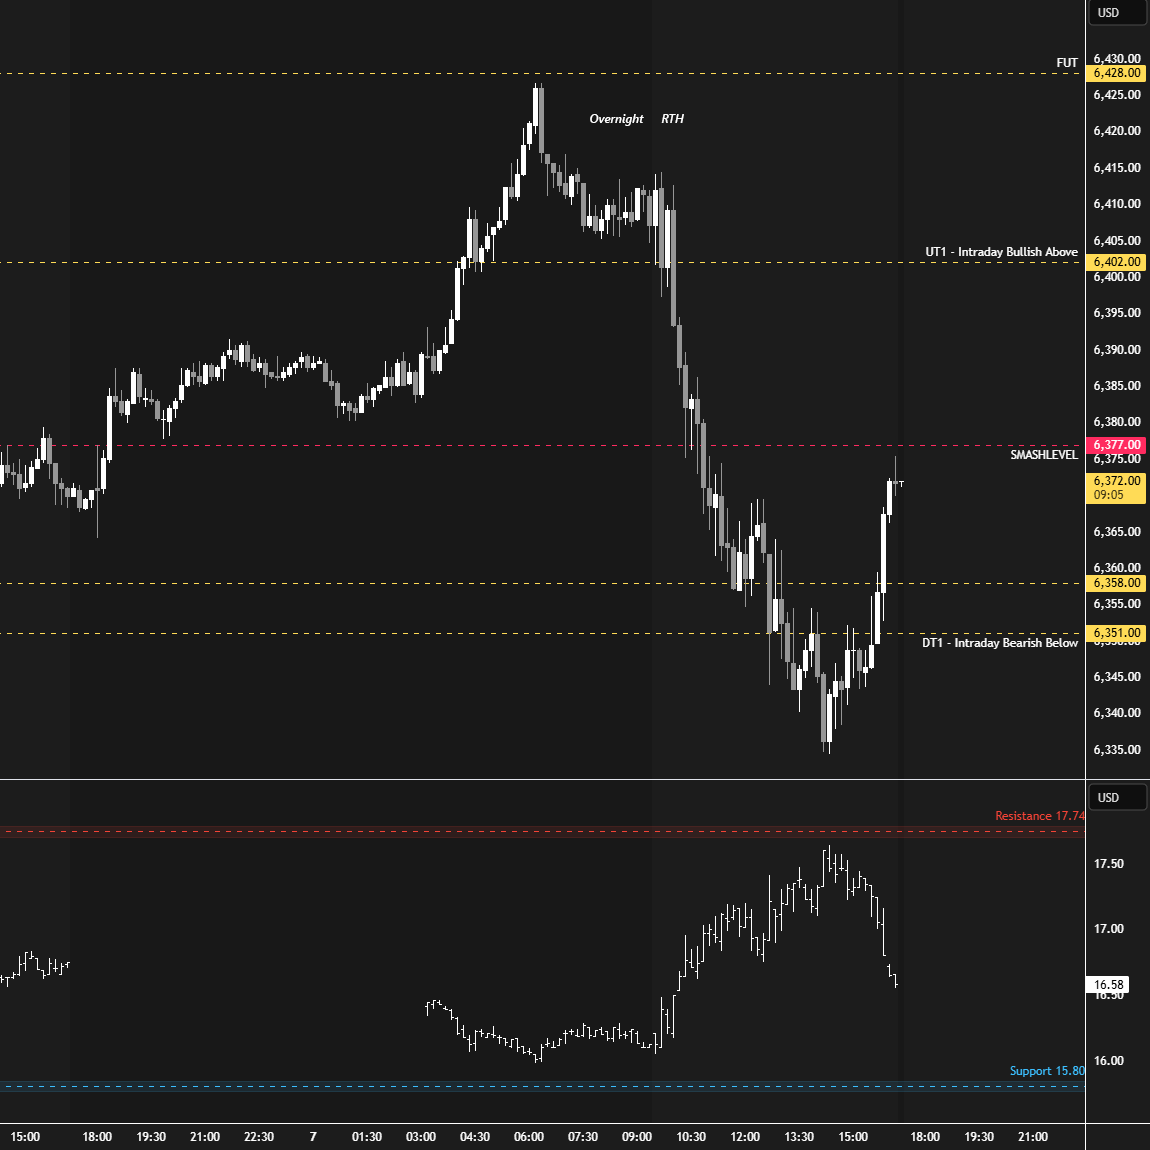
Sellers controlled the auction throughout the session, traversing Wednesday’s value area and almost its entire range. This was a good example of how markets move from balance (value) to imbalance (discovery) in search of a new area of acceptance. If acceptance is found, value builds there. If not—as was the case today—the market returns to prior value, such as the HVN at 6335 (see Figure 2). The closing session saw a squeeze and another close within last week’s upper distribution, with VIX once again closing below 17.10. Again, the VIX holding below 17.10 is a positive development for buyers.
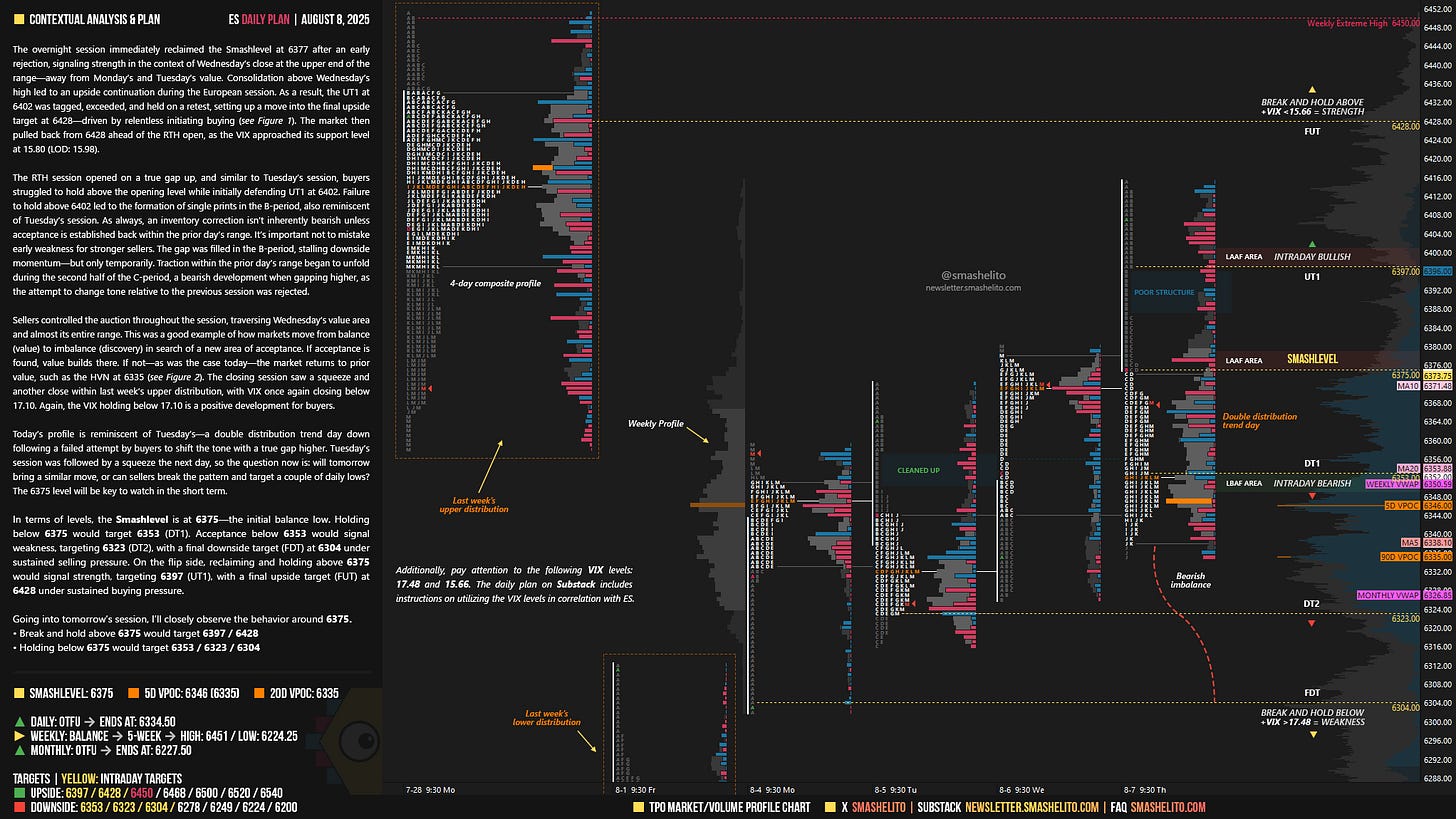
Today’s profile is reminiscent of Tuesday’s—a double distribution trend day down following a failed attempt by buyers to shift the tone with a true gap higher. Tuesday’s session was followed by a squeeze the next day, so the question now is: will tomorrow bring a similar move, or can sellers break the pattern and target a couple of daily lows? The 6375 level will be key to watch in the short term.
In terms of levels, the Smashlevel is at 6375—the initial balance low. Holding below 6375 would target 6353 (DT1). Acceptance below 6353 would signal weakness, targeting 6323 (DT2), with a final downside target (FDT) at 6304 under sustained selling pressure.
On the flip side, reclaiming and holding above 6375 would signal strength, targeting 6397 (UT1), with a final upside target (FUT) at 6428 under sustained buying pressure.
Levels of Interest
Going into tomorrow’s session, I’ll closely observe the behavior around 6375.
Break and hold above 6375 would target 6397 / 6428
Holding below 6375 would target 6353 / 6323 / 6304
Additionally, pay attention to the following VIX levels: 17.48 and 15.66. These levels can provide confirmation of strength or weakness.
Break and hold above 6428 with VIX below 15.66 would confirm strength.
Break and hold below 6304 with VIX above 17.48 would confirm weakness.
Overall, it's important to exercise caution when trading outside of the highlighted yellow levels. A non-cooperative VIX may suggest possible reversals i.e trade setups.


The value you deliver is incredible, I thank you.
Thank you for your valuable guide