
ES Daily Plan | August 6, 2025
Market Context & Key Levels for the Day Ahead

— For new subscribers
The yellow levels highlighted at the bottom left of the chart are the primary intraday levels I focus on. To avoid impulsive decisions at poor trade locations, I follow a simple but effective rule: exercise caution when initiating trades outside of these yellow levels.
This means I’m cautious about chasing longs above the Final Upside Target (FUT) and shorts below the Final Downside Target (FDT). It’s important to understand that not chasing does not imply initiating a trade in the opposite direction — discipline over impulse.
Be sure to review the ES Weekly Plan | August 4-8, 2025 for a broader perspective, key levels, and market expectations for the week ahead.
Contextual Analysis & Plan
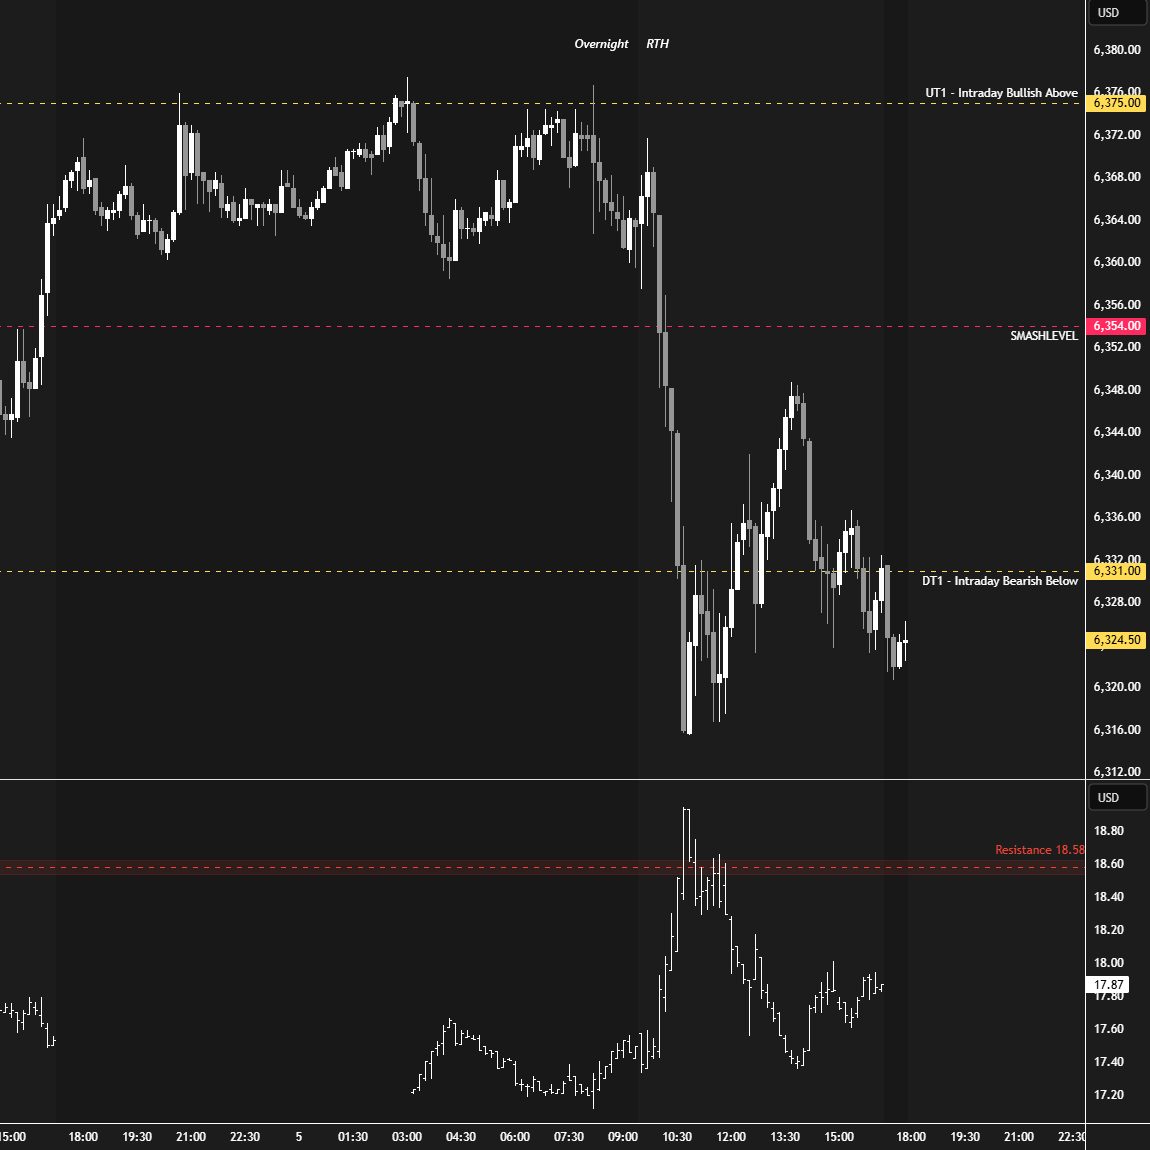
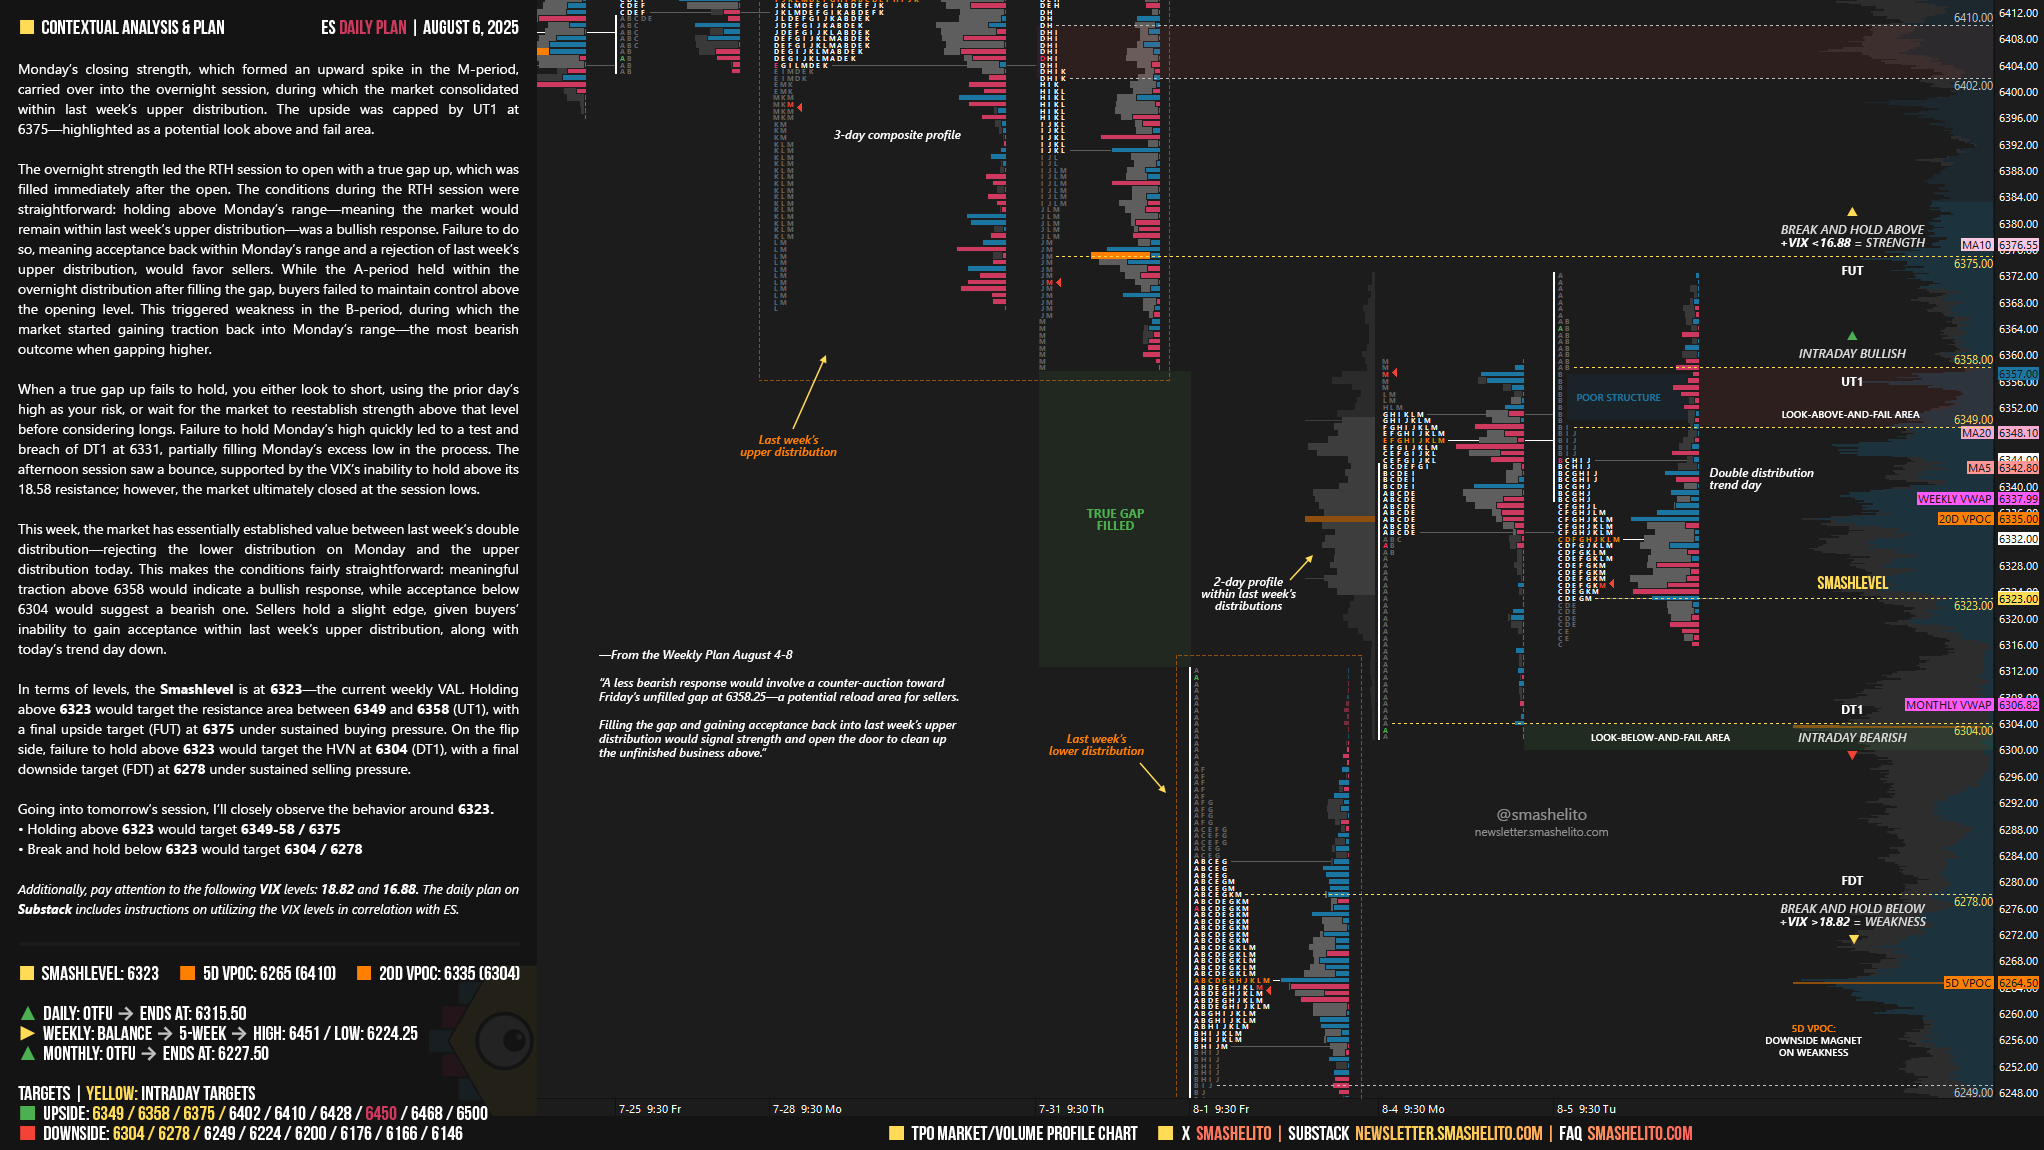
Monday’s closing strength, which formed an upward spike in the M-period, carried over into the overnight session, during which the market consolidated within last week’s upper distribution. The upside was capped by UT1 at 6375—highlighted as a potential look above and fail area.
The overnight strength led the RTH session to open with a true gap up, which was filled immediately after the open. The conditions during the RTH session were straightforward: holding above Monday’s range—meaning the market would remain within last week’s upper distribution—was a bullish response. Failure to do so, meaning acceptance back within Monday’s range and a rejection of last week’s upper distribution, would favor sellers. While the A-period held within the overnight distribution after filling the gap, buyers failed to maintain control above the opening level. This triggered weakness in the B-period, during which the market started gaining traction back into Monday’s range—the most bearish outcome when gapping higher.
When a true gap up fails to hold, you either look to short, using the prior day’s high as your risk, or wait for the market to reestablish strength above that level before considering longs. Failure to hold Monday’s high quickly led to a test and breach of DT1 at 6331, partially filling Monday’s excess low in the process. The afternoon session saw a bounce, supported by the VIX’s inability to hold above its 18.58 resistance; however, the market ultimately closed at the session lows.
This week, the market has essentially established value between last week’s double distribution—rejecting the lower distribution on Monday and the upper distribution today. This makes the conditions fairly straightforward: meaningful traction above 6358 would indicate a bullish response, while acceptance below 6304 would suggest a bearish one. Sellers hold a slight edge, given buyers’ inability to gain acceptance within last week’s upper distribution, along with today’s trend day down.
In terms of levels, the Smashlevel is at 6323—the current weekly VAL. Holding above 6323 would target the resistance area between 6349 and 6358 (UT1), with a final upside target (FUT) at 6375 under sustained buying pressure.
On the flip side, failure to hold above 6323 would target the HVN at 6304 (DT1), with a final downside target (FDT) at 6278 under sustained selling pressure.
Levels of Interest
Going into tomorrow’s session, I’ll closely observe the behavior around 6323.
Holding above 6323 would target 6349-58 / 6375
Break and hold below 6323 would target 6304 / 6278
Additionally, pay attention to the following VIX levels: 18.82 and 16.88. These levels can provide confirmation of strength or weakness.
Break and hold above 6375 with VIX below 16.88 would confirm strength.
Break and hold below 6278 with VIX above 18.82 would confirm weakness.
Overall, it's important to exercise caution when trading outside of the highlighted yellow levels. A non-cooperative VIX may suggest possible reversals i.e trade setups.
Thank you Smash!
Thanks Smash!