

— For new subscribers
The yellow levels highlighted at the bottom left of the chart are the primary intraday levels I focus on. To avoid impulsive decisions at poor trade locations, I follow a simple but effective rule: exercise caution when initiating trades outside of these yellow levels.
This means I’m cautious about chasing longs above the Final Upside Target (FUT) and shorts below the Final Downside Target (FDT). It’s important to understand that not chasing does not imply initiating a trade in the opposite direction. Discipline over impulse.
Be sure to review the Weekly Plan for a broader perspective, key levels, and market expectations for the week ahead.

Contextual Analysis & Plan
The overnight session opened with strength following the NVDA earnings report. The market came within a few handles of tagging the final upside target at 7746 (FUT). Today was a great example of how tricky it can be to chase the market at a poor trade location. If you’re not already in a position, chasing longs near FUT levels or shorts near FDT levels is generally not a great strategy, as regular readers of this newsletter are aware. A more patient approach is to play defense by identifying the areas where you want to engage should the market pull back. Essentially, you’re planning where to enter at a better trade location from a risk-reward perspective. If the market proceeds higher without you, so be it.
Patient traders who avoided chasing the early overnight strength were heavily rewarded in today’s RTH session after a perfect hold of the 7705 pivot (Smashlevel) during the A-period. A gap-fill reversal marked today’s low, from which buyers initiated a multi-day balance breakout. The main target was a full traverse of last week’s value area, which was accomplished during the G-period after tagging 7746 (FUT). Notable aggressive selling activity stepped in above 7746, and the session ultimately closed back within the value area.
Session Recap
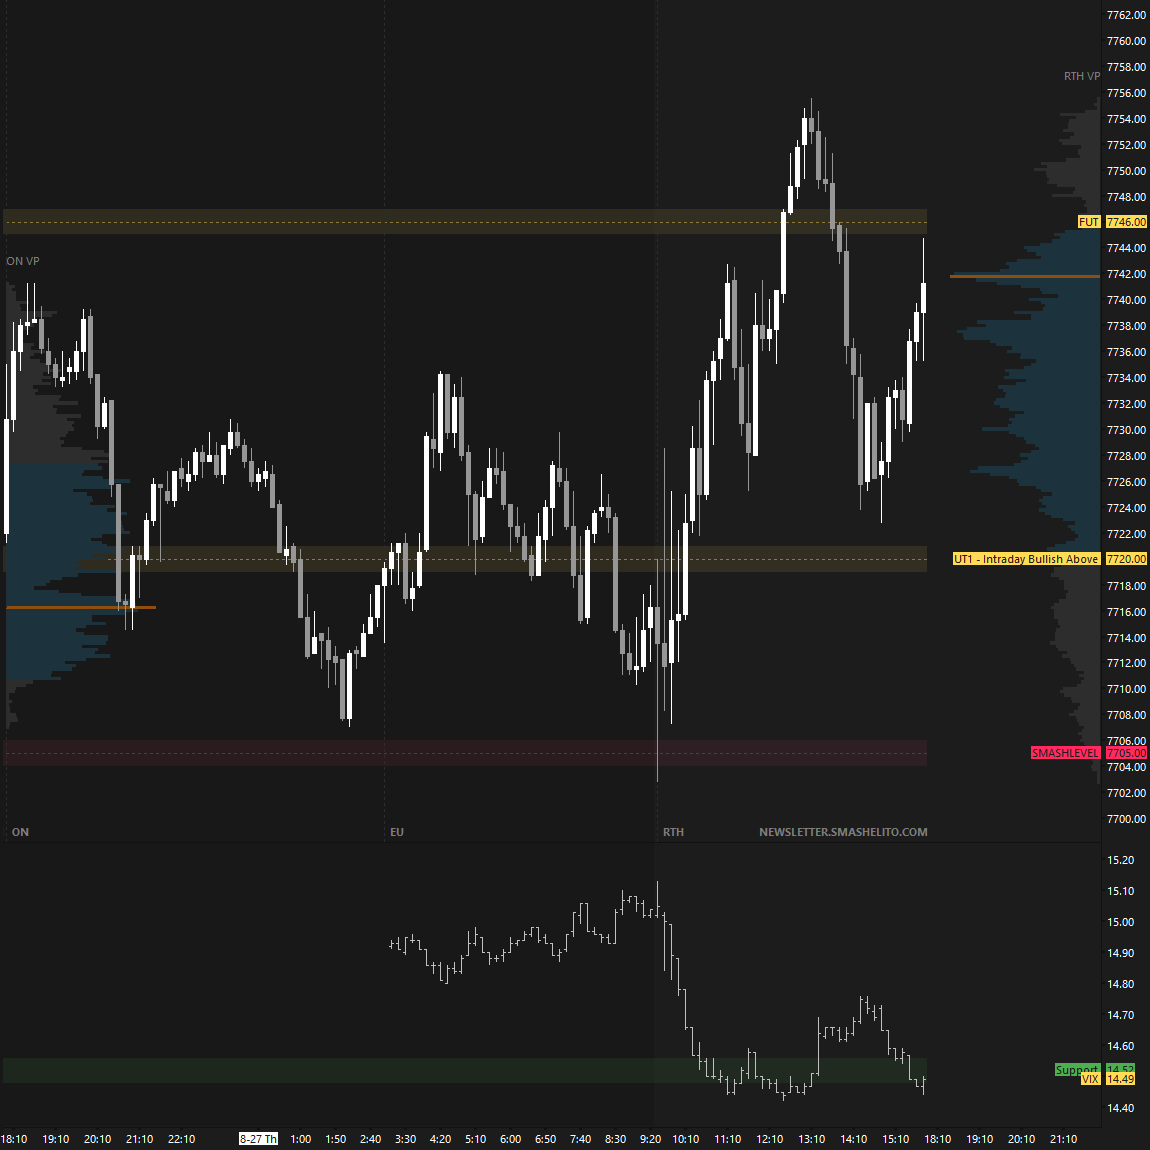
Today’s session saw a breakout from the multi-day balance, filling one of last week’s bear gaps and completing a traverse of last week’s value area in the process. As always, when the auction attempts to transition from balance to imbalance, our job is to monitor for continuation—or lack thereof.
A strong response would involve reclaiming last week’s VAH at 7746, which aligns closely with today’s VAH. This would indicate buyers are willing to initiate activity above value, supporting the transition into imbalance.
Failure to hold today’s afternoon pullback low at 7724, which closely aligns with the multi-day balance high, would be a cautionary sign.
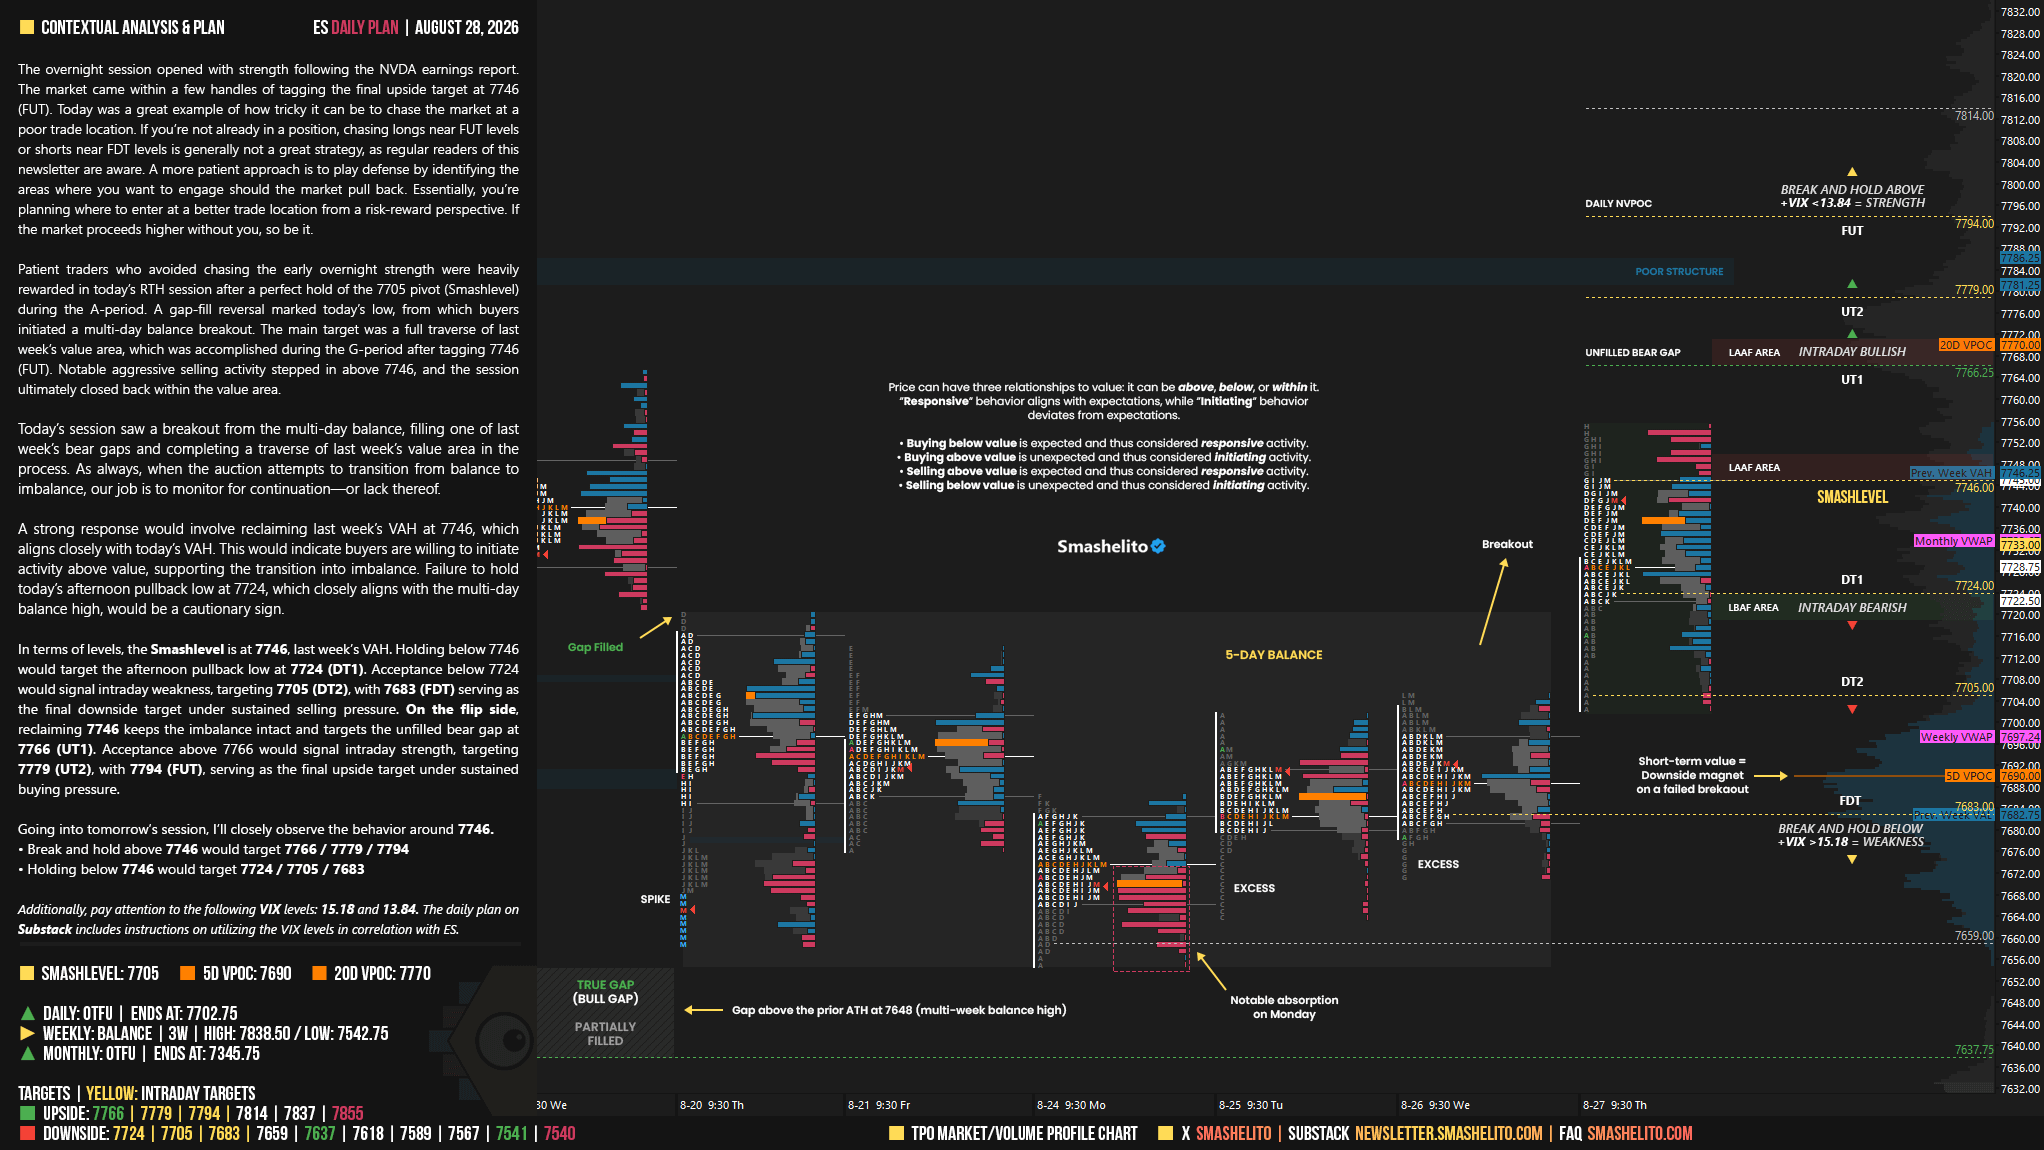
In terms of levels, the Smashlevel is at 7746, last week’s VAH. Holding below 7746 would target the afternoon pullback low at 7724 (DT1). Acceptance below 7724 would signal intraday weakness, targeting 7705 (DT2), with 7683 (FDT) serving as the final downside target under sustained selling pressure.
On the flip side, reclaiming 7746 keeps the imbalance intact and targets the unfilled bear gap at 7766 (UT1). Acceptance above 7766 would signal intraday strength, targeting 7779 (UT2), with 7794 (FUT), serving as the final upside target under sustained buying pressure.
Visual Representation
Levels of Interest
Going into tomorrow’s session, I’ll closely observe the behavior around 7746.
Break and hold above 7746 would target 7766 / 7779 / 7794
Holding below 7746 would target 7724 / 7705 / 7683
Additionally, pay attention to the following VIX levels: 15.18 and 13.84. These levels can provide confirmation of strength or weakness.
Break and hold above 7794 with VIX below 13.84 would confirm strength.
Break and hold below 7683 with VIX above 15.18 would confirm weakness.
Overall, it's important to exercise caution when trading outside of the highlighted yellow levels. A non-cooperative VIX may suggest possible reversals i.e trade setups.
Thanks smash
Thanks v much Smash !! What charting package are you using ?