

— For new subscribers
The yellow levels highlighted at the bottom left of the chart are the primary intraday levels I focus on. To avoid impulsive decisions at poor trade locations, I follow a simple but effective rule: exercise caution when initiating trades outside of these yellow levels.
This means I’m cautious about chasing longs above the Final Upside Target (FUT) and shorts below the Final Downside Target (FDT). It’s important to understand that not chasing does not imply initiating a trade in the opposite direction. Discipline over impulse.
Be sure to review the Weekly Plan for a broader perspective, key levels, and market expectations for the week ahead.

Contextual Analysis & Plan
Quick update, as the context remains unchanged following today’s session. The overnight session closely resembled Tuesday’s RTH session, with the initial weakness getting retraced before the market consolidated above last week’s VAL at 7683 (Smashlevel). The RTH session followed a similar pattern, with value developing above 7683 while responsive buyers continued to step in on dips. Notably, both Tuesday and Wednesday’s sessions formed excess lows, finding responsive buyers in the area where aggressive sellers were absorbed on Monday.
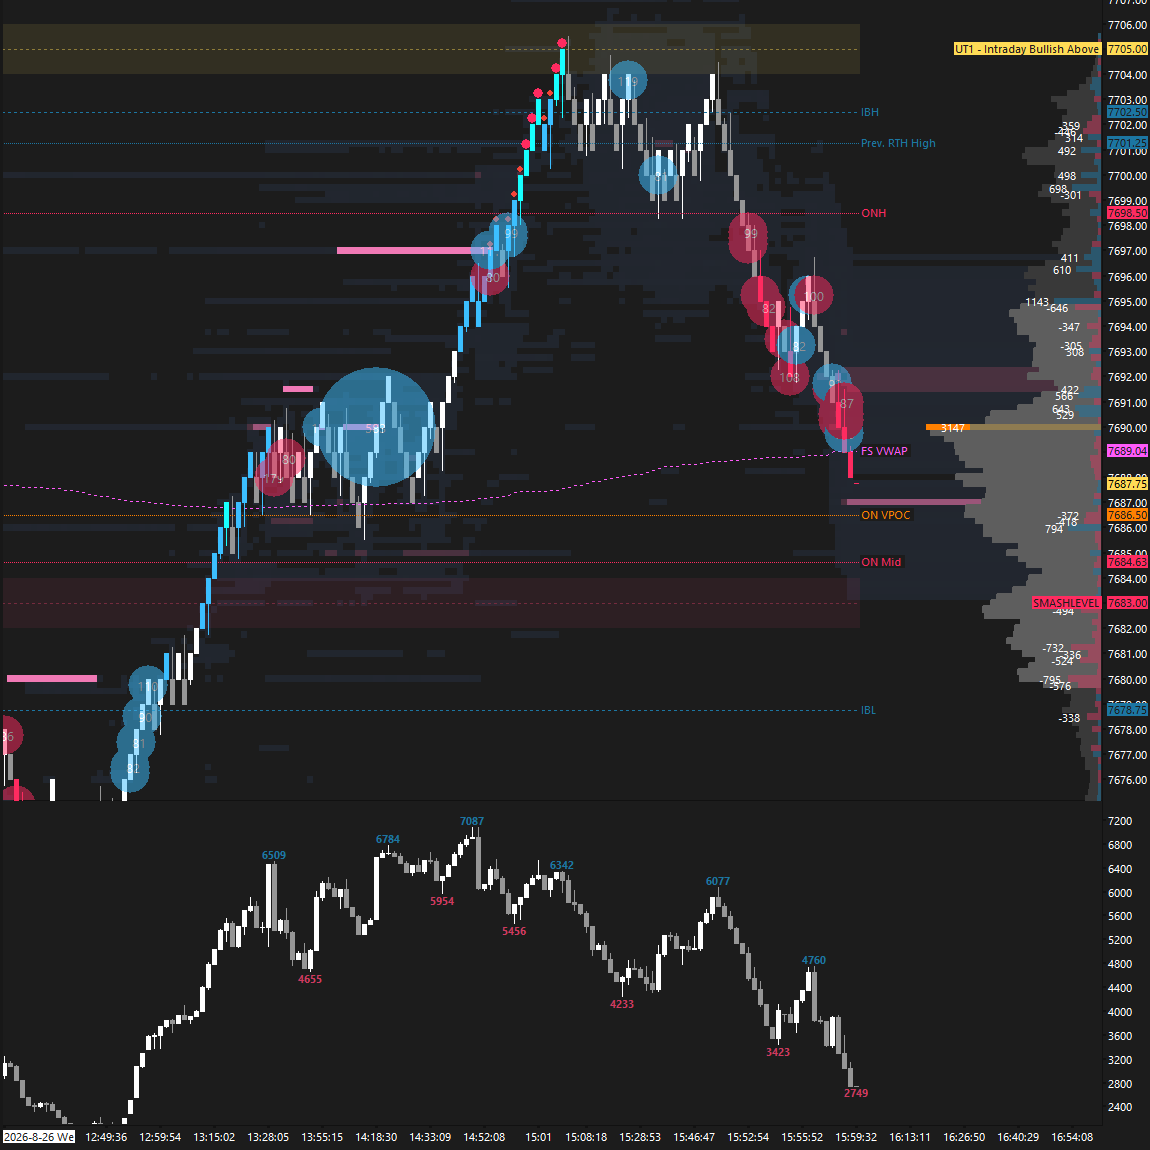
In the last hour of RTH, marked by the L- and M-periods, the market tested 7705 (UT1), from which a closing reversal unfolded. Typically, the market needs to either break and hold above UT1 or below DT1 to establish a more directional tone. If you were betting on a non-directional market ahead of NVDA earnings, 7705 (UT1) was a solid level to fade, made even more interesting by signs of exhaustion (see Figure 1).
Session Recap
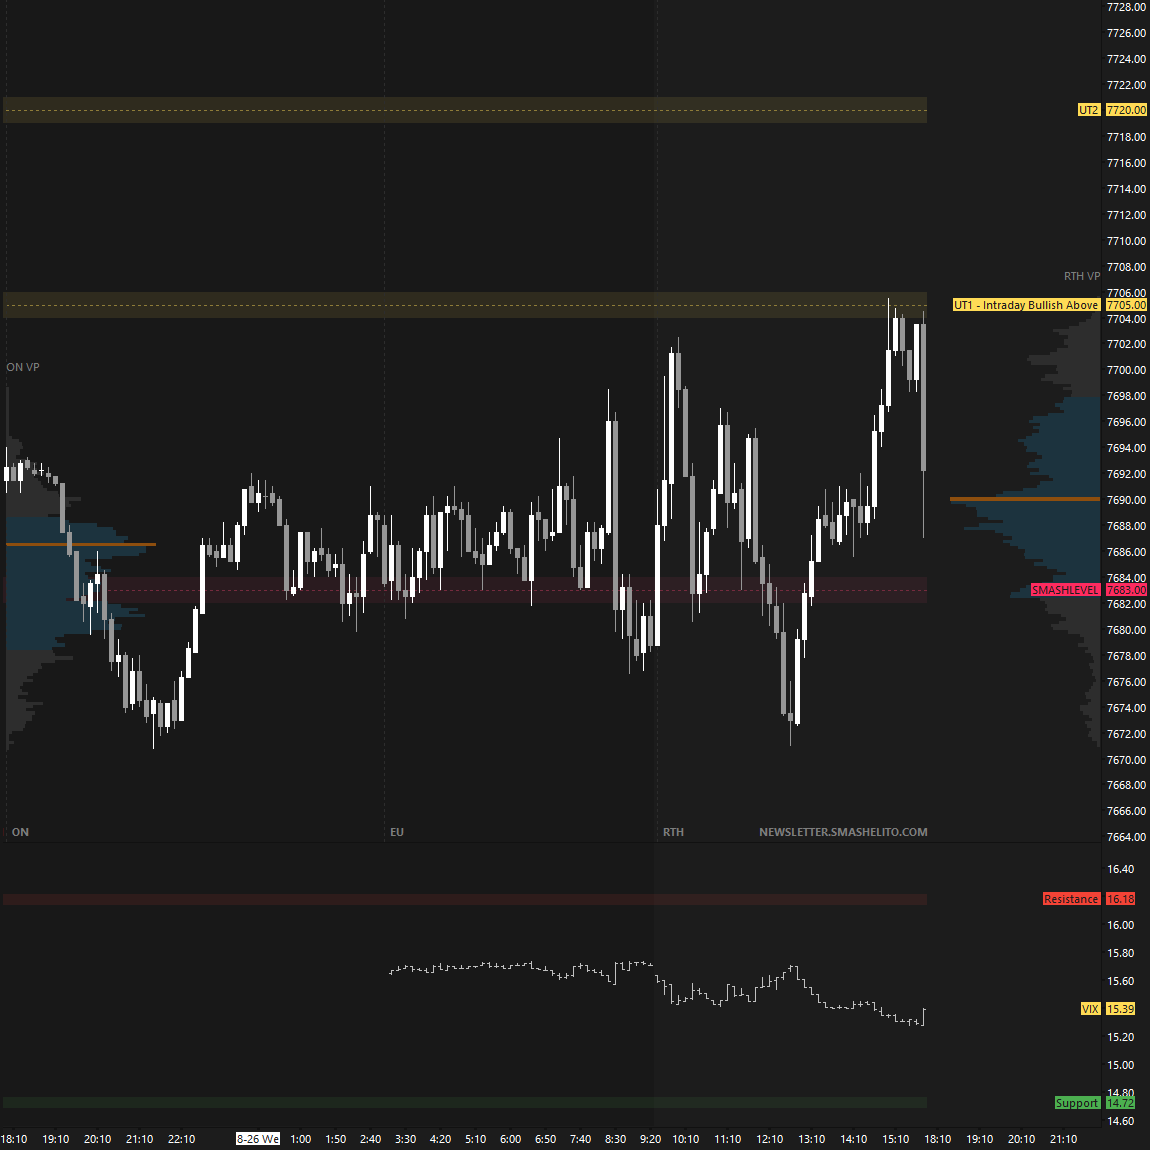
The market remains in a state of indecision, now forming a 5-day balance area. The session closed right at the developing Weekly VPOC before after-hours trading rotated higher, breaking out of today’s range.
The key question now is whether buyers can sustain the after-hours strength and target a traverse of last week’s value area, following two consecutive excess lows below last week’s VAL.
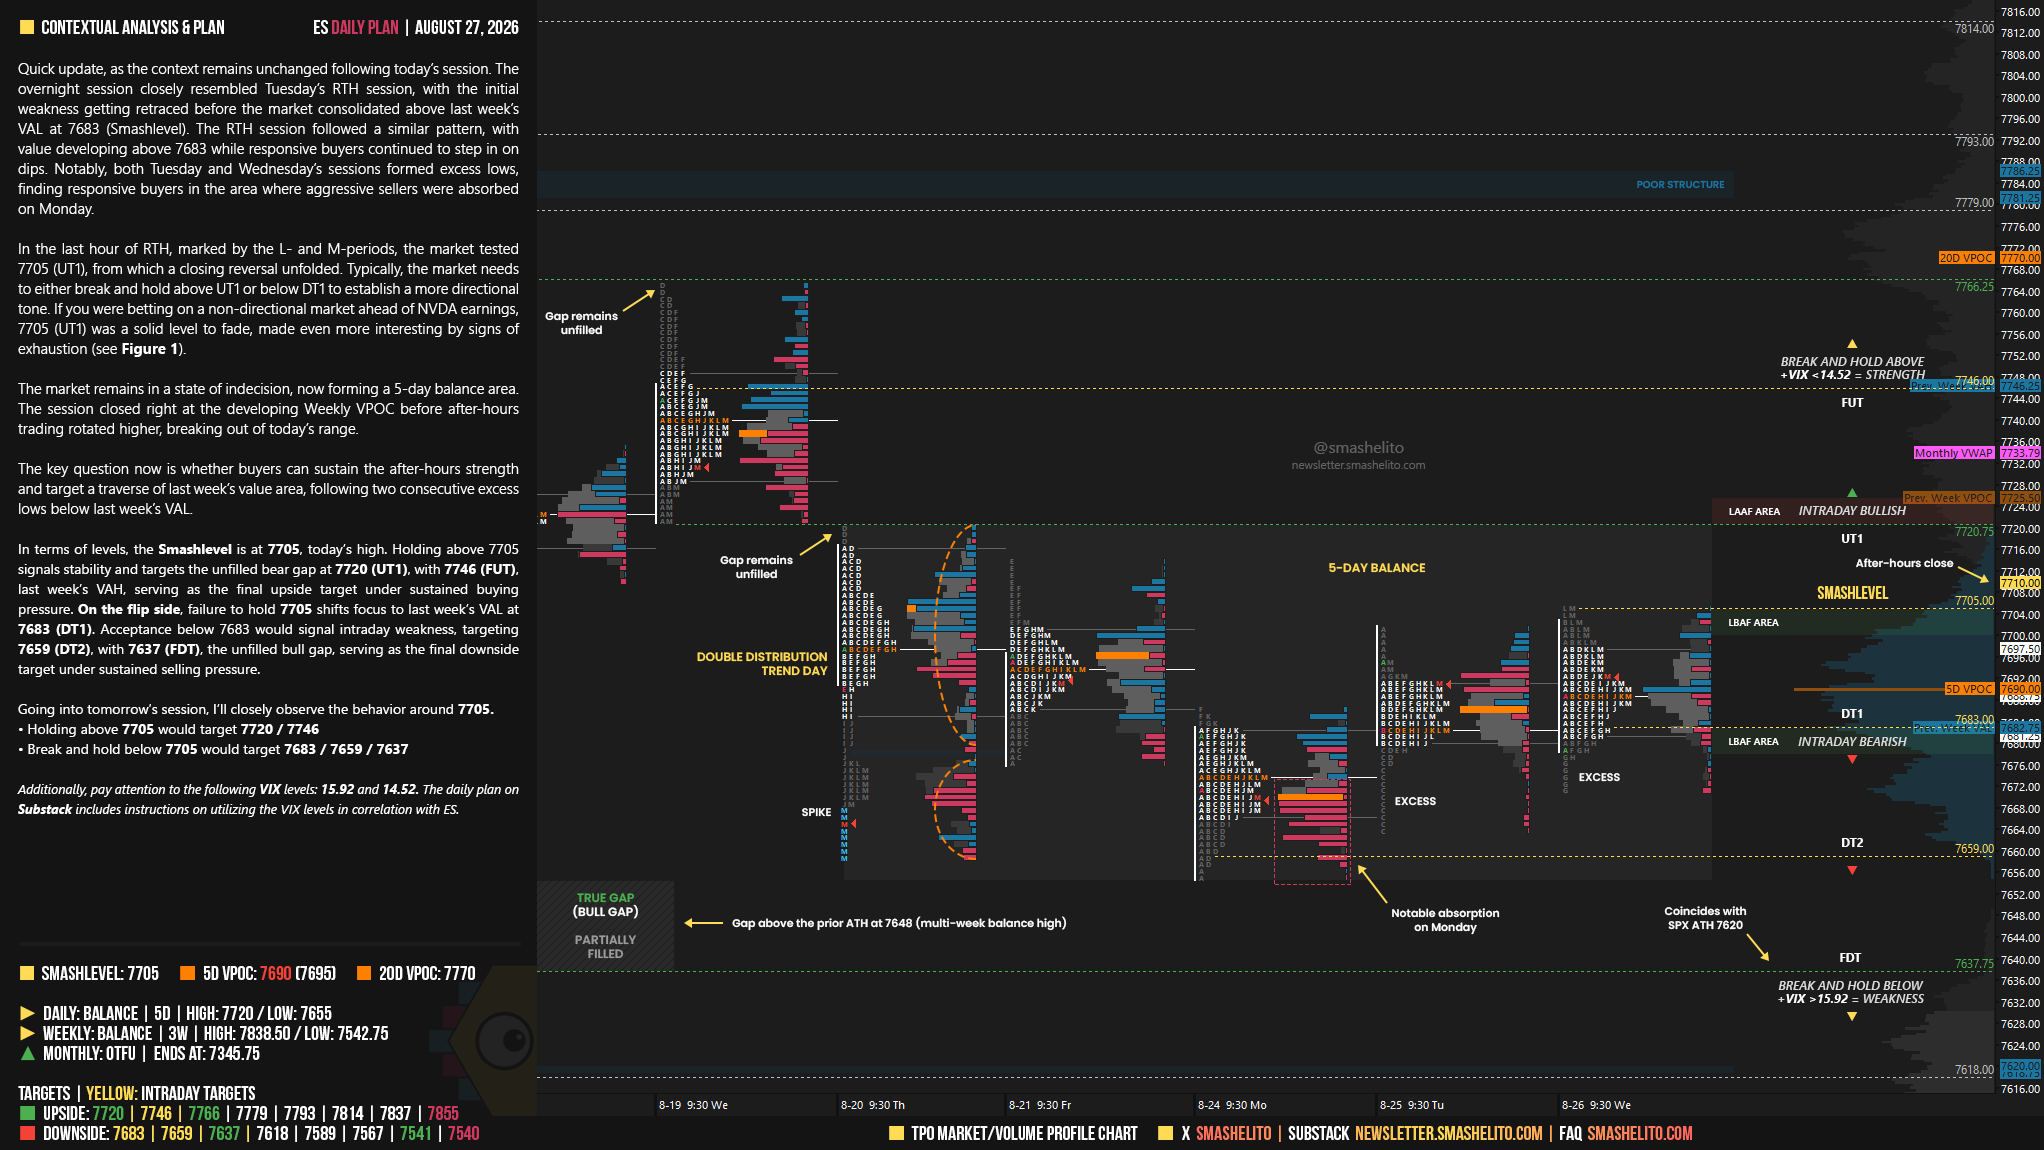
In terms of levels, the Smashlevel is at 7705, today’s high. Holding above 7705 signals stability and targets the unfilled bear gap at 7720 (UT1), with 7746 (FUT), last week’s VAH, serving as the final upside target under sustained buying pressure.
On the flip side, failure to hold 7705 shifts focus to last week’s VAL at 7683 (DT1). Acceptance below 7683 would signal intraday weakness, targeting 7659 (DT2), with 7637 (FDT), the unfilled bull gap, serving as the final downside target under sustained selling pressure.
I would also observe the behavior around 29375 on NQ, with potential upside targets at 29490 and 29635.
Visual Representation
Levels of Interest
Going into tomorrow’s session, I’ll closely observe the behavior around 7705.
Holding above 7705 would target 7720 / 7746
Break and hold below 7705 would target 7683 / 7659 / 7637
Additionally, pay attention to the following VIX levels: 15.92 and 14.52. These levels can provide confirmation of strength or weakness.
Break and hold above 7746 with VIX below 14.52 would confirm strength.
Break and hold below 7637 with VIX above 15.92 would confirm weakness.
Overall, it's important to exercise caution when trading outside of the highlighted yellow levels. A non-cooperative VIX may suggest possible reversals i.e trade setups.
Thanks for everything, Smash! Have a great session! Thanks for all the explanations, you're a great help!
Thanks Smash!