ES Daily Plan | August 26, 2025
Market Context & Key Levels for the Day Ahead
— For new subscribers
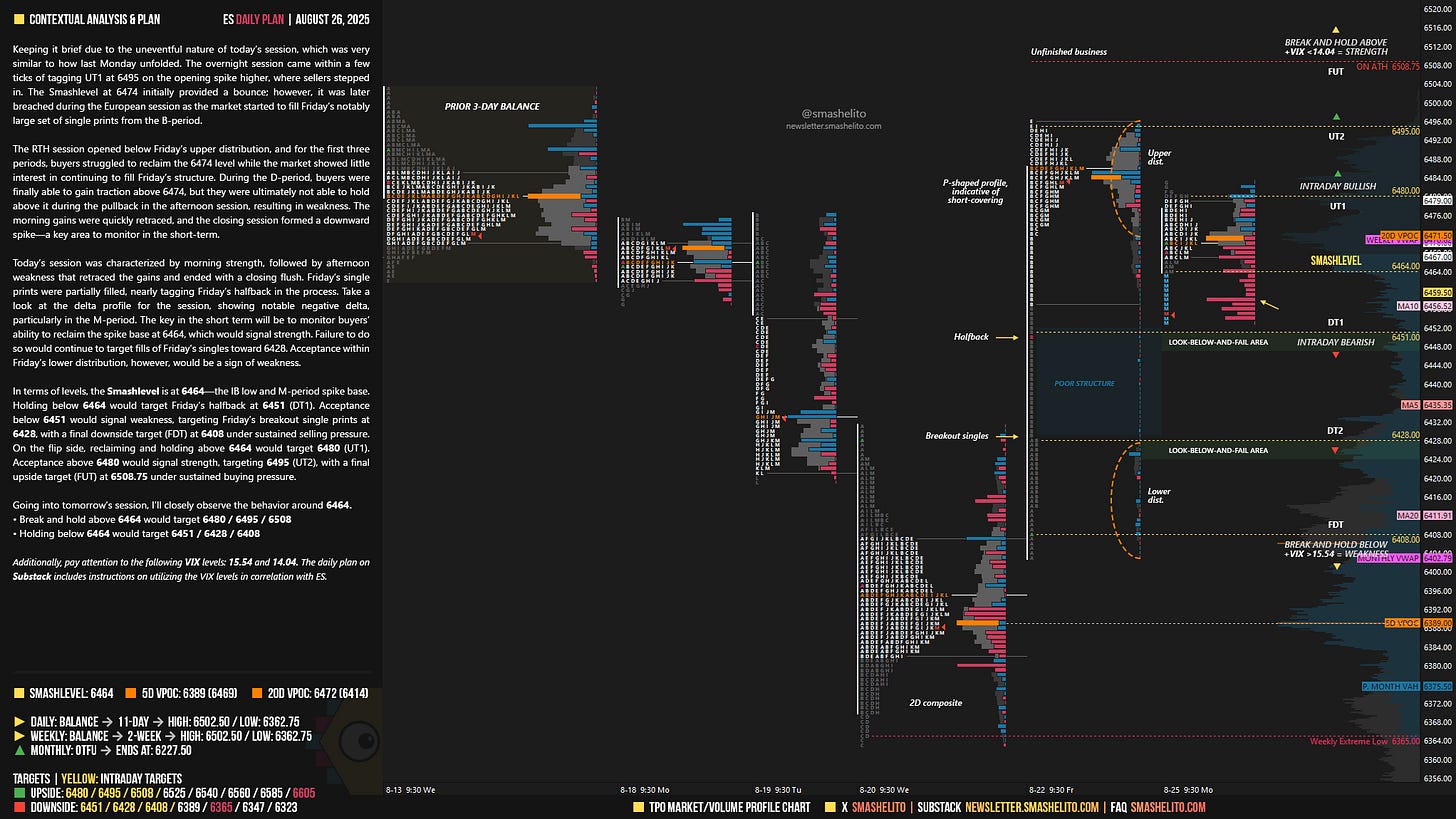
The yellow levels highlighted at the bottom left of the chart are the primary intraday levels I focus on. To avoid impulsive decisions at poor trade locations, I follow a simple but effective rule: exercise caution when initiating trades outside of these yellow levels.
This means I’m cautious about chasing longs above the Final Upside Target (FUT) and shorts below the Final Downside Target (FDT). It’s important to understand that not chasing does not imply initiating a trade in the opposite direction — discipline over impulse.
Be sure to review the ES Weekly Plan | August 25-29, 2025 for a broader perspective, key levels, and market expectations for the week ahead.
Contextual Analysis & Plan
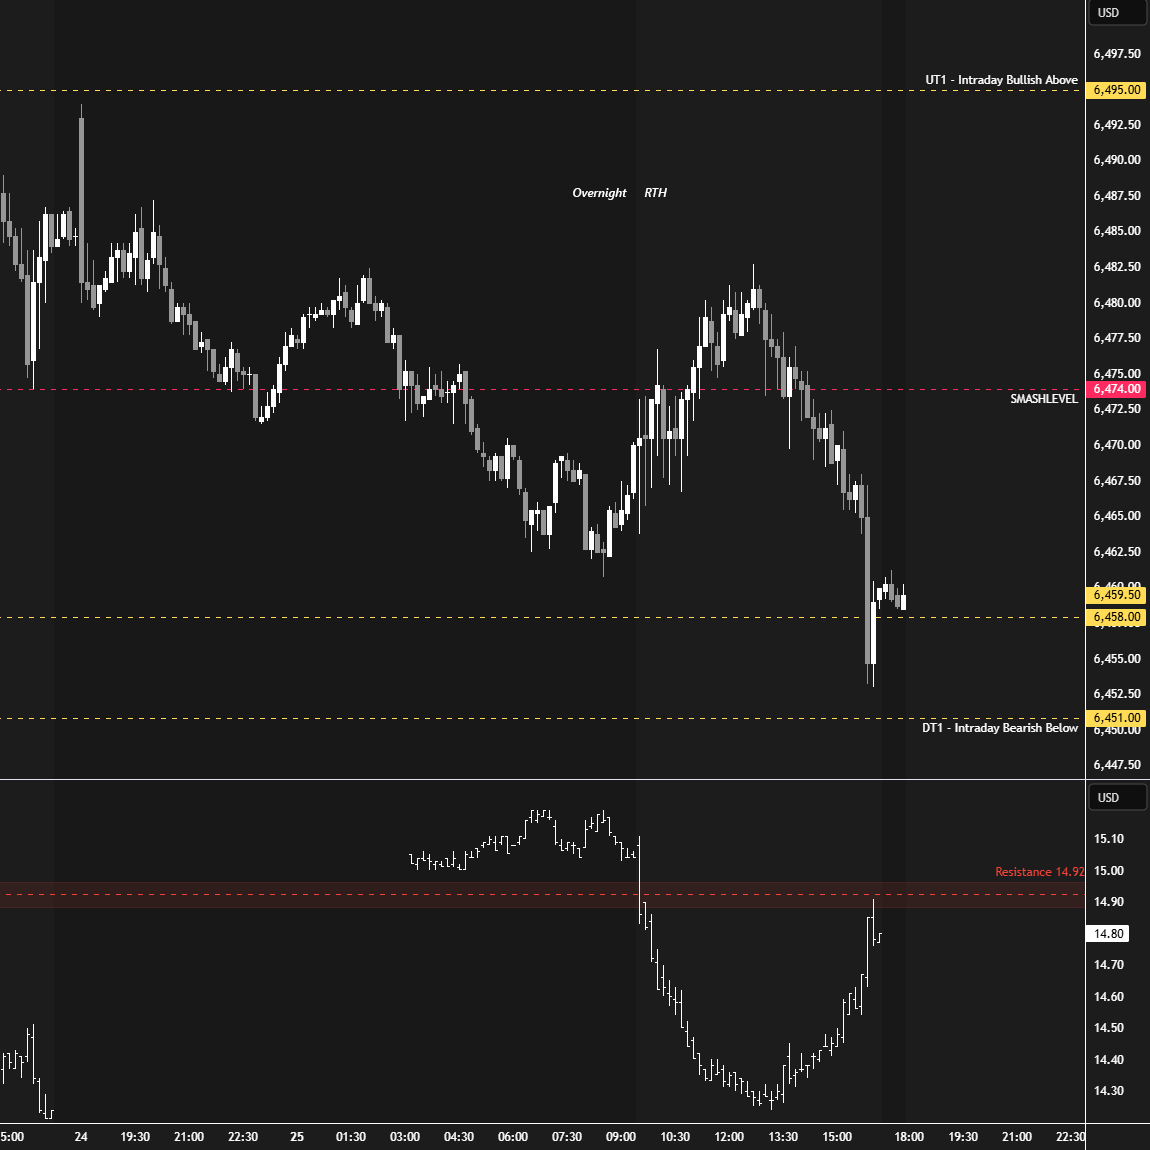
Keeping it brief due to the uneventful nature of today’s session, which was very similar to how last Monday unfolded. The overnight session came within a few ticks of tagging UT1 at 6495 on the opening spike higher, where sellers stepped in. The Smashlevel at 6474 initially provided a bounce; however, it was later breached during the European session as the market started to fill Friday’s notably large set of single prints from the B-period.
The RTH session opened below Friday’s upper distribution, and for the first three periods, buyers struggled to reclaim the 6474 level while the market showed little interest in continuing to fill Friday’s structure. During the D-period, buyers were finally able to gain traction above 6474, but they were ultimately not able to hold above it during the pullback in the afternoon session, resulting in weakness. The morning gains were quickly retraced, and the closing session formed a downward spike—a key area to monitor in the short-term.
Today’s session was characterized by morning strength, followed by afternoon weakness that retraced the gains and ended with a closing flush. Friday’s single prints were partially filled, nearly tagging Friday’s halfback in the process. Take a look at the delta profile for the session, showing notable negative delta, particularly in the M-period. The key in the short term will be to monitor buyers’ ability to reclaim the spike base at 6464, which would signal strength. Failure to do so would continue to target fills of Friday’s singles toward 6428. Acceptance within Friday’s lower distribution, however, would be a sign of weakness.
In terms of levels, the Smashlevel is at 6464—the IB low and M-period spike base. Holding below 6464 would target Friday’s halfback at 6451 (DT1). Acceptance below 6451 would signal weakness, targeting Friday’s breakout single prints at 6428, with a final downside target (FDT) at 6408 under sustained selling pressure.
On the flip side, reclaiming and holding above 6464 would target 6480 (UT1). Acceptance above 6480 would signal strength, targeting 6495 (UT2), with a final upside target (FUT) at 6508.75 under sustained buying pressure.
Levels of Interest
Going into tomorrow’s session, I’ll closely observe the behavior around 6464.
Break and hold above 6464 would target 6480 / 6495 / 6508
Holding below 6464 would target 6451 / 6428 / 6408
Additionally, pay attention to the following VIX levels: 15.54 and 14.04. These levels can provide confirmation of strength or weakness.
Break and hold above 6508 with VIX below 14.04 would confirm strength.
Break and hold below 6408 with VIX above 15.54 would confirm weakness.
Overall, it's important to exercise caution when trading outside of the highlighted yellow levels. A non-cooperative VIX may suggest possible reversals i.e trade setups.


Thanks for sharing
Thank as always!