
ES Daily Plan | August 19, 2025
Market Context & Key Levels for the Day Ahead

— For new subscribers
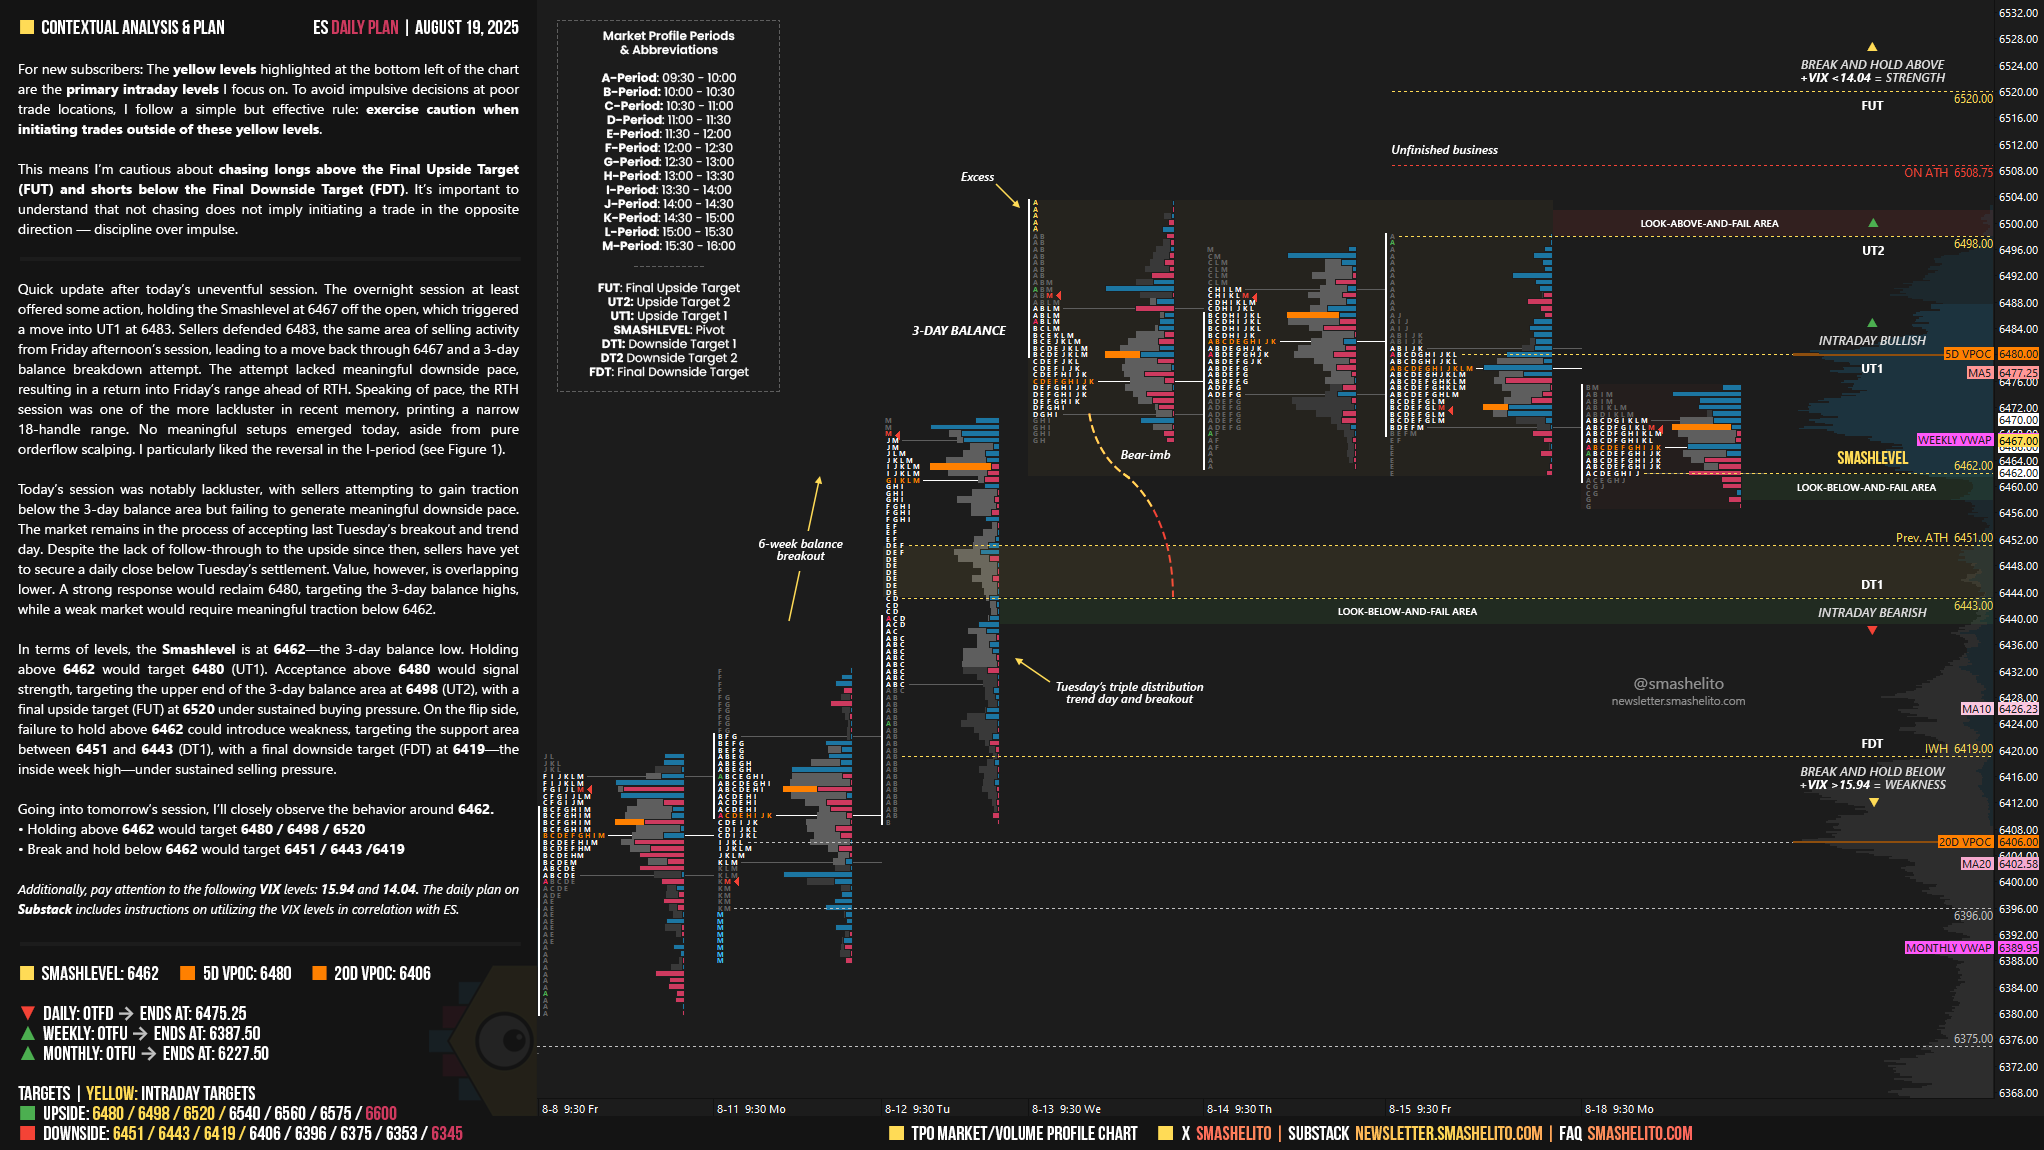
The yellow levels highlighted at the bottom left of the chart are the primary intraday levels I focus on. To avoid impulsive decisions at poor trade locations, I follow a simple but effective rule: exercise caution when initiating trades outside of these yellow levels.
This means I’m cautious about chasing longs above the Final Upside Target (FUT) and shorts below the Final Downside Target (FDT). It’s important to understand that not chasing does not imply initiating a trade in the opposite direction — discipline over impulse.
Be sure to review the ES Weekly Plan | August 18-22, 2025 for a broader perspective, key levels, and market expectations for the week ahead.
Contextual Analysis & Plan
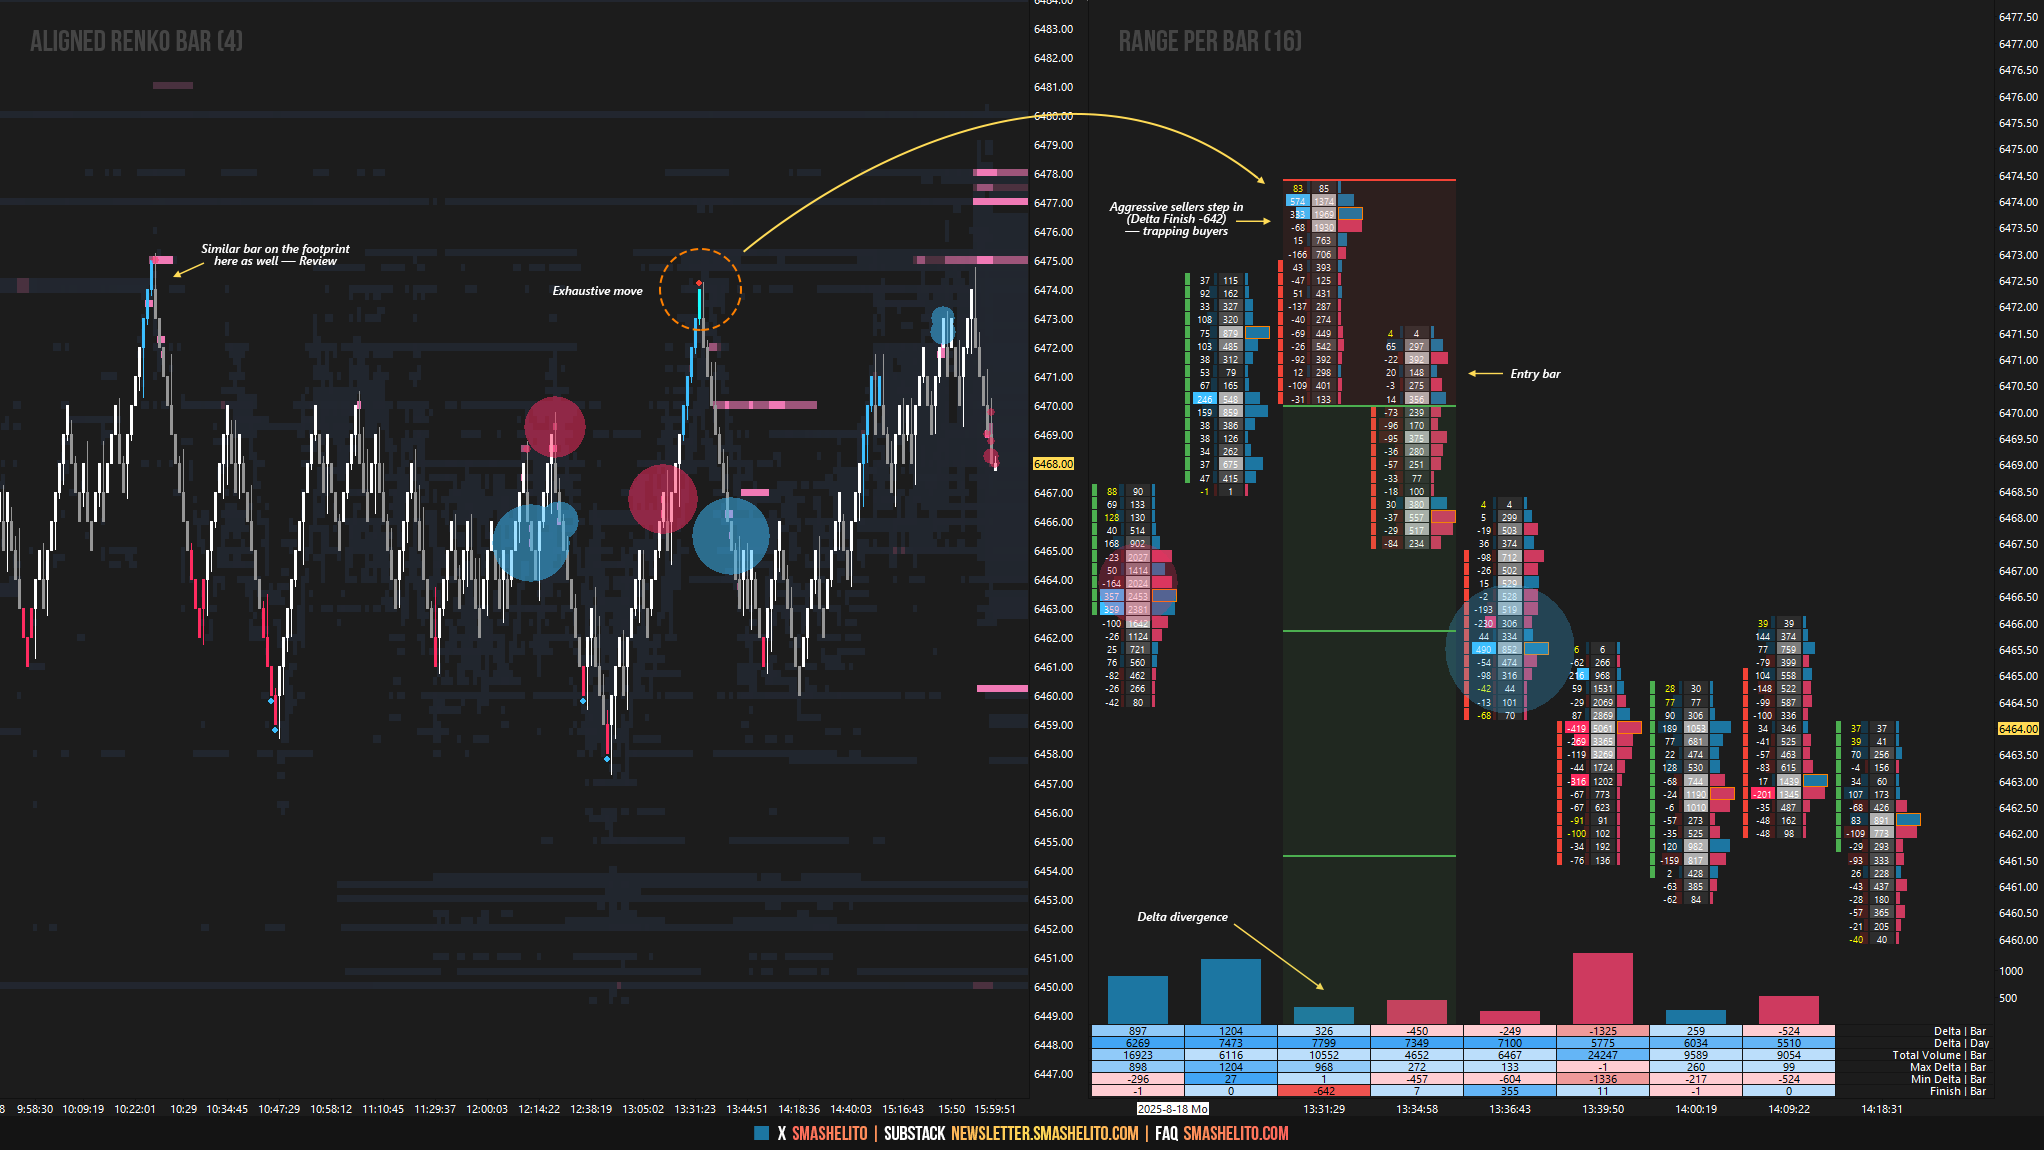
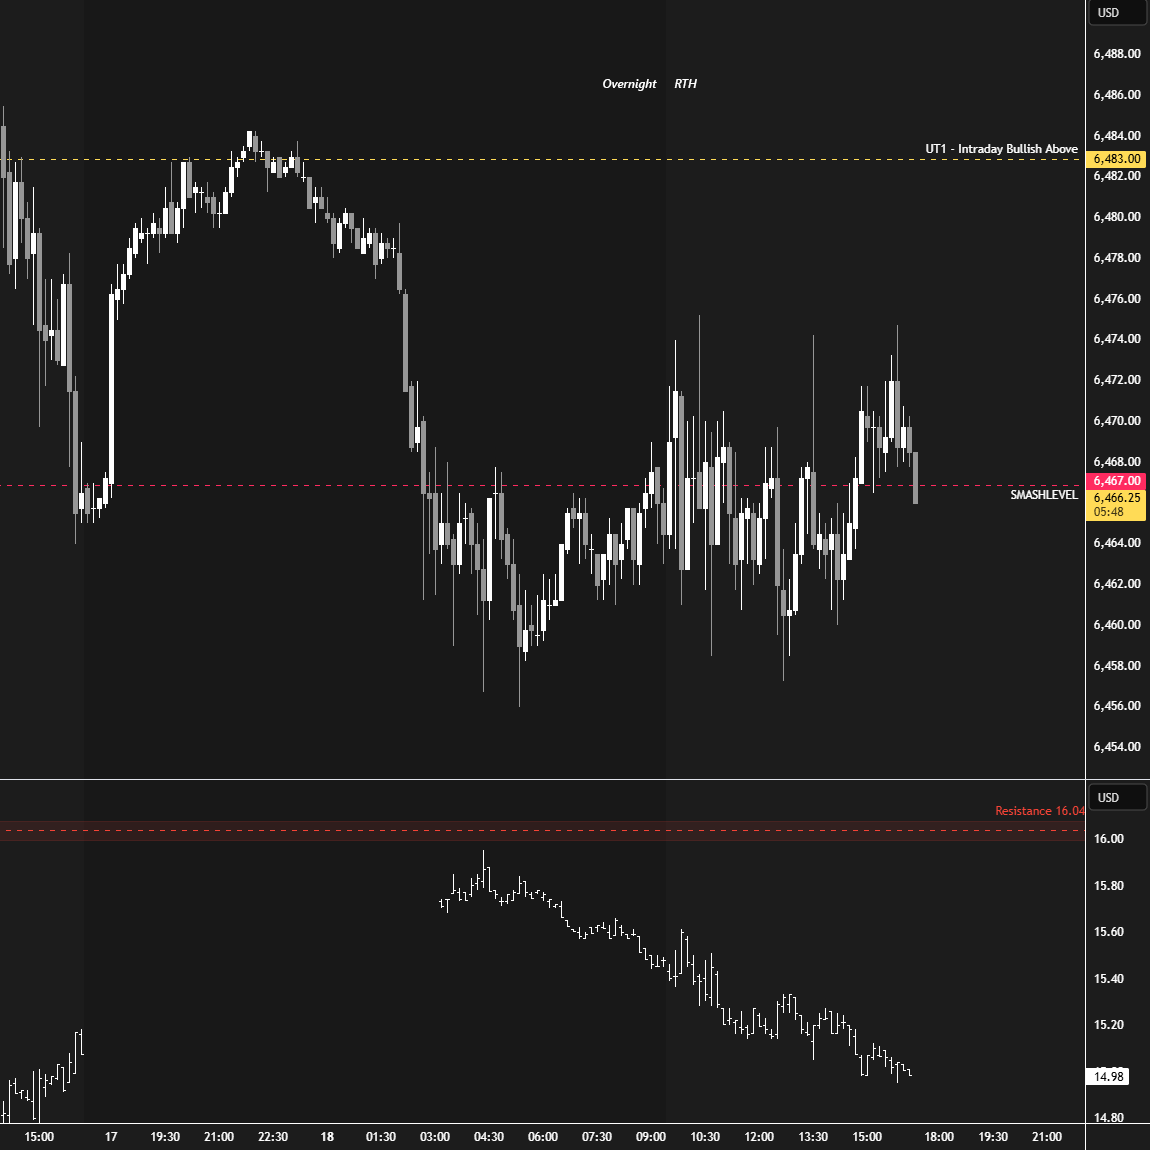
Quick update after today’s uneventful session. The overnight session at least offered some action, holding the Smashlevel at 6467 off the open, which triggered a move into UT1 at 6483. Sellers defended 6483, the same area of selling activity from Friday afternoon’s session, leading to a move back through 6467 and a 3-day balance breakdown attempt. The attempt lacked meaningful downside pace, resulting in a return into Friday’s range ahead of RTH. Speaking of pace, the RTH session was one of the more lackluster in recent memory, printing a narrow 18-handle range. No meaningful setups emerged today, aside from pure orderflow scalping. I particularly liked the reversal in the I-period (see Figure 1).
Today’s session was notably lackluster, with sellers attempting to gain traction below the 3-day balance area but failing to generate meaningful downside pace. The market remains in the process of accepting last Tuesday’s breakout and trend day. Despite the lack of follow-through to the upside since then, sellers have yet to secure a daily close below Tuesday’s settlement. Value, however, is overlapping lower. A strong response would reclaim 6480, targeting the 3-day balance highs, while a weak market would require meaningful traction below 6462.
In terms of levels, the Smashlevel is at 6462—the 3-day balance low. Holding above 6462 would target 6480 (UT1). Acceptance above 6480 would signal strength, targeting the upper end of the 3-day balance area at 6498 (UT2), with a final upside target (FUT) at 6520 under sustained buying pressure.
On the flip side, failure to hold above 6462 could introduce weakness, targeting the support area between 6451 and 6443 (DT1), with a final downside target (FDT) at 6419—the inside week high—under sustained selling pressure.
Levels of Interest
Going into tomorrow’s session, I’ll closely observe the behavior around 6462.
Holding above 6462 would target 6480 / 6498 / 6520
Break and hold below 6462 would target 6451 / 6443 / 6419
Additionally, pay attention to the following VIX levels: 15.94 and 14.04. These levels can provide confirmation of strength or weakness.
Break and hold above 6520 with VIX below 14.04 would confirm strength.
Break and hold below 6419 with VIX above 15.94 would confirm weakness.
Overall, it's important to exercise caution when trading outside of the highlighted yellow levels. A non-cooperative VIX may suggest possible reversals i.e trade setups.
Thanks Smash! Great visuals.
Thank you!