
ES Daily Plan | August 14, 2025
Market Context & Key Levels for the Day Ahead

— For new subscribers
The yellow levels highlighted at the bottom left of the chart are the primary intraday levels I focus on. To avoid impulsive decisions at poor trade locations, I follow a simple but effective rule: exercise caution when initiating trades outside of these yellow levels.
This means I’m cautious about chasing longs above the Final Upside Target (FUT) and shorts below the Final Downside Target (FDT). It’s important to understand that not chasing does not imply initiating a trade in the opposite direction — discipline over impulse.
Be sure to review the ES Weekly Plan | August 11-15, 2025 for a broader perspective, key levels, and market expectations for the week ahead.
Contextual Analysis & Plan
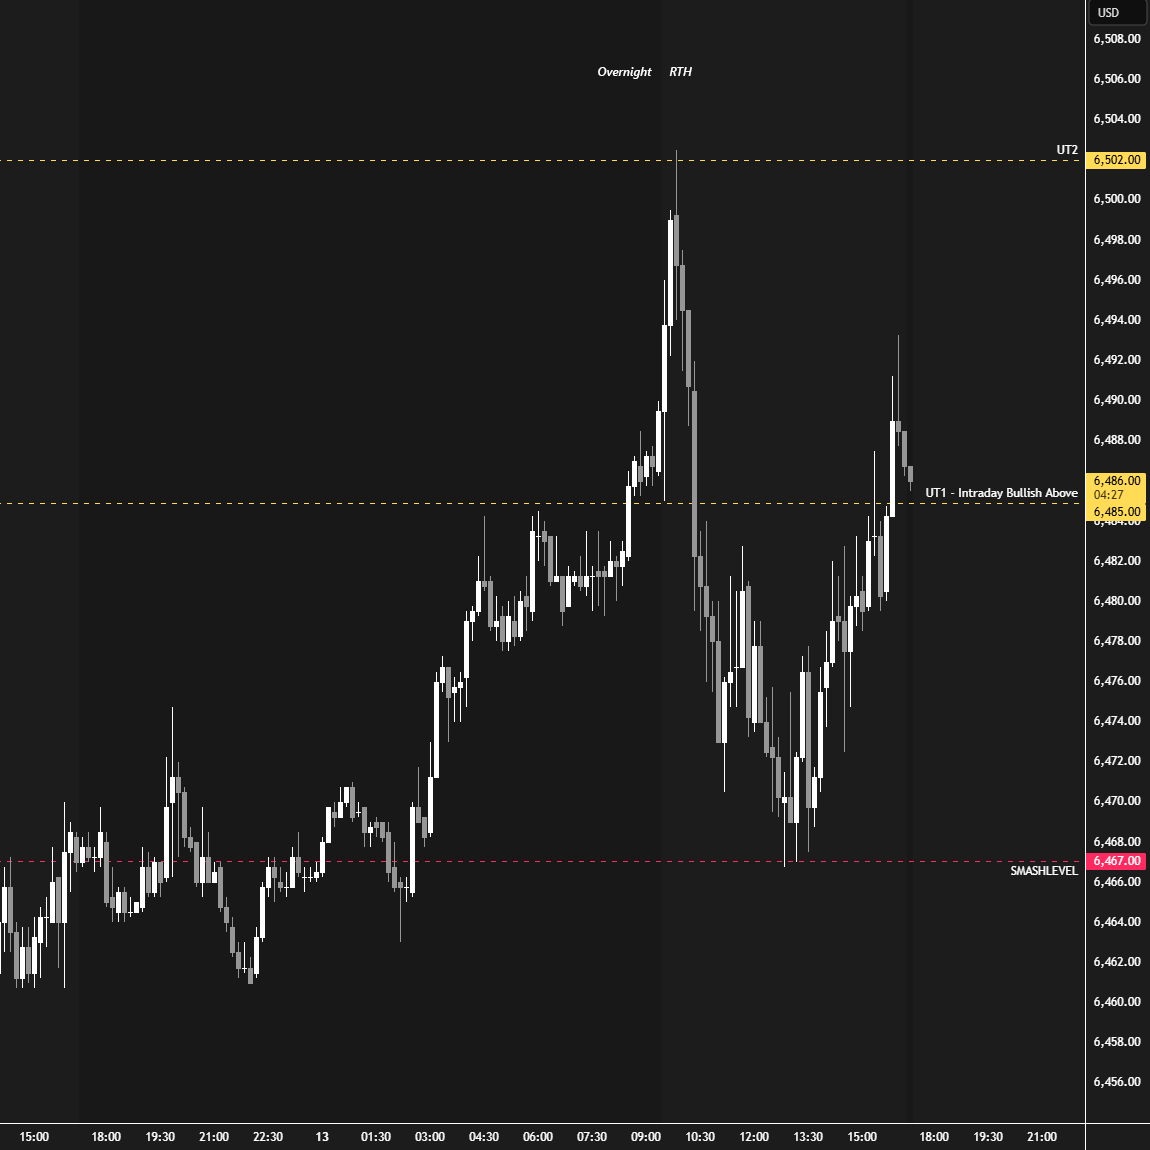
The overnight session was quiet during Asian hours, consolidating near the upper end of Tuesday’s range. Change took place when the European markets opened, as an upside continuation unfolded. Keep in mind that Tuesday’s session broke from balance, creating the potential for a directional continuation today. In such an imbalance phase, aligning with the prevailing trend is key. The initial upside target at 6485 was tagged pre-open, with the market balancing briefly before pushing higher ahead of the RTH session.
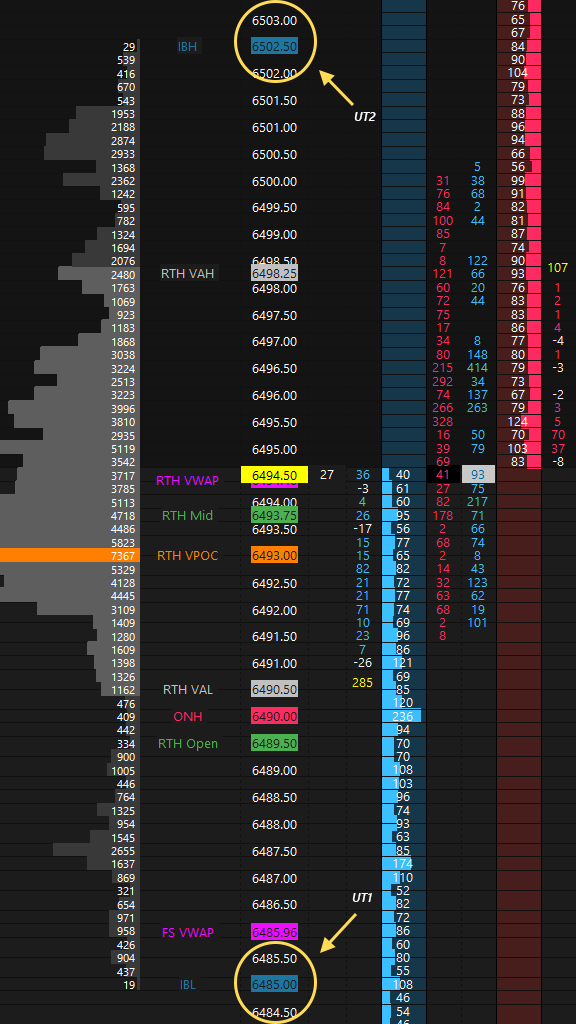
The RTH session opened with a true gap up, meaning it opened completely outside of the prior day’s range. The UT1 at 6485 held at the open, triggering a move into UT2 at 6502, which capped today’s upside momentum (HOD: 6502.50) (see Figure 1). As often discussed, the opening level and the overnight high are two crucial references when gapping higher—both of which buyers initially controlled. The rejection of 6502 was followed by notable aggressive selling in the B-period (-7461 delta), as sellers pushed the auction back below the opening level and overnight high, negating the early strength. At this point, the potential for an inventory correction emerged—unless buyers managed to quickly reclaim those references. As always, an inventory correction isn’t bearish unless acceptance is established back within the prior day’s range. It’s important not to mistake this weakness for stronger sellers, especially in an environment where the market is one-time framing up across all time frames.
The gap was filled in the G-period, testing the Smashlevel at 6467, where a notable poor low formed (LOD: 6466.75). Generally, if a true gap up gets filled but sellers are unable to gain meaningful traction within the prior day’s range—causing value to overlap with the previous session—the potential for a closing rally increases, fueled by sellers entering at poor locations. Buyers managed to reclaim the initial balance low into the closing session, which saw significant activity during the morning session.
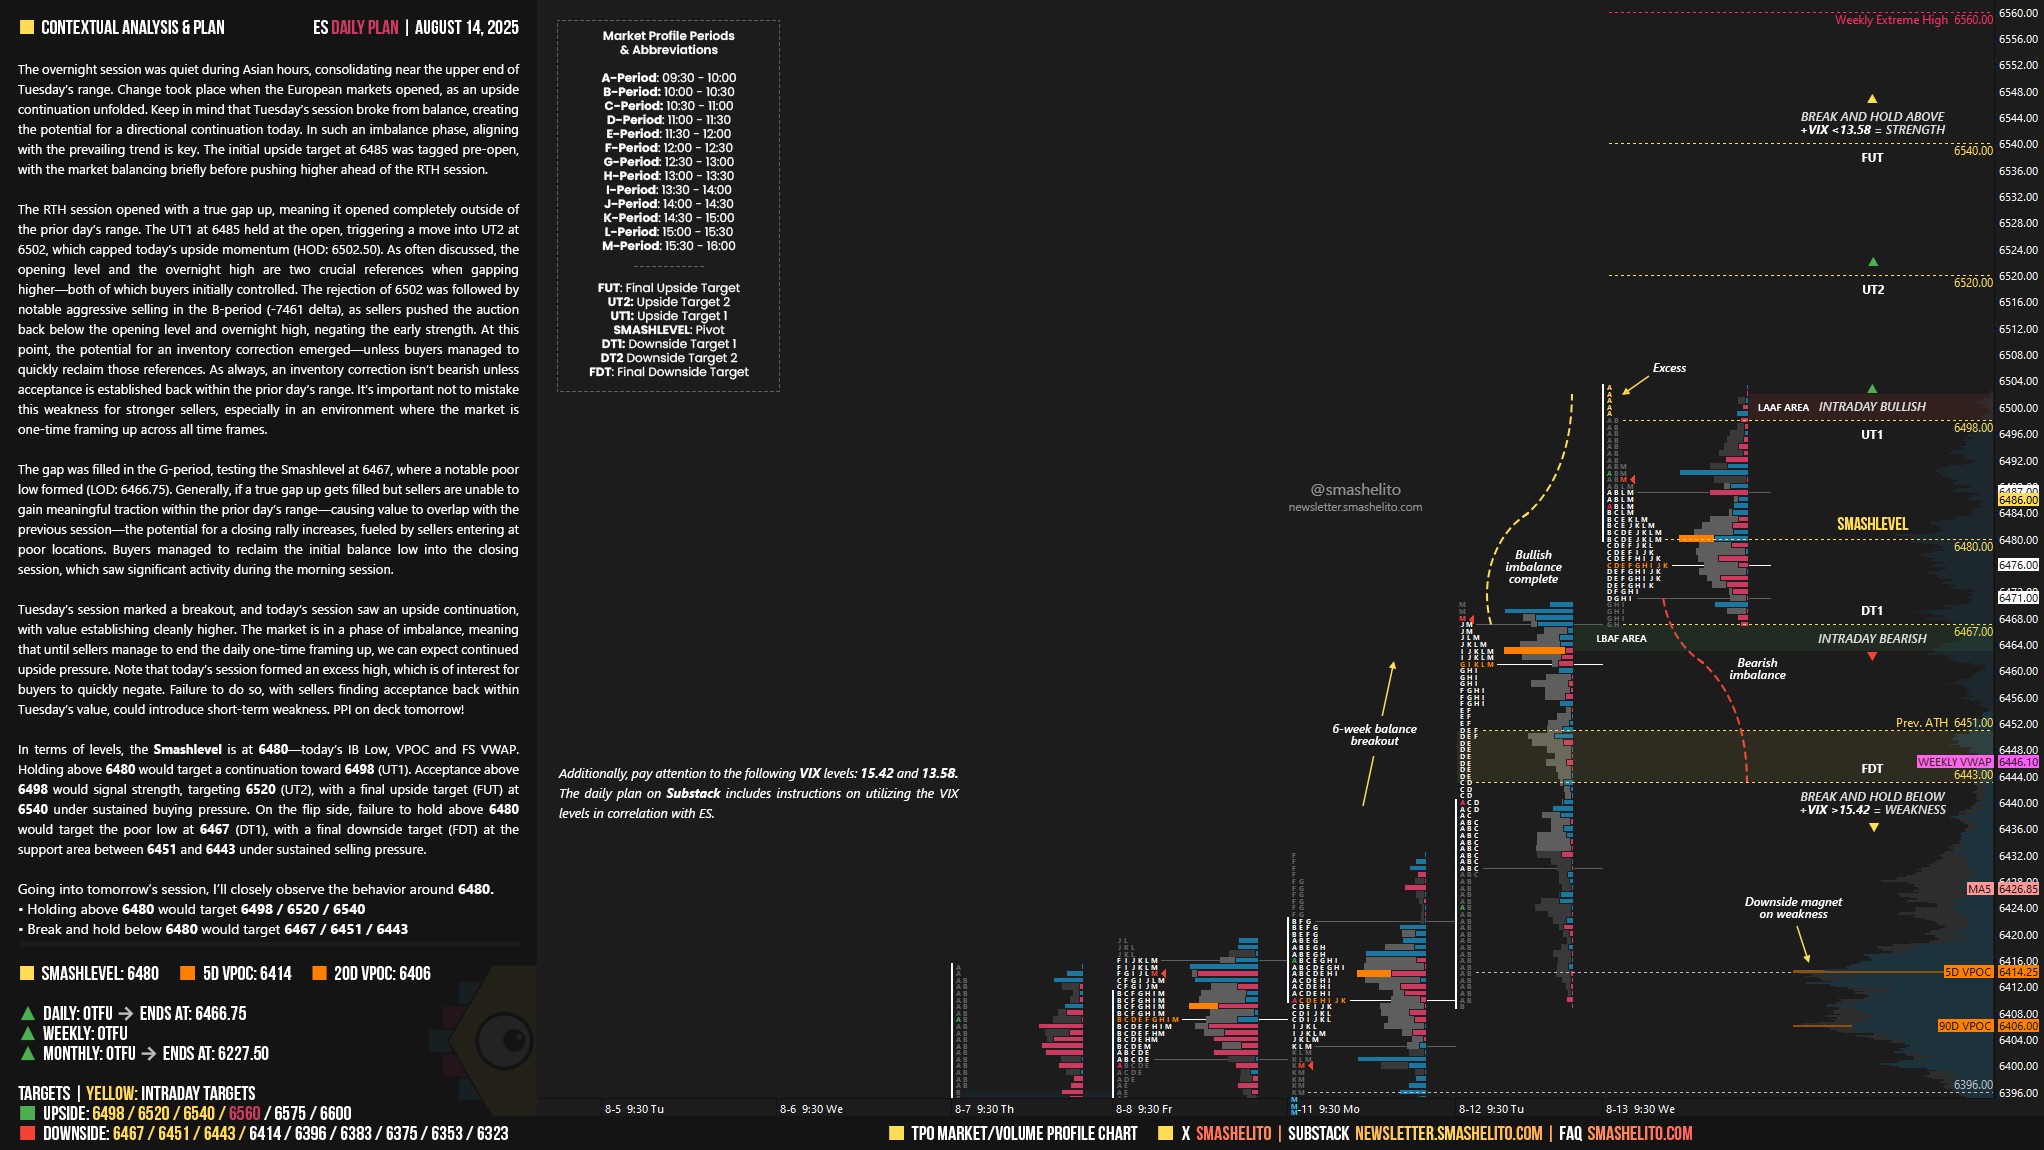
Tuesday’s session marked a breakout, and today’s session saw an upside continuation, with value establishing cleanly higher. The market is in a phase of imbalance, meaning that until sellers manage to end the daily one-time framing up, we can expect continued upside pressure. Note that today’s session formed an excess high, which is of interest for buyers to quickly negate. Failure to do so, with sellers finding acceptance back within Tuesday’s value, could introduce short-term weakness. PPI on deck tomorrow!
In terms of levels, the Smashlevel is at 6480—today’s IB Low, VPOC and FS VWAP. Holding above 6480 would target a continuation toward 6498 (UT1). Acceptance above 6498 would signal strength, targeting 6520 (UT2), with a final upside target (FUT) at 6540 under sustained buying pressure.
On the flip side, failure to hold above 6480 would target the poor low at 6467 (DT1), with a final downside target (FDT) at the support area between 6451 and 6443 under sustained selling pressure.
Levels of Interest
Going into tomorrow’s session, I’ll closely observe the behavior around 6480.
Holding above 6480 would target 6498 / 6520 / 6540
Break and hold below 6480 would target 6467 / 6451 / 6443
Additionally, pay attention to the following VIX levels: 15.42 and 13.58. These levels can provide confirmation of strength or weakness.
Break and hold above 6540 with VIX below 13.58 would confirm strength.
Break and hold below 6443 with VIX above 15.42 would confirm weakness.
Overall, it's important to exercise caution when trading outside of the highlighted yellow levels. A non-cooperative VIX may suggest possible reversals i.e trade setups.
Thank you!
Thanks Smash! Levels scary accurate as always.