
ES Daily Plan | August 13, 2025
Market Context & Key Levels for the Day Ahead

— For new subscribers
The yellow levels highlighted at the bottom left of the chart are the primary intraday levels I focus on. To avoid impulsive decisions at poor trade locations, I follow a simple but effective rule: exercise caution when initiating trades outside of these yellow levels.
This means I’m cautious about chasing longs above the Final Upside Target (FUT) and shorts below the Final Downside Target (FDT). It’s important to understand that not chasing does not imply initiating a trade in the opposite direction — discipline over impulse.
Be sure to review the ES Weekly Plan | August 11-15, 2025 for a broader perspective, key levels, and market expectations for the week ahead.
Contextual Analysis & Plan
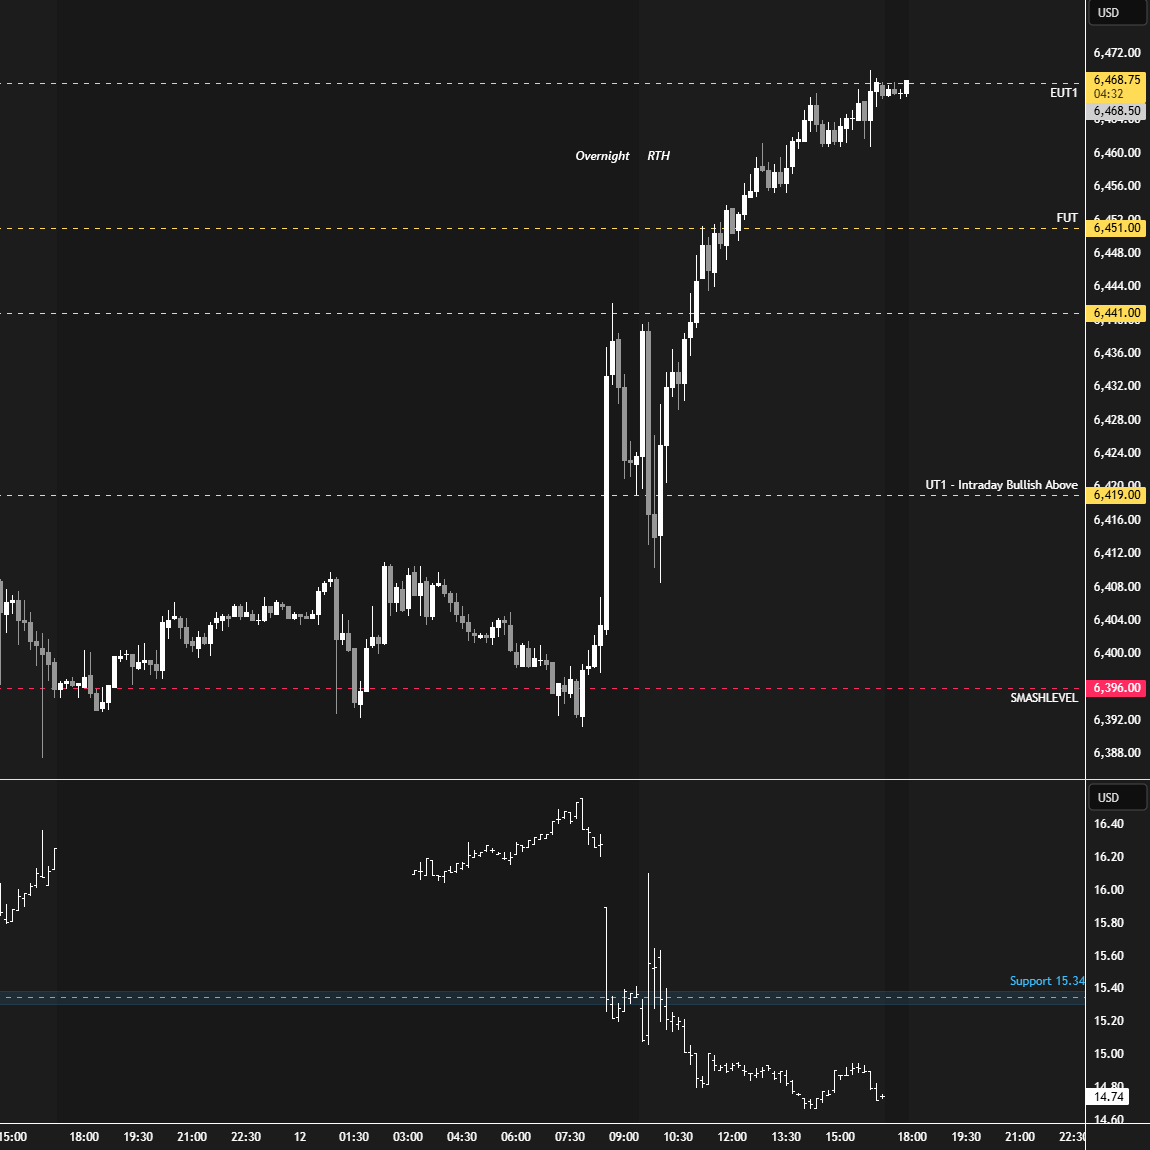
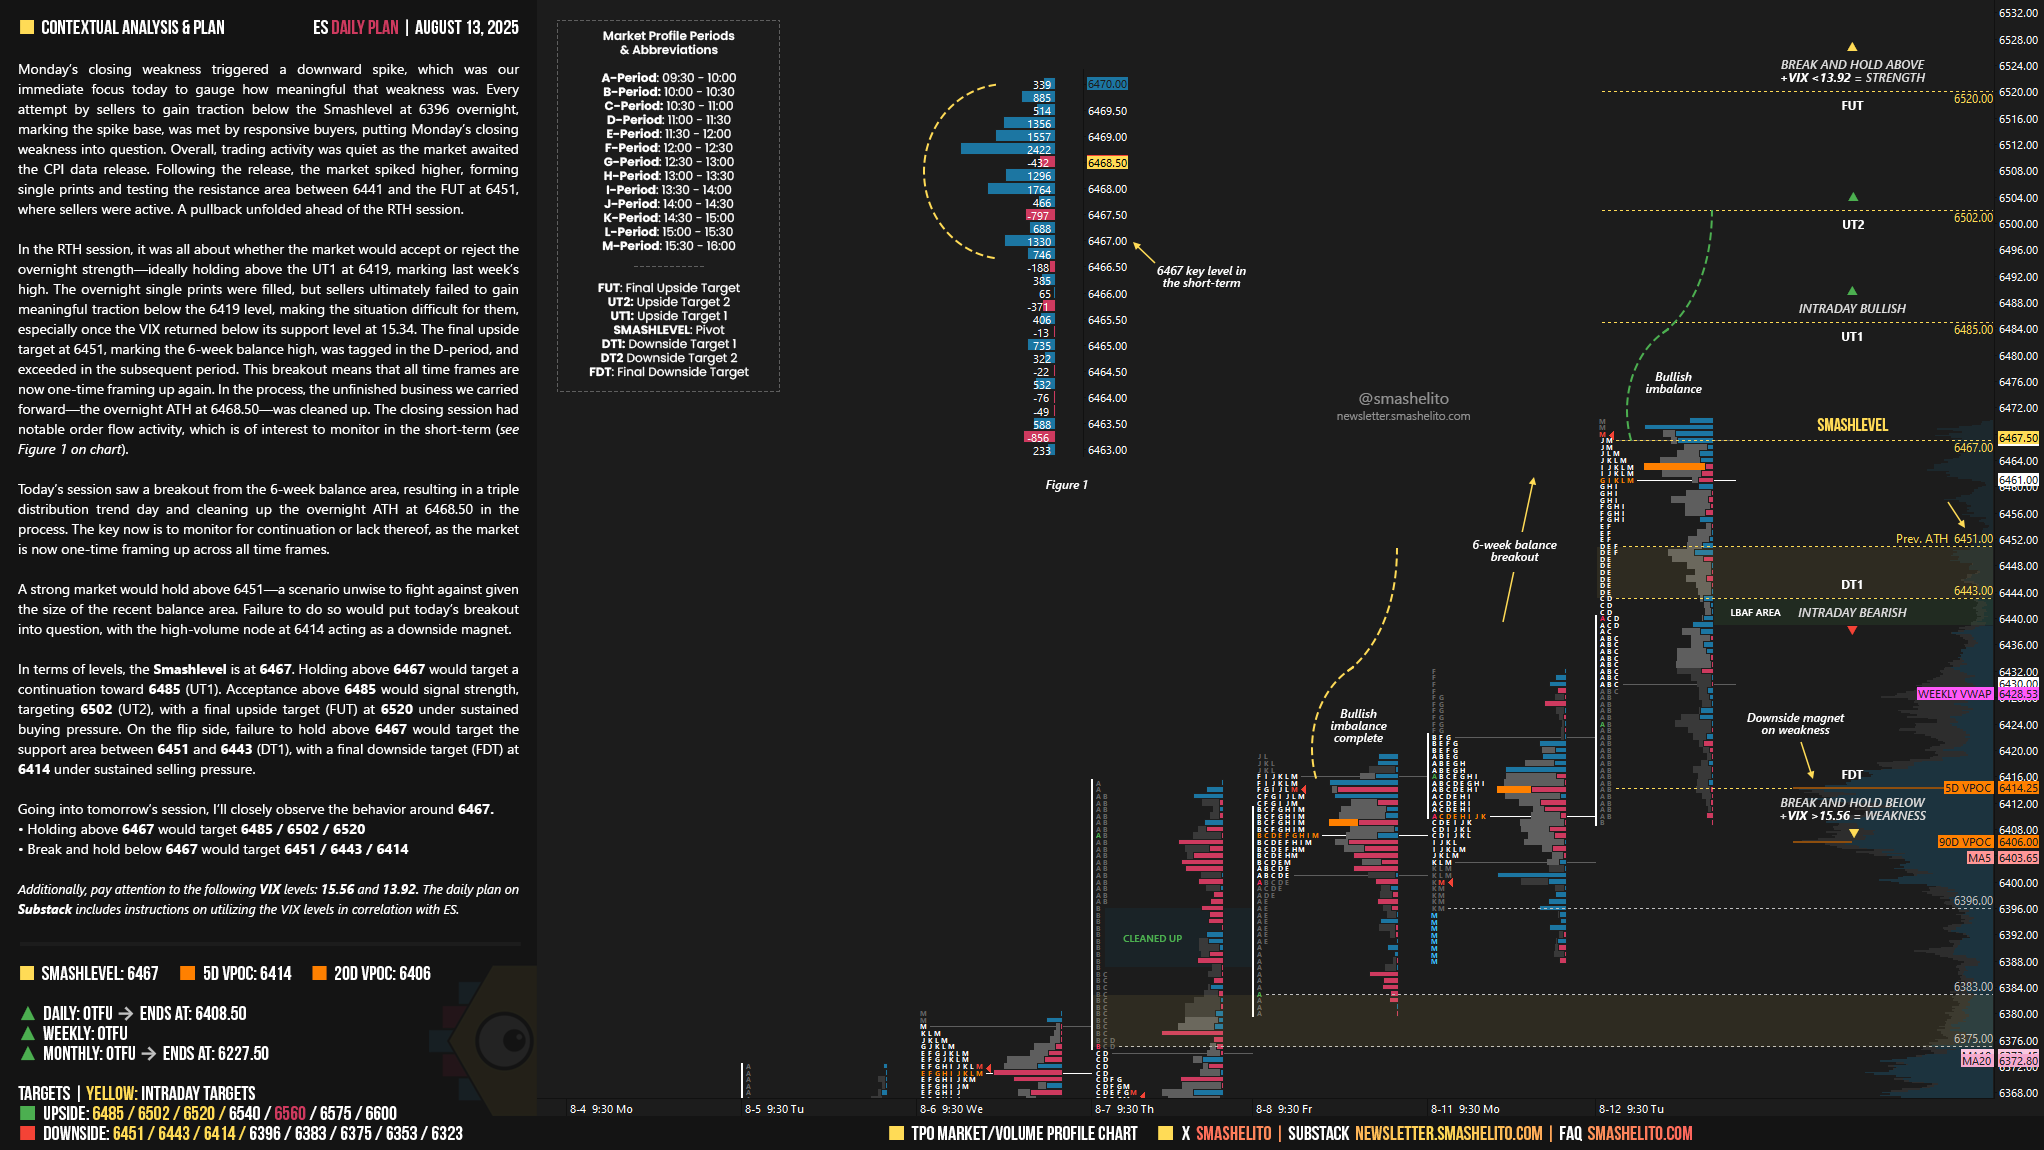
Monday’s closing weakness triggered a downward spike, which was our immediate focus today to gauge how meaningful that weakness was. Every attempt by sellers to gain traction below the Smashlevel at 6396 overnight, marking the spike base, was met by responsive buyers, putting Monday’s closing weakness into question. Overall, trading activity was quiet as the market awaited the CPI data release. Following the release, the market spiked higher, forming single prints and testing the resistance area between 6441 and the FUT at 6451, where sellers were active. A pullback unfolded ahead of the RTH session.
In the RTH session, it was all about whether the market would accept or reject the overnight strength—ideally holding above the UT1 at 6419, marking last week’s high. The overnight single prints were filled, but sellers ultimately failed to gain meaningful traction below the 6419 level, making the situation difficult for them, especially once the VIX returned below its support level at 15.34. The final upside target at 6451, marking the 6-week balance high, was tagged in the D-period, and exceeded in the subsequent period. This breakout means that all time frames are now one-time framing up again. In the process, the unfinished business we carried forward—the overnight ATH at 6468.50—was cleaned up. The closing session had notable order flow activity, which is of interest to monitor in the short-term (see Figure 1 on chart).
Today’s session saw a breakout from the 6-week balance area, resulting in a triple distribution trend day and cleaning up the overnight ATH at 6468.50 in the process. The key now is to monitor for continuation or lack thereof, as the market is now one-time framing up across all time frames.
A strong market would hold above 6451—a scenario unwise to fight against given the size of the recent balance area. Failure to do so would put today’s breakout into question, with the high-volume node at 6414 acting as a downside magnet.
In terms of levels, the Smashlevel is at 6467. Holding above 6467 would target a continuation toward 6485 (UT1). Acceptance above 6485 would signal strength, targeting 6502 (UT2), with a final upside target (FUT) at 6520 under sustained buying pressure.
On the flip side, failure to hold above 6467 would target the support area between 6451 and 6443 (DT1), with a final downside target (FDT) at 6414 under sustained selling pressure.
Levels of Interest
Going into tomorrow’s session, I’ll closely observe the behavior around 6467.
Holding above 6467 would target 6485 / 6502 / 6520
Break and hold below 6467 would target 6451 / 6443 / 6414
Additionally, pay attention to the following VIX levels: 15.56 and 13.92. These levels can provide confirmation of strength or weakness.
Break and hold above 6520 with VIX below 13.92 would confirm strength.
Break and hold below 6414 with VIX above 15.56 would confirm weakness.
Overall, it's important to exercise caution when trading outside of the highlighted yellow levels. A non-cooperative VIX may suggest possible reversals i.e trade setups.
Thank you!
Thank you Smash!