
ES Daily Plan | August 11, 2025
Market Context & Key Levels for the Day Ahead

— For new subscribers
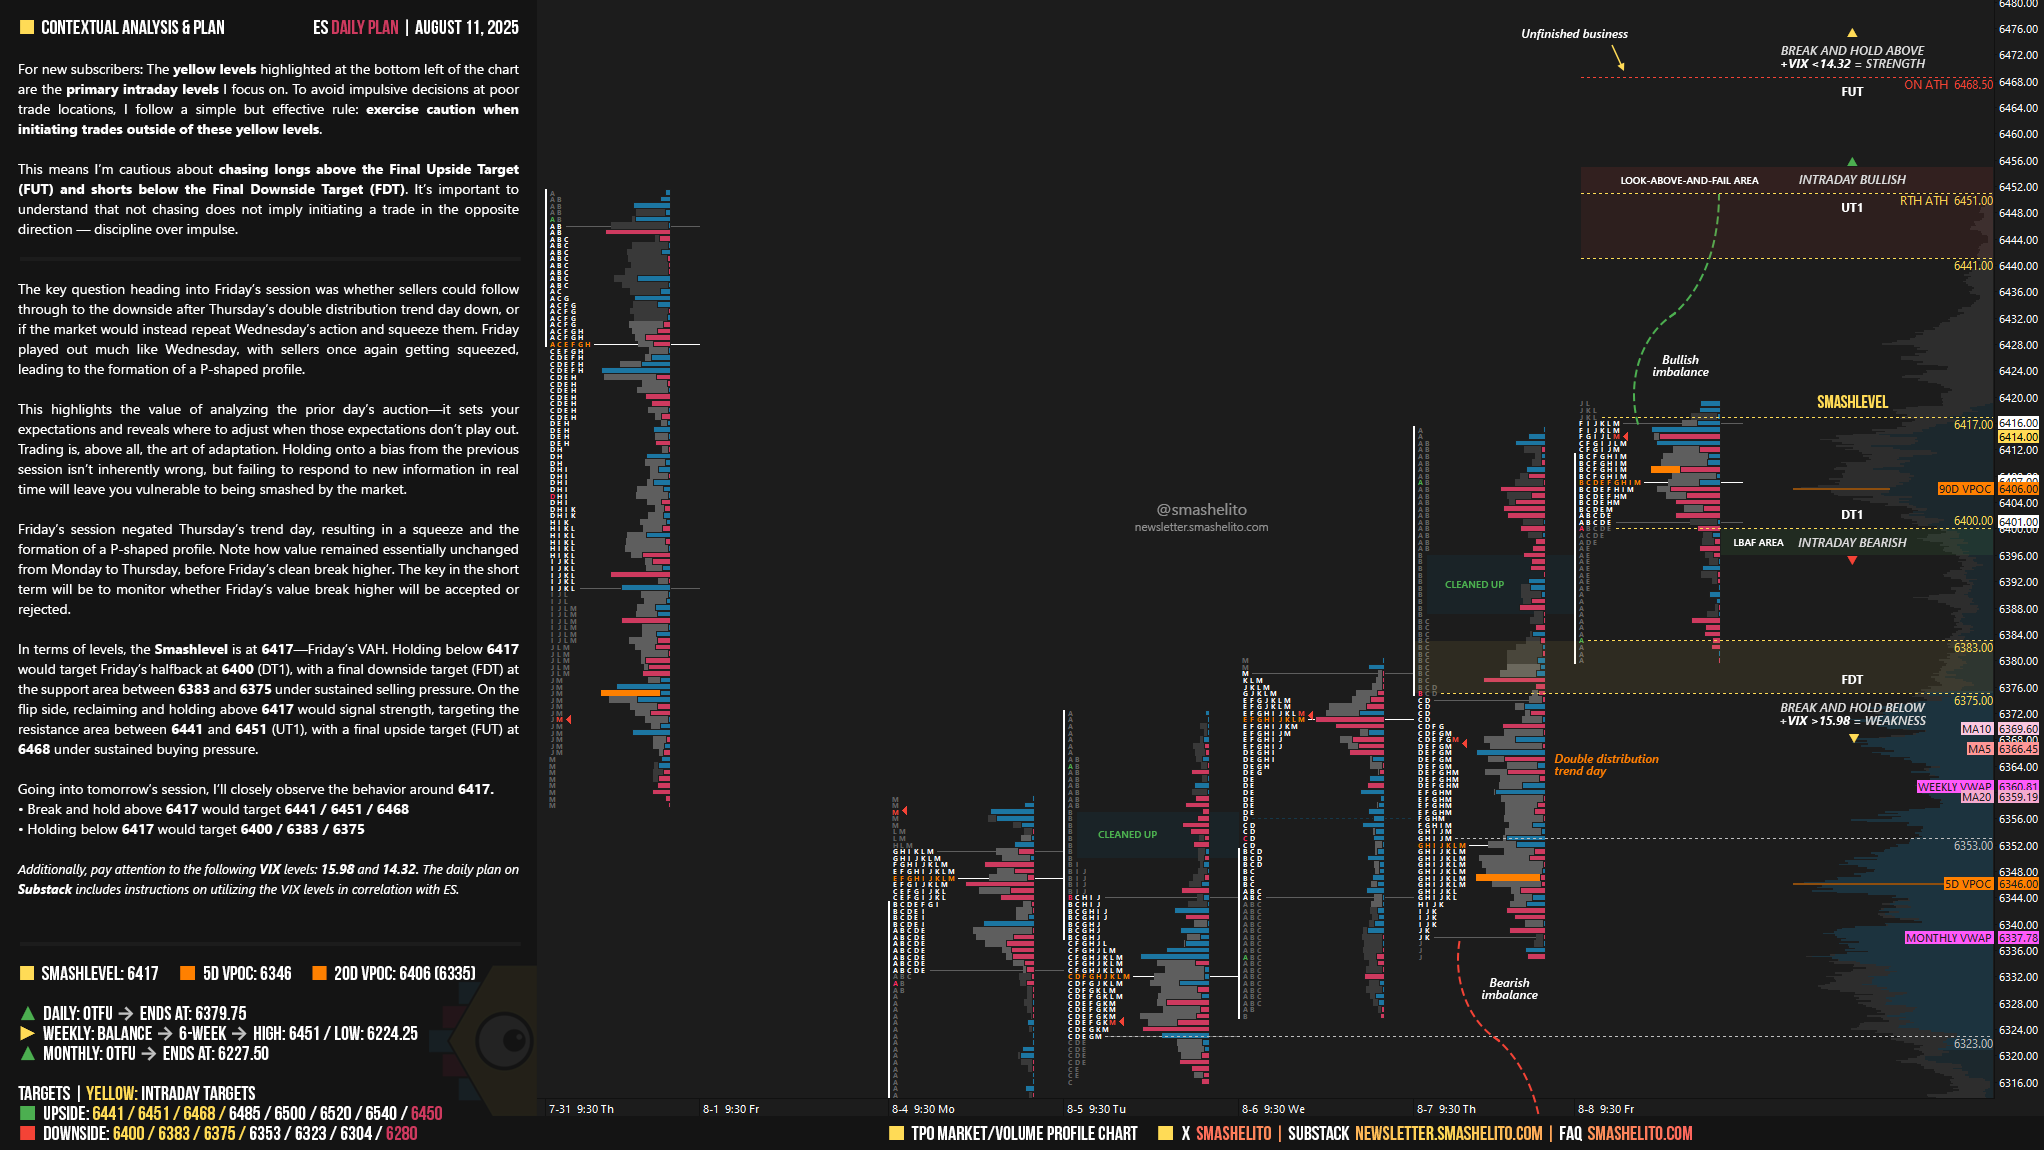
The yellow levels highlighted at the bottom left of the chart are the primary intraday levels I focus on. To avoid impulsive decisions at poor trade locations, I follow a simple but effective rule: exercise caution when initiating trades outside of these yellow levels.
This means I’m cautious about chasing longs above the Final Upside Target (FUT) and shorts below the Final Downside Target (FDT). It’s important to understand that not chasing does not imply initiating a trade in the opposite direction — discipline over impulse.
Be sure to review the ES Weekly Plan | August 11-15, 2025 for a broader perspective, key levels, and market expectations for the week ahead.
Contextual Analysis & Plan
The key question heading into Friday’s session was whether sellers could follow through to the downside after Thursday’s double distribution trend day down, or if the market would instead repeat Wednesday’s action and squeeze them. Friday played out much like Wednesday, with sellers once again getting squeezed, leading to the formation of a P-shaped profile.
This highlights the value of analyzing the prior day’s auction—it sets your expectations and reveals where to adjust when those expectations don’t play out. Trading is, above all, the art of adaptation. Holding onto a bias from the previous session isn’t inherently wrong, but failing to respond to new information in real time will leave you vulnerable to being smashed by the market.
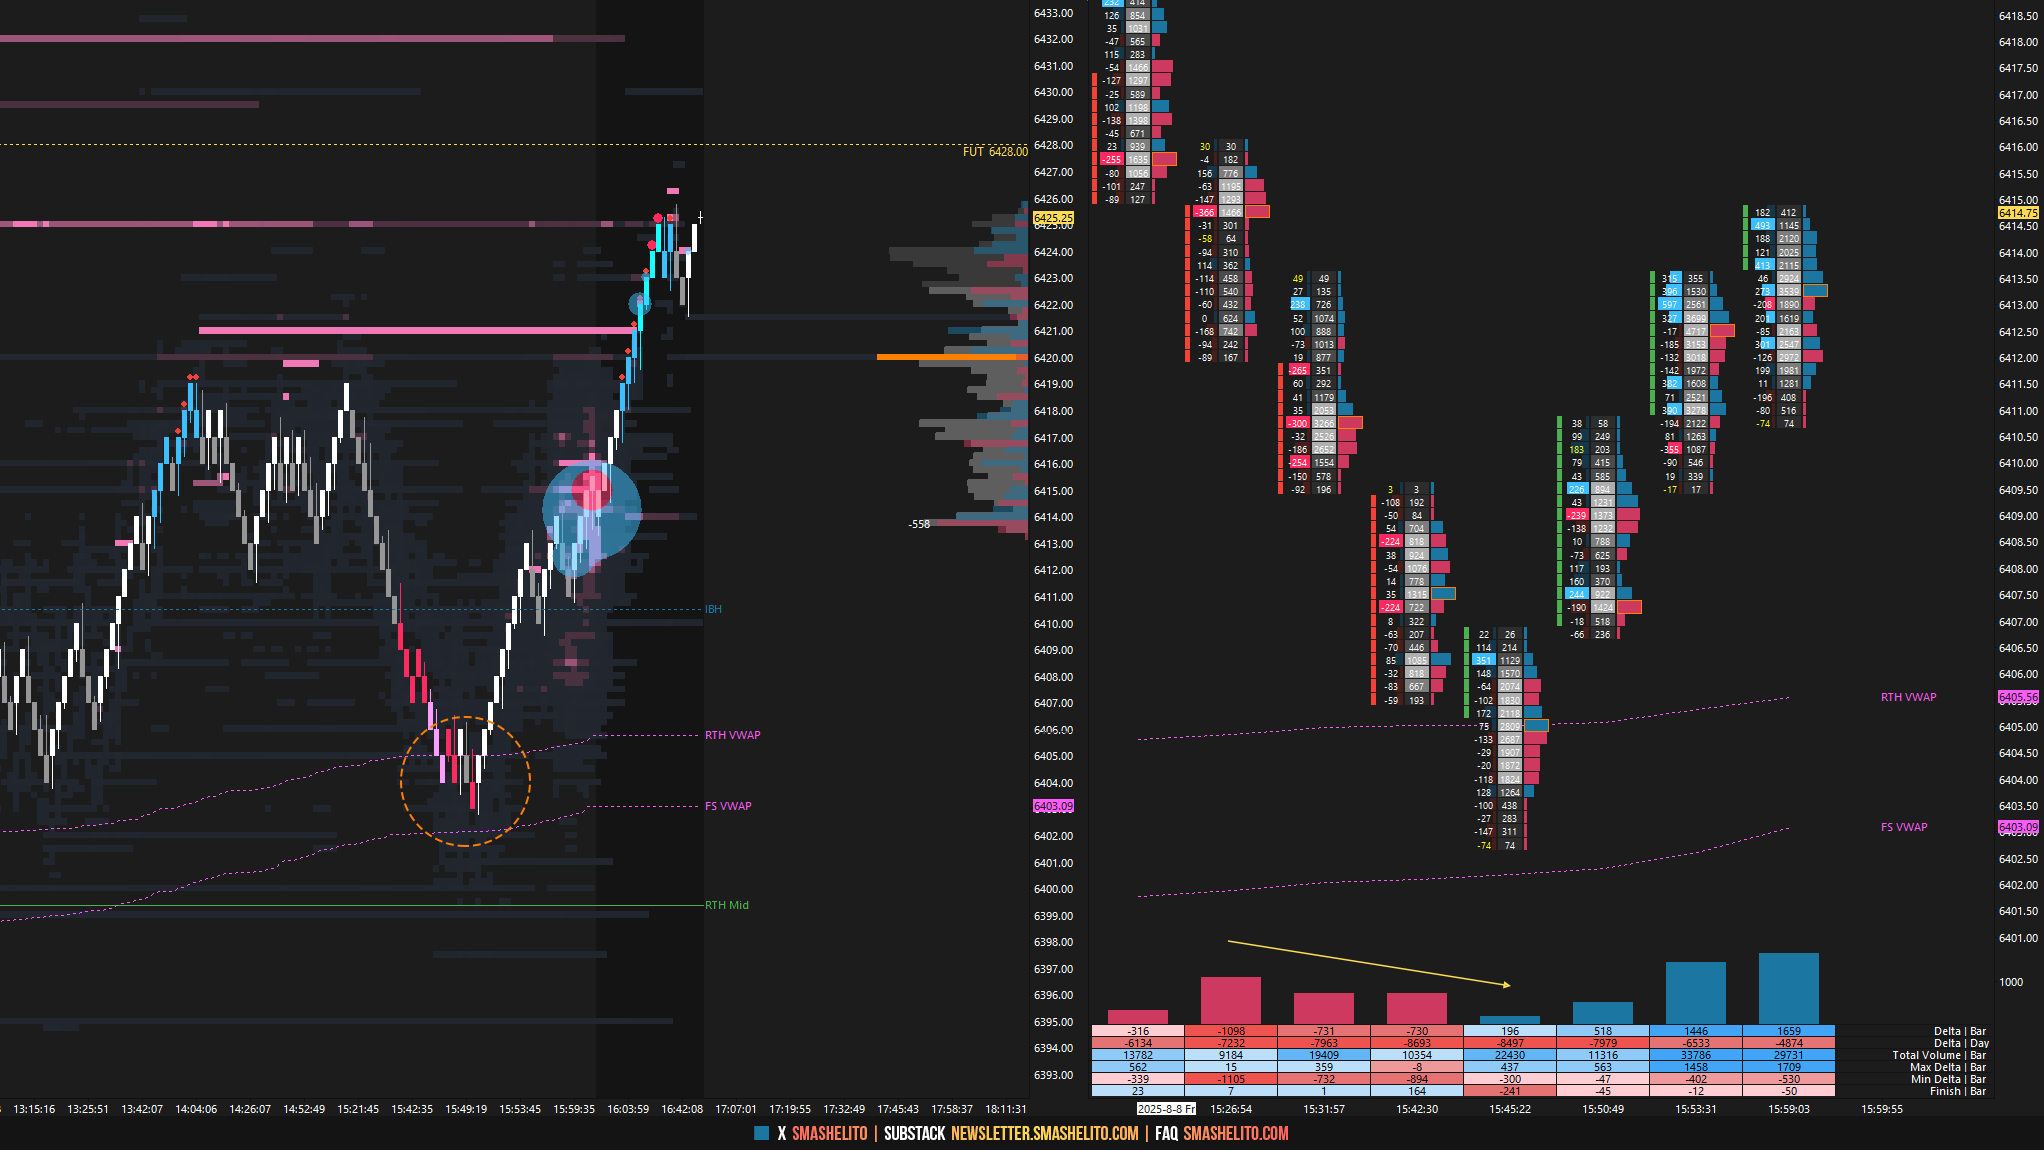
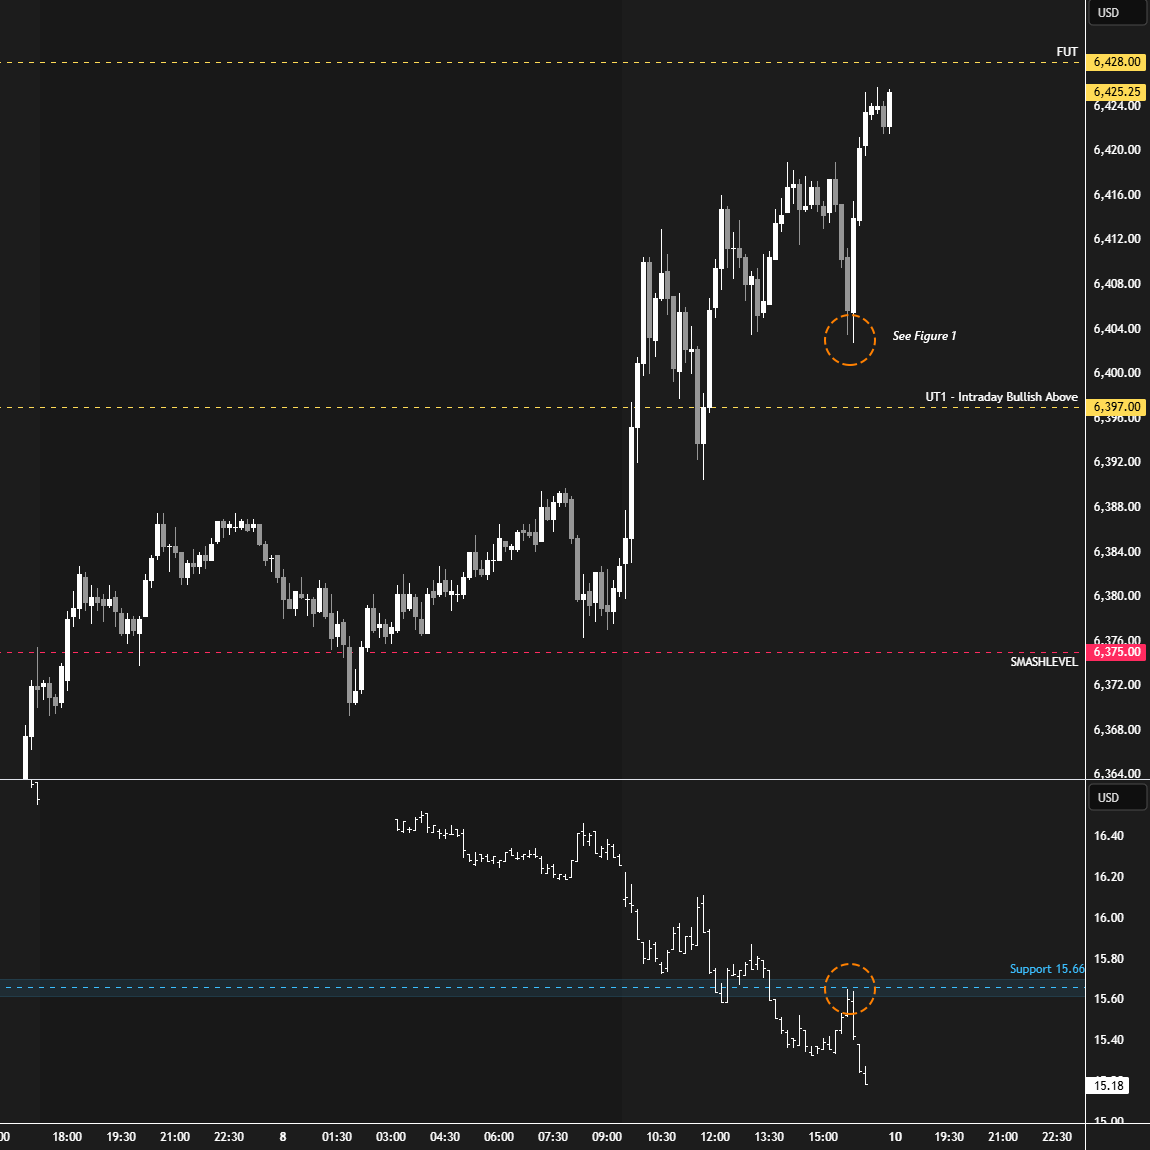
I want to highlight the closing dip that was bought on Friday, aligning perfectly with a retest of the broken support level at 15.66 for the VIX, as well as the RTH and FS VWAP (see Figure 1).
Friday’s session negated Thursday’s trend day, resulting in a squeeze and the formation of a P-shaped profile. Note how value remained essentially unchanged from Monday to Thursday, before Friday’s clean break higher. The key in the short term will be to monitor whether Friday’s value break higher will be accepted or rejected.
In terms of levels, the Smashlevel is at 6417—Friday’s VAH. Holding below 6417 would target Friday’s halfback at 6400 (DT1), with a final downside target (FDT) at the support area between 6383 and 6375 under sustained selling pressure.
On the flip side, reclaiming and holding above 6417 would signal strength, targeting the resistance area between 6441 and 6451 (UT1), with a final upside target (FUT) at 6468 under sustained buying pressure.
Levels of Interest
Going into tomorrow’s session, I’ll closely observe the behavior around 6417.
Break and hold above 6417 would target 6441 / 6451 / 6468
Holding below 6417 would target 6400 / 6383 / 6375
Additionally, pay attention to the following VIX levels: 15.98 and 14.32. These levels can provide confirmation of strength or weakness.
Break and hold above 6468 with VIX below 14.32 would confirm strength.
Break and hold below 6375 with VIX above 15.98 would confirm weakness.
Overall, it's important to exercise caution when trading outside of the highlighted yellow levels. A non-cooperative VIX may suggest possible reversals i.e trade setups.
Thank you
Thanks Smash!