
ES Daily Plan | August 1, 2025
Market Context & Key Levels for the Day Ahead

— For new subscribers
The yellow levels highlighted at the bottom left of the chart are the primary intraday levels I focus on. To avoid impulsive decisions at poor trade locations, I follow a simple but effective rule: exercise caution when initiating trades outside of these yellow levels.
This means I’m cautious about chasing longs above the Final Upside Target (FUT) and shorts below the Final Downside Target (FDT). It’s important to understand that not chasing does not imply initiating a trade in the opposite direction — discipline over impulse.
Be sure to review the ES Weekly Plan | July 28 - August 1, 2025 for a broader perspective, key levels, and market expectations for the week ahead.
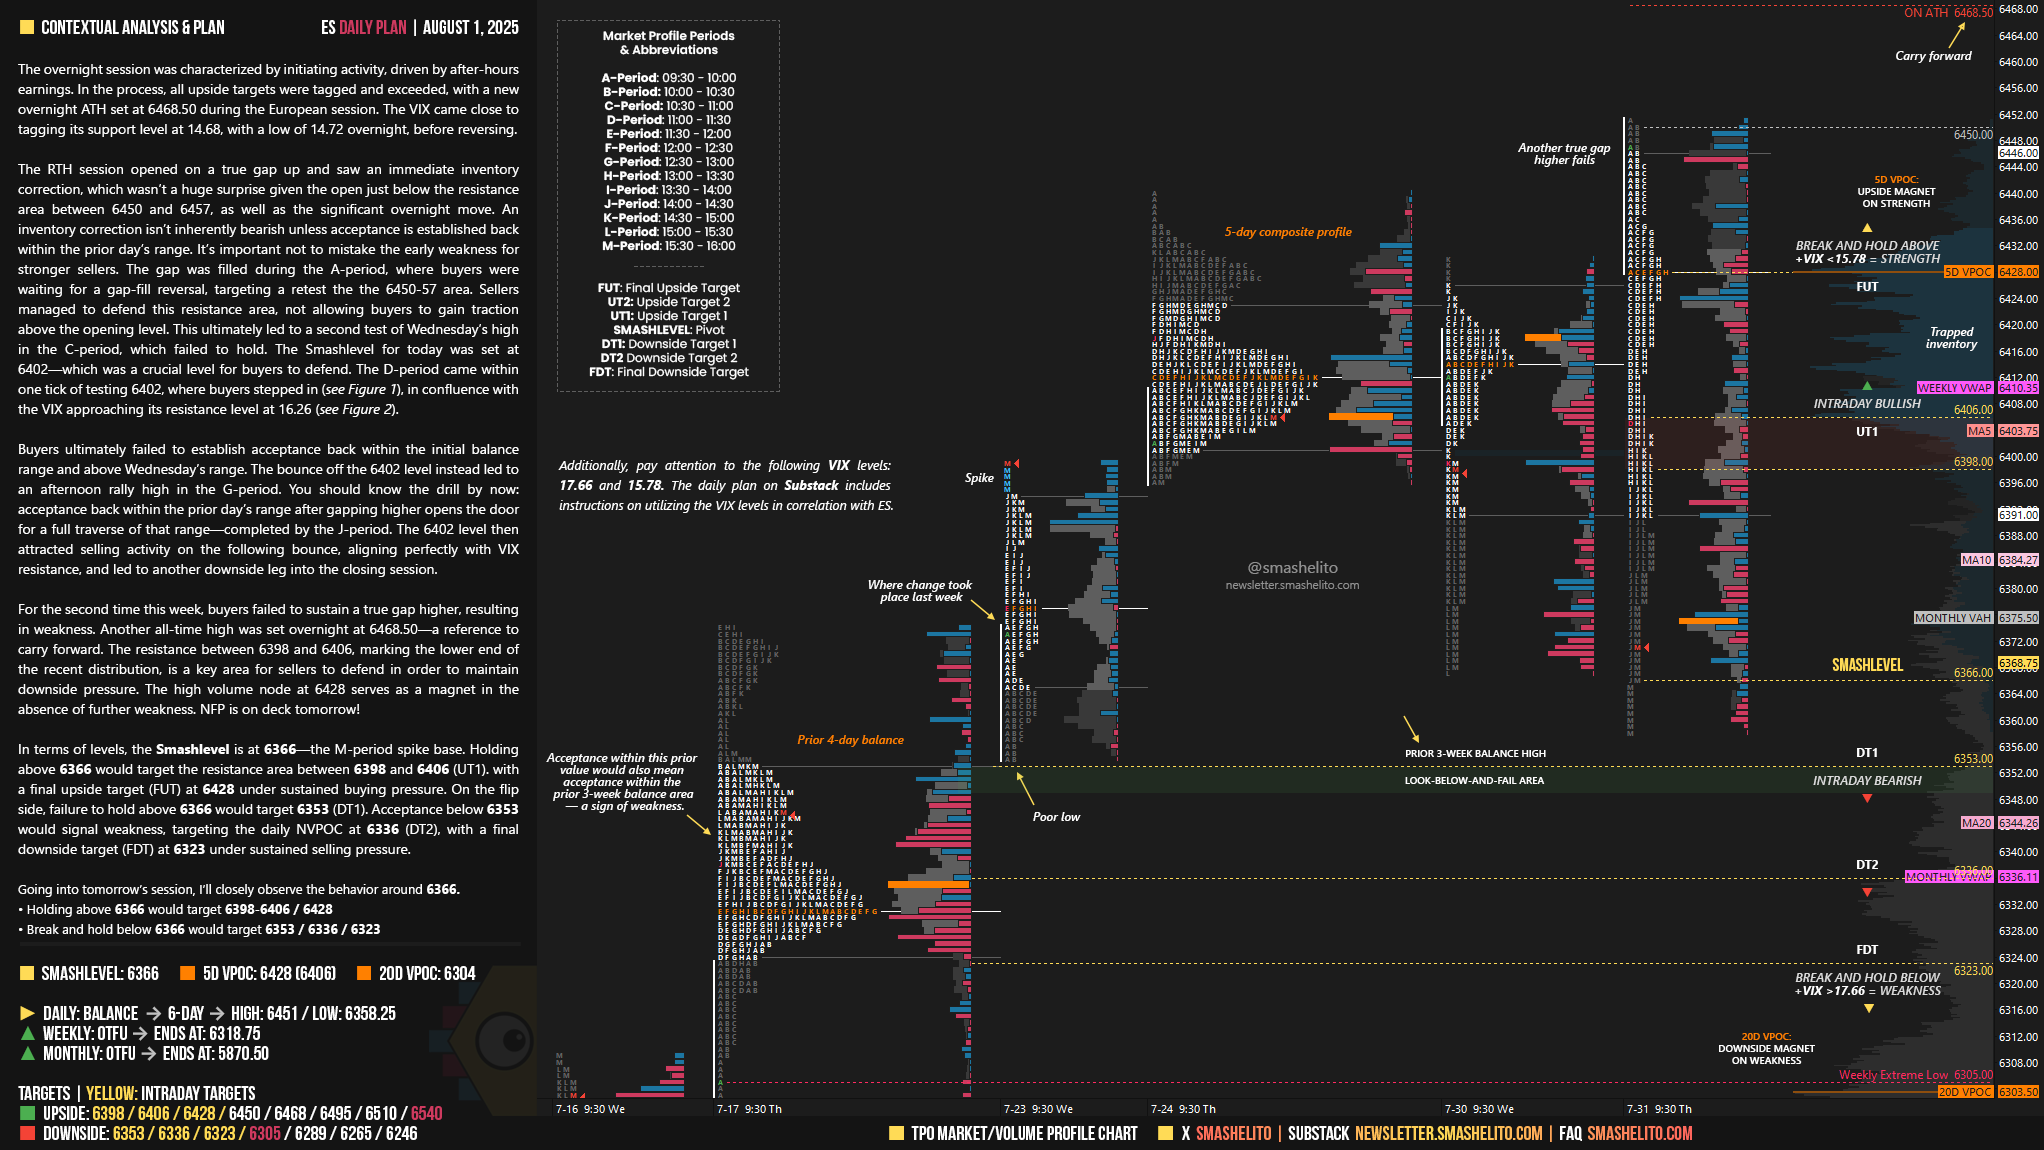
Contextual Analysis & Plan
The overnight session was characterized by initiating activity, driven by after-hours earnings. In the process, all upside targets were tagged and exceeded, with a new overnight ATH set at 6468.50 during the European session. The VIX came close to tagging its support level at 14.68, with a low of 14.72 overnight, before reversing.
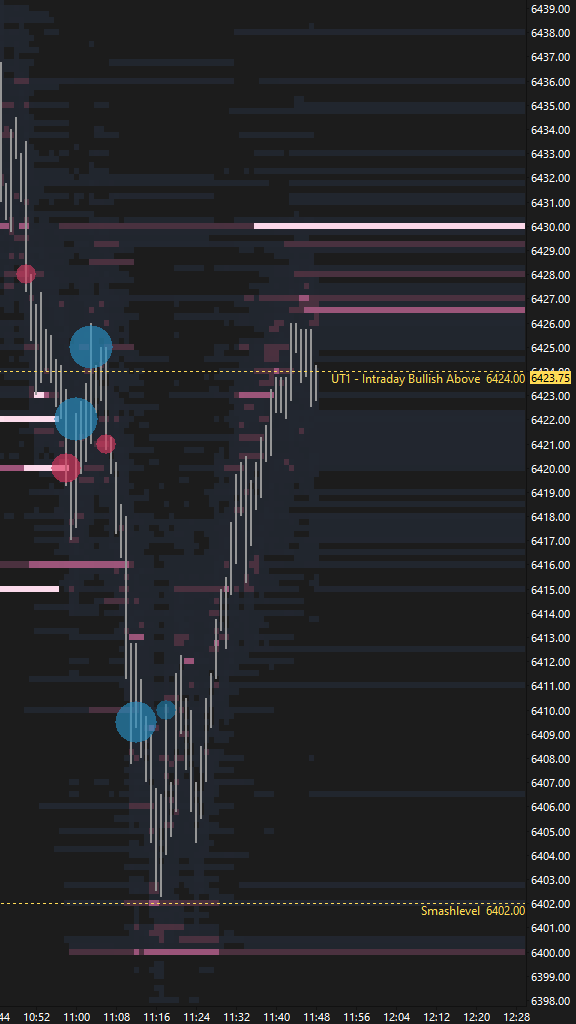
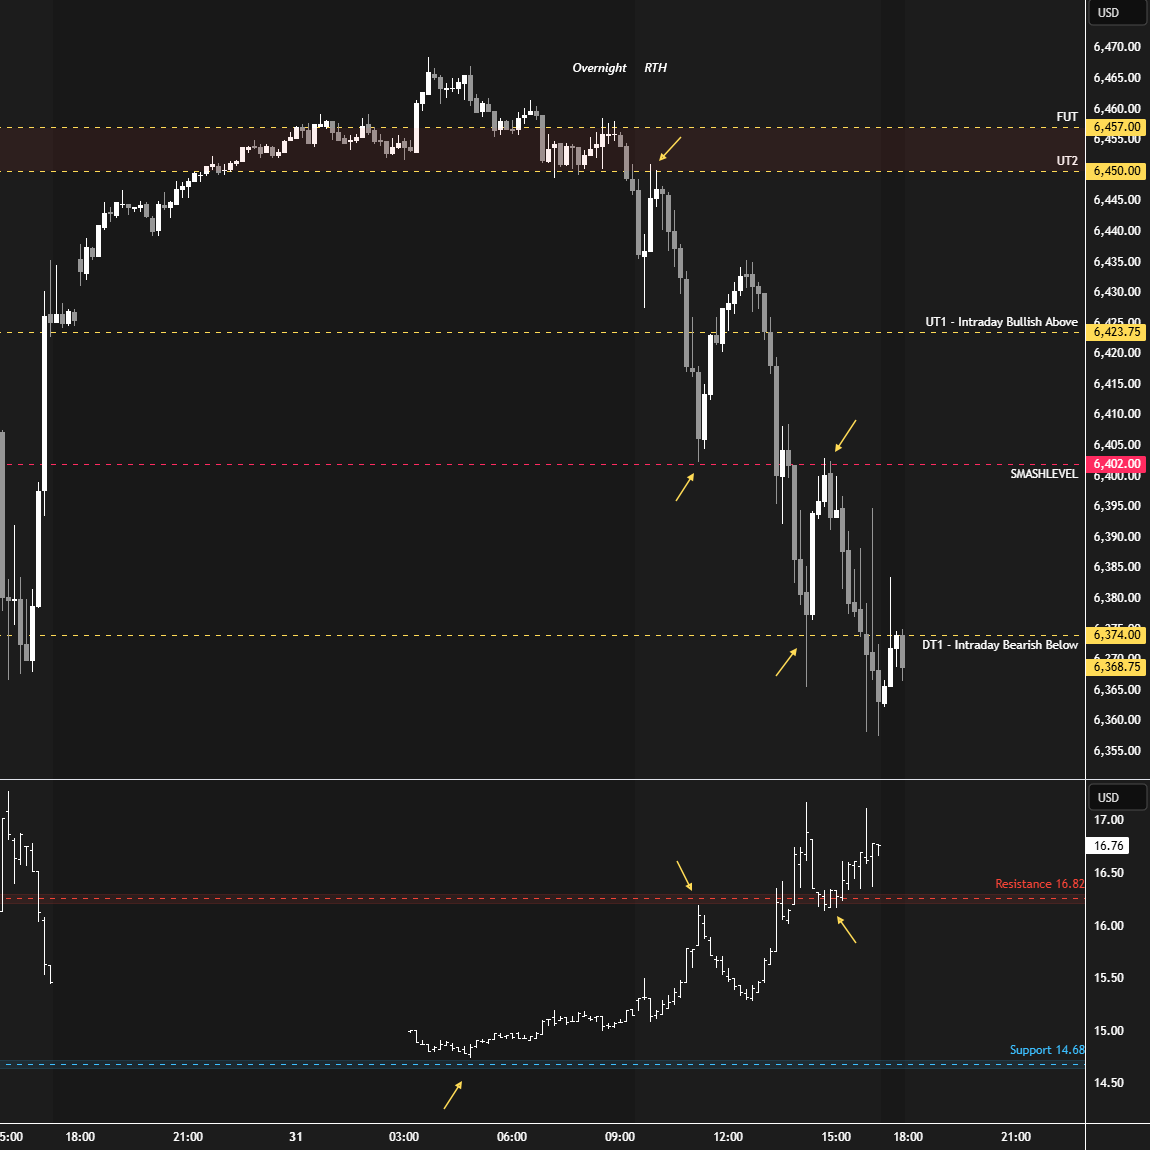
The RTH session opened on a true gap up and saw an immediate inventory correction, which wasn’t a huge surprise given the open just below the resistance area between 6450 and 6457, as well as the significant overnight move. An inventory correction isn’t inherently bearish unless acceptance is established back within the prior day’s range. It’s important not to mistake the early weakness for stronger sellers. The gap was filled during the A-period, where buyers were waiting for a gap-fill reversal, targeting a retest the the 6450-57 area. Sellers managed to defend this resistance area, not allowing buyers to gain traction above the opening level. This ultimately led to a second test of Wednesday’s high in the C-period, which failed to hold. The Smashlevel for today was set at 6402—which was a crucial level for buyers to defend. The D-period came within one tick of testing 6402, where buyers stepped in (see Figure 1), in confluence with the VIX approaching its resistance level at 16.26 (see Figure 2).
Buyers ultimately failed to establish acceptance back within the initial balance range and above Wednesday’s range. The bounce off the 6402 level instead led to an afternoon rally high in the G-period. You should know the drill by now: acceptance back within the prior day’s range after gapping higher opens the door for a full traverse of that range—completed by the J-period. The 6402 level then attracted selling activity on the following bounce, aligning perfectly with VIX resistance, and led to another downside leg into the closing session.
For the second time this week, buyers failed to sustain a true gap higher, resulting in weakness. Another all-time high was set overnight at 6468.50—a reference to carry forward. The resistance between 6398 and 6406, marking the lower end of the recent distribution, is a key area for sellers to defend in order to maintain downside pressure. The high volume node at 6428 serves as a magnet in the absence of further weakness. NFP is on deck tomorrow!
In terms of levels, the Smashlevel is at 6366—the M-period spike base. Holding above 6366 would target the resistance area between 6398 and 6406 (UT1). with a final upside target (FUT) at 6428 under sustained buying pressure.
On the flip side, failure to hold above 6366 would target 6353 (DT1). Acceptance below 6353 would signal weakness, targeting the daily NVPOC at 6336 (DT2), with a final downside target (FDT) at 6323 under sustained selling pressure.
Levels of Interest
Going into tomorrow’s session, I’ll closely observe the behavior around 6366.
Holding above 6366 would target 6398-6406 / 6428
Break and hold below 6366 would target 6353 / 6336 / 6323
Additionally, pay attention to the following VIX levels: 17.66 and 15.78. These levels can provide confirmation of strength or weakness.
Break and hold above 6428 with VIX below 15.78 would confirm strength.
Break and hold below 6323 with VIX above 17.66 would confirm weakness.
Overall, it's important to exercise caution when trading outside of the highlighted yellow levels. A non-cooperative VIX may suggest possible reversals i.e trade setups.
Accurate levels and wonderful analysis. Thank you for everything you do.
'Tis but a scratch * sigh *