
ES Daily Plan | April 9, 2026
Market Context & Key Levels for the Day Ahead

— For new subscribers
The yellow levels highlighted at the bottom left of the chart are the primary intraday levels I focus on. To avoid impulsive decisions at poor trade locations, I follow a simple but effective rule: exercise caution when initiating trades outside of these yellow levels.
This means I’m cautious about chasing longs above the Final Upside Target (FUT) and shorts below the Final Downside Target (FDT). It’s important to understand that not chasing does not imply initiating a trade in the opposite direction, discipline over impulse.
Be sure to review the Weekly Plan for a broader perspective, key levels, and market expectations for the week ahead.

Contextual Analysis & Plan
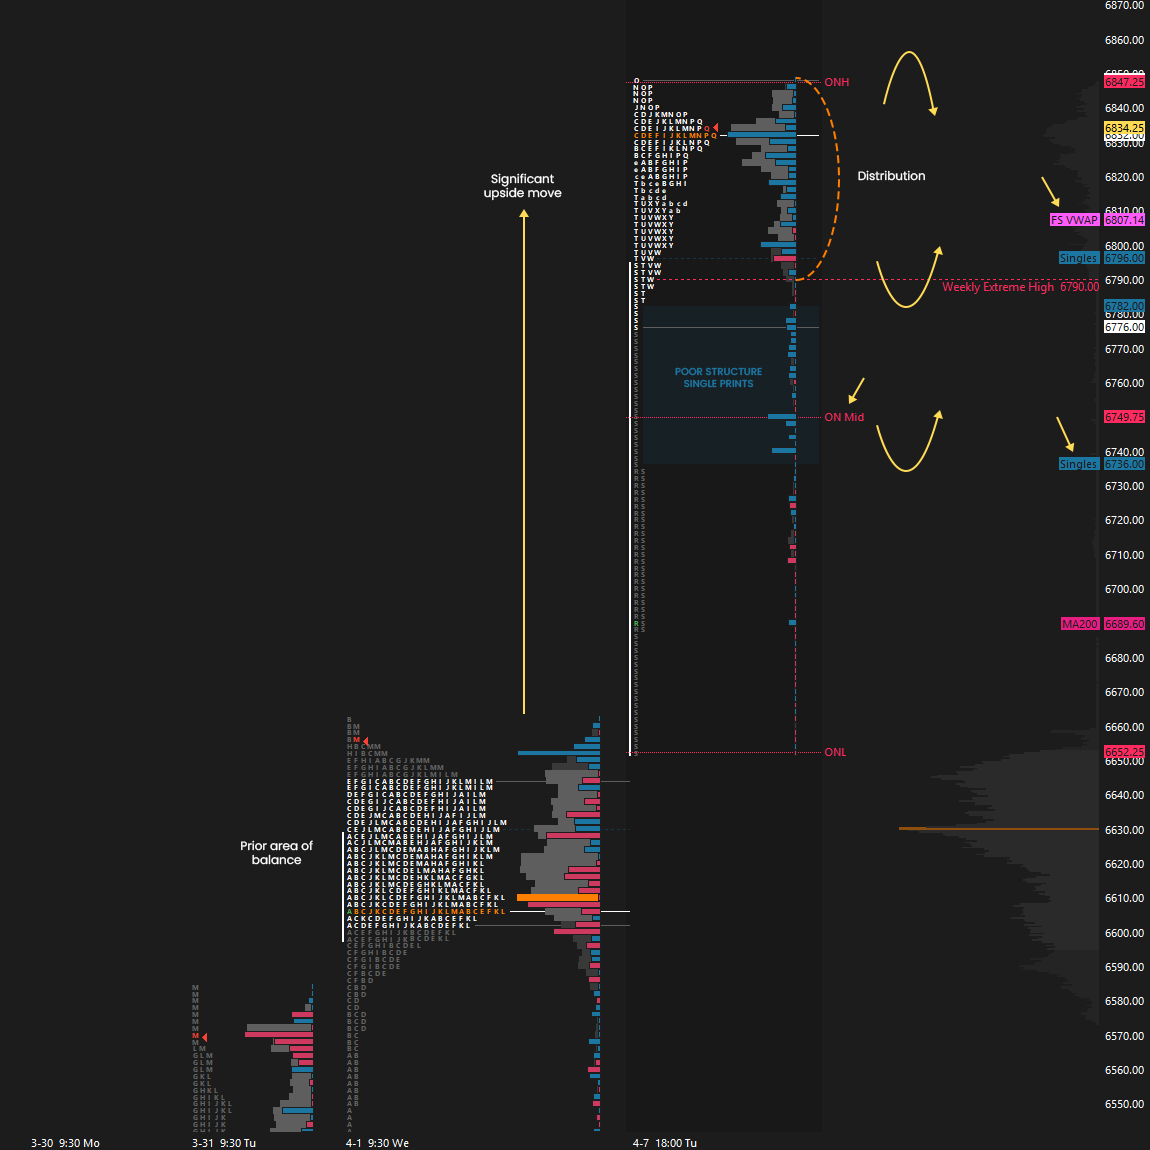
Ceasefire headlines triggered a significant upside move during the overnight session, tagging and exceeding the Weekly Extreme High at 6790. With these types of emotional moves, it’s best not to rush into anything and let the market settle. Liquidity in the book was extremely thin, another reason to stay on the sidelines (see Figure 1). Last week, we discussed how Thursday’s single prints area aligned with last month’s value area low at 6583. Overnight, the market traversed the entire value area, reaching last month’s value area high at 6833. Quite a move.
Heading into the RTH session, the key was the distribution the auction had established above the Weekly Extreme High at 6790, as highlighted pre-open (see Figure 2). If buyers were unable to accept the higher prices, a lot of poor structure was waiting to be cleaned up.
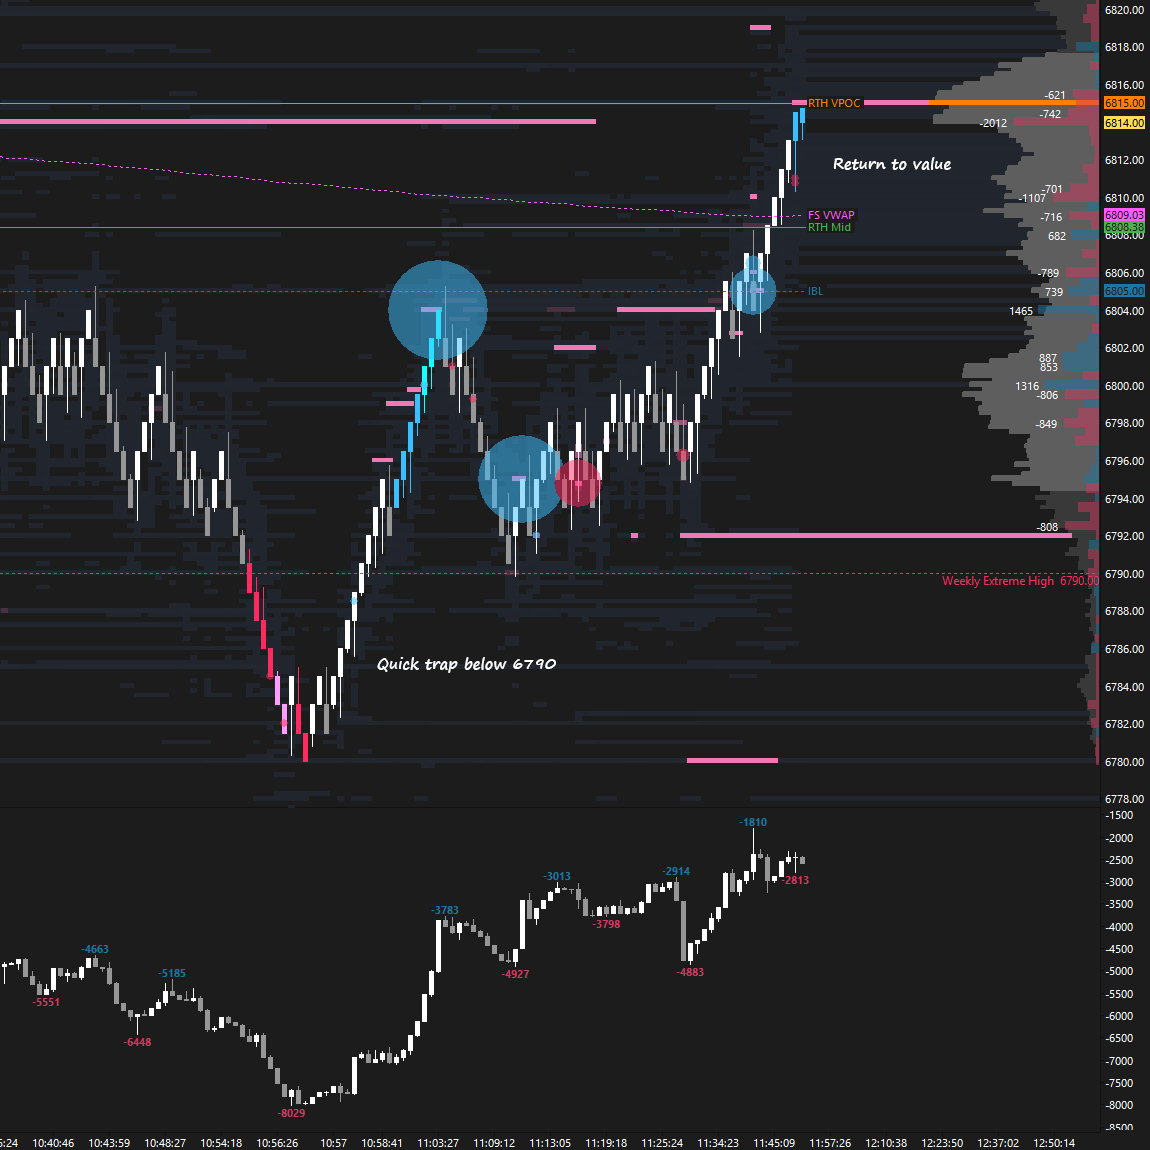
A true gap up of this size creates a tricky trading environment, which is why I’m typically less active, as these sessions tend to be lackluster while the auction digests the move. Patient traders were given an excellent trade opportunity when sellers were quickly trapped below the 6790 level (see Figure 3). A classic “look-below-and-fail” setup resulted in a move back to the developing VPOC at 6815, and eventually retest of the opening level.
Aside from this, there wasn’t much else going on, as the auction was consolidating within the overnight distribution, digesting the move. For the rest of the week, monitoring the 6790 level will remain important. Failure to hold would trap late buyers and open the door to technical structure fills. These are not necessarily bearish, but rather an opportunity for stronger buyers to enter at more favorable prices. Today’s true gap is filled at 6659.25, 164 handles below today’s settlement, meaning it would take a significant move for sellers to regain short-term control. This creates a more complex short-term environment.
A massive overnight move led to an expected uneventful RTH session, with the market consolidating within the overnight distribution and holding the key 6790 level. After reclaiming last month’s value area low last week, the auction has now fully traversed the value area, reaching last month’s value area high.
We are in a very complex situation with today’s notably large gap higher, making the trade location for an immediate upside continuation unappealing, while any weakness will likely be met by reloading buyers. Stay nimble. Intraday strength would be indicated by a reclaim of 6833 (UT1), last month’s VAH, while a break and hold below 6790 (DT1) would open the door to filling structural deficiencies.
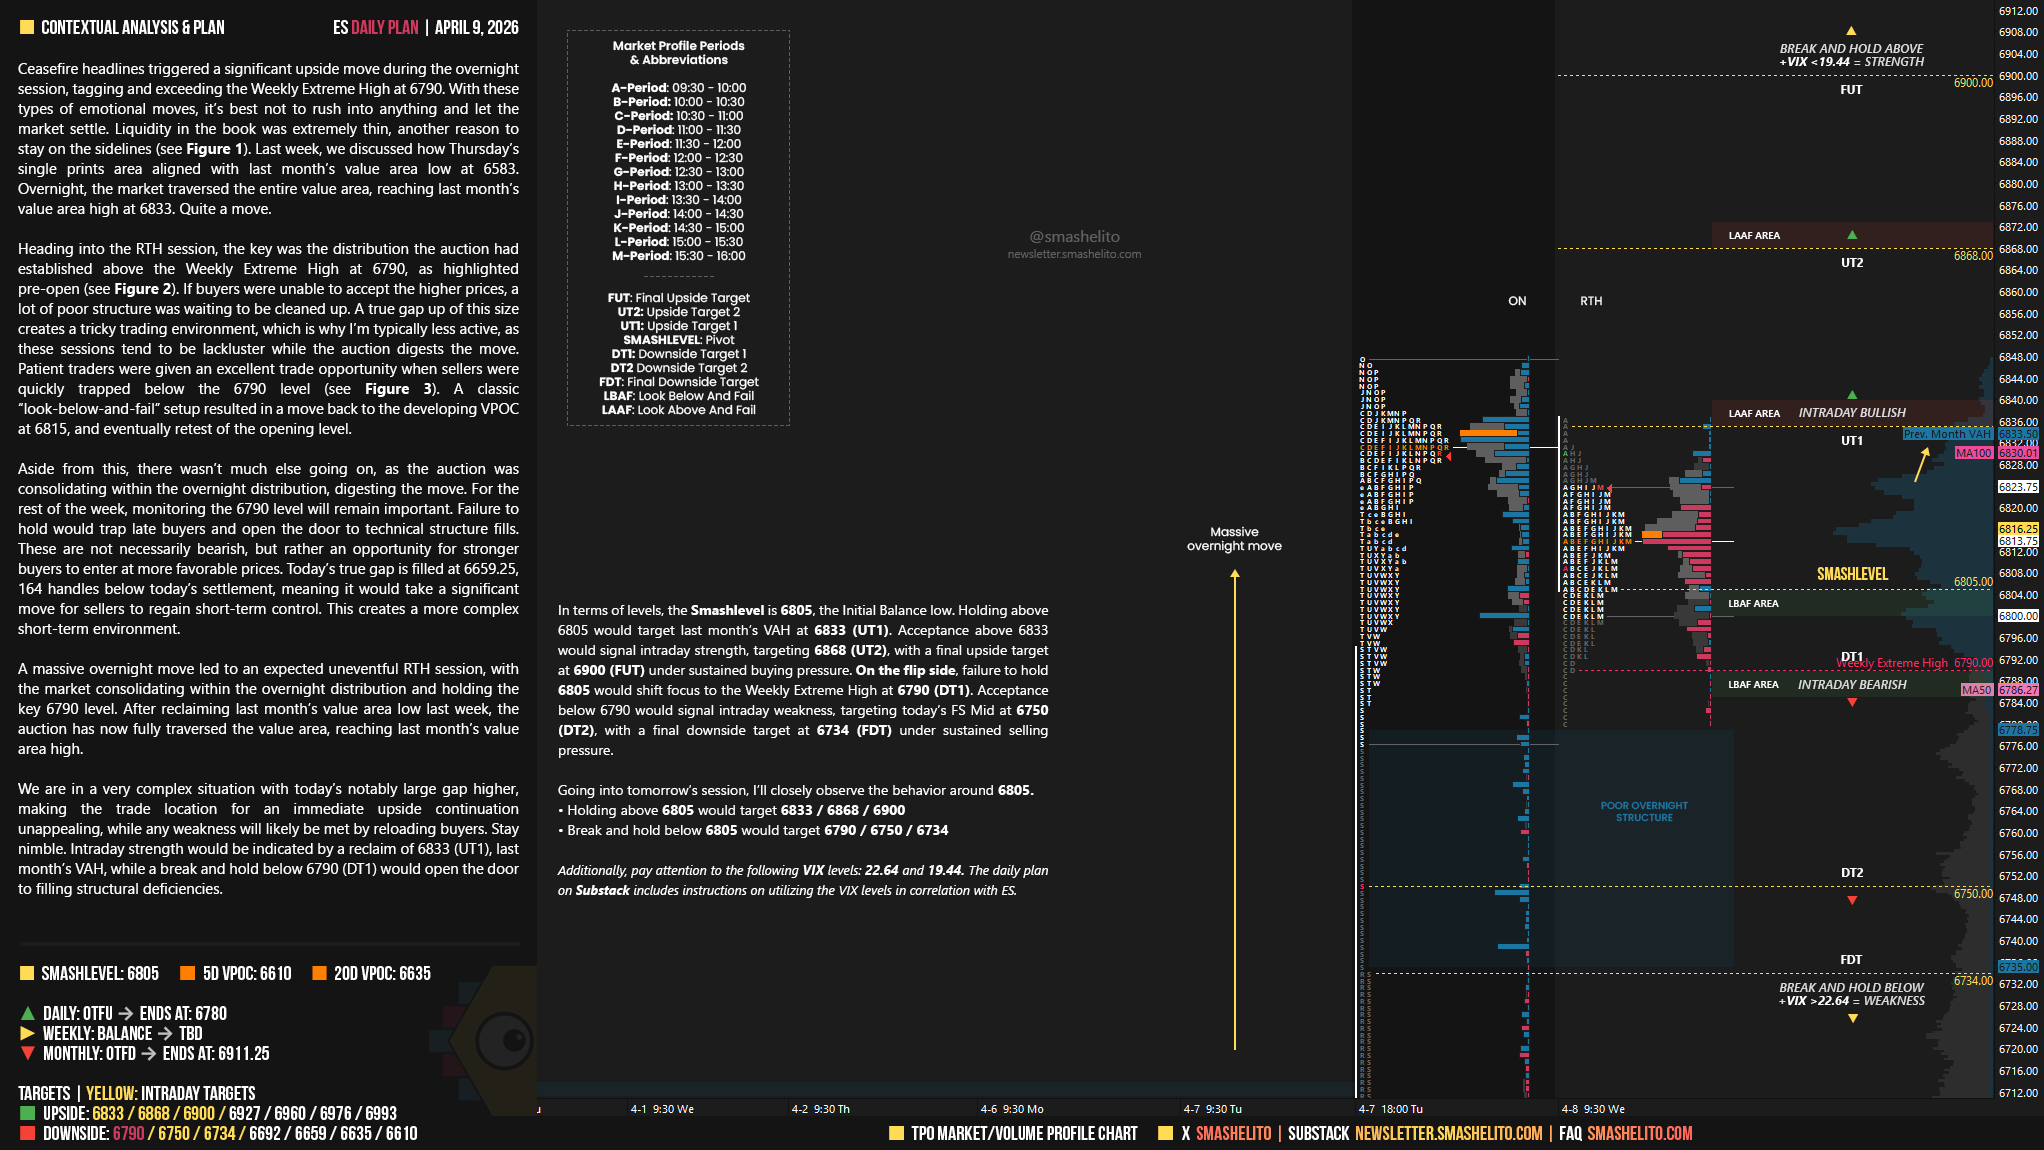
In terms of levels, the Smashlevel is 6805, the Initial Balance low. Holding above 6805 would target last month’s VAH at 6833 (UT1). Acceptance above 6833 would signal intraday strength, targeting 6868 (UT2), with a final upside target at 6900 (FUT) under sustained buying pressure.
On the flip side, failure to hold 6805 would shift focus to the Weekly Extreme High at 6790 (DT1). Acceptance below 6790 would signal intraday weakness, targeting today’s FS Mid at 6750 (DT2), with a final downside target at 6734 (FDT) under sustained selling pressure.
Visual Representation
Levels of Interest
Going into tomorrow’s session, I’ll closely observe the behavior around 6805.
Holding above 6805 would target 6833 / 6868 / 6900
Break and hold below 6805 would target 6790 / 6750 / 6734
Additionally, pay attention to the following VIX levels: 22.64 and 19.44. These levels can provide confirmation of strength or weakness.
Break and hold above 6900 with VIX below 19.44 would confirm strength.
Break and hold below 6734 with VIX above 22.64 would confirm weakness.
Overall, it's important to exercise caution when trading outside of the highlighted yellow levels. A non-cooperative VIX may suggest possible reversals i.e trade setups.
I took the loong you mencioned in the context, however, I was biased towards the inventory correction, and when I saw a large number of aggressive buy orders being executed on the IBL, I closed the position and went short. Obviously, I turned a large trade into a loss. Any advice from you, since you have more experience with this?
Amazing work! Thank you