
ES Weekly Plan | April 6-10, 2026
Recap, Market Context & Key Levels for the Week Ahead

Welcome to this week’s plan. Inside, you’ll find a quick review of last week’s price action, key economic events, market structure, context for the week ahead, and the levels I’ll be focusing on. Let’s get prepared.
Contents
Last Week in Review
Economic & Earnings Calendar
Market Structure
Contextual Analysis & Plan
Key Levels of Interest
Last Week in Review
Last week’s plan:

Last week, we once again discussed that the auction had moved significantly away from multiple value references, which opened the door for a potential short-covering rally if an immediate downside continuation failed to materialize.
Sellers attempted downside continuation on Monday pre-market, probing below the prior week’s low. The move failed, triggering a notable short-covering rally ahead of RTH. The RTH session then retraced the overnight gains, closing the session below the prior week’s low.
The key on Tuesday was whether sellers could build value below the prior week’s low, as failure to do so would keep the door open for a short-covering rally. Sellers again failed to gain downside traction, triggering an overnight short-covering rally that extended through RTH, forming a double distribution trend day. The gap at 6520.25 was filled in the process.
Tuesday’s strength was followed by a sustained true gap up on Wednesday, pushing the auction into the 6605–6635 weekly resistance area. The 6635 high volume node was identified as a potential upside magnet in the absence of early weakness and remained pivotal for the rest of the week.
Upon reaching this high volume area, which represents a location where prior value has been established, we could expect upside momentum to slow down, especially after a rally of nearly 300 handles.
Thursday’s session was quite interesting, as it opened on a notably large true gap down, leaving Wednesday’s buyers trapped. This presented an excellent opportunity for sellers to do what they have done over the past several weeks and close out the week with weakness. However, responsive buyers stepped in within the single prints that separated Tuesday’s double distribution, and the session moved back within Wednesday’s range after closing the true gap (see Figure 1).
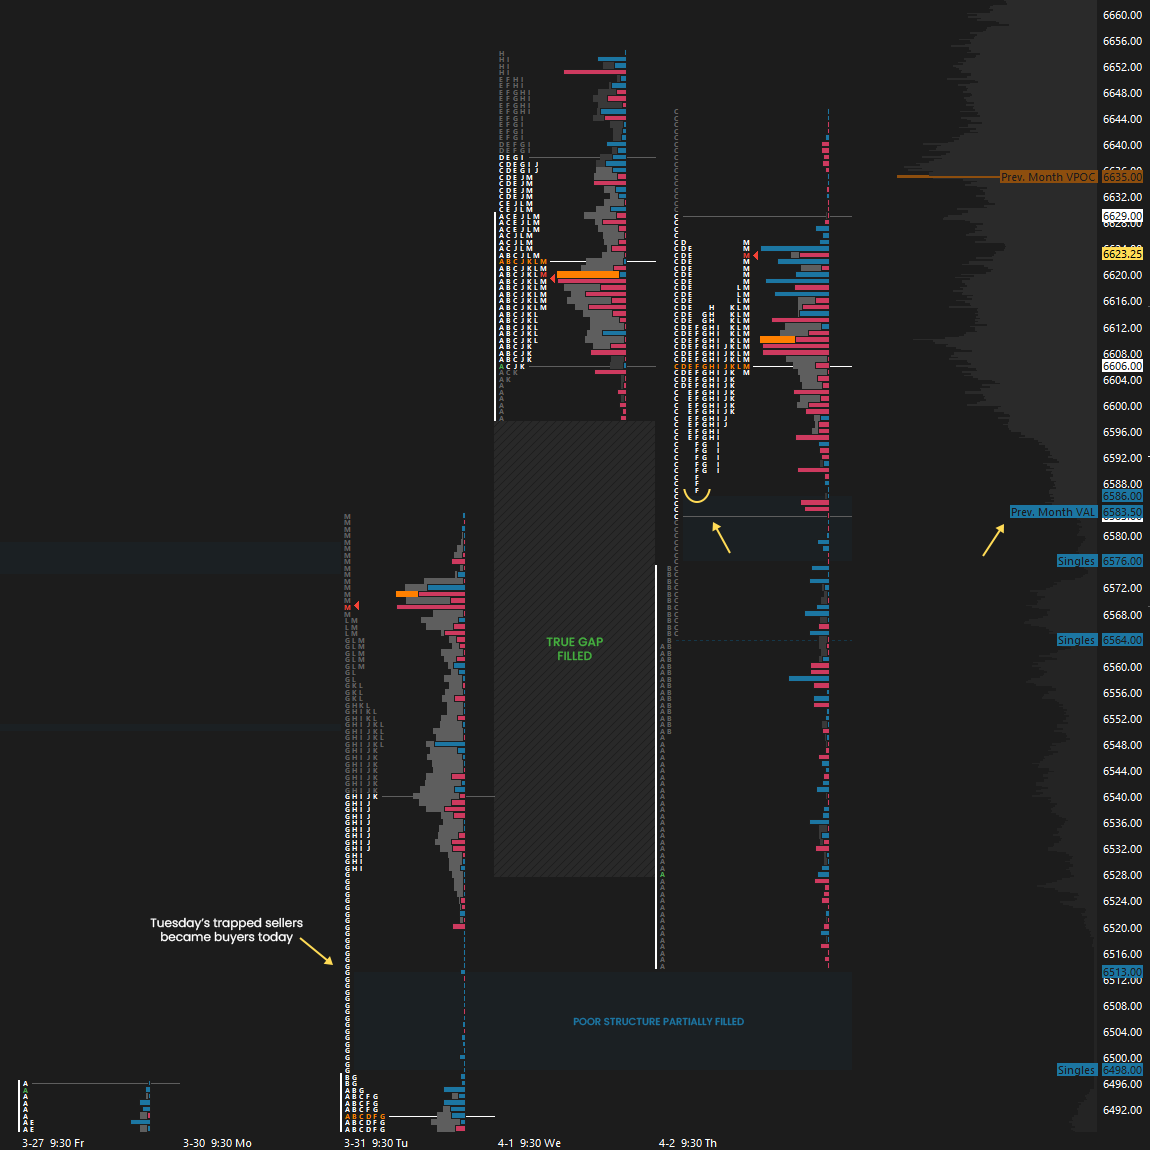
It’s hard to know what to make of Thursday’s session, but it’s clear that stronger sellers were absent. They would not have allowed a gap of that size to be filled or the session to close back within Wednesday’s range. Note that we are also back within the value area of the previous month, which coincides with Thursday’s single prints that ultimately formed a double distribution profile. This is obviously a very news-sensitive market, but this set of single prints will be key to monitor moving forward.
Last Week’s Levels in Review
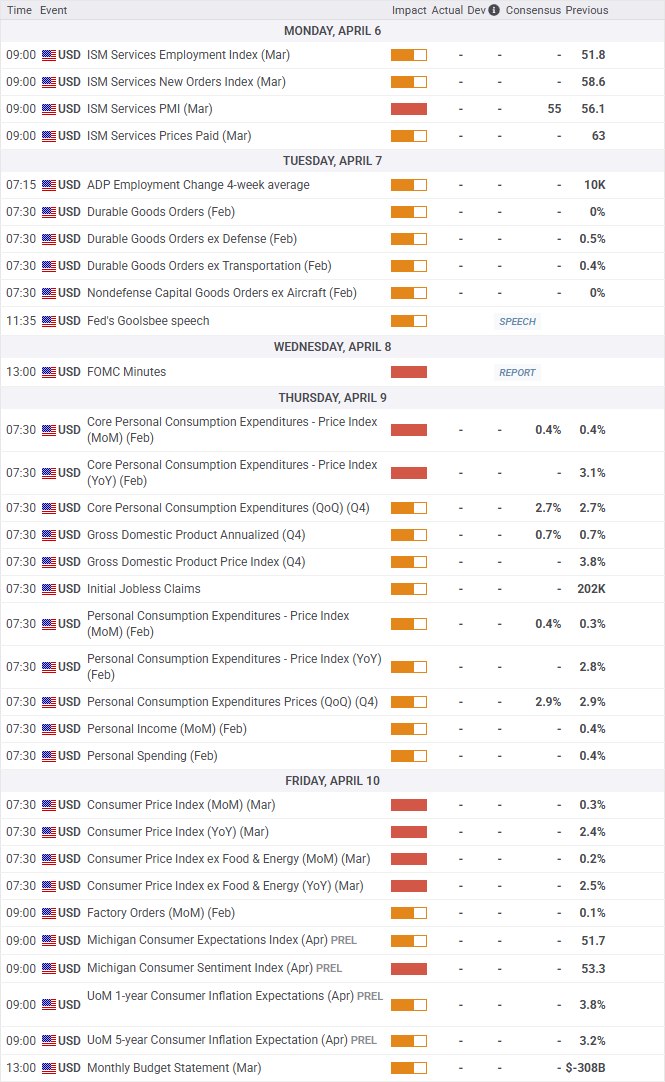
Economic & Earnings Calendar
Central Standard Time
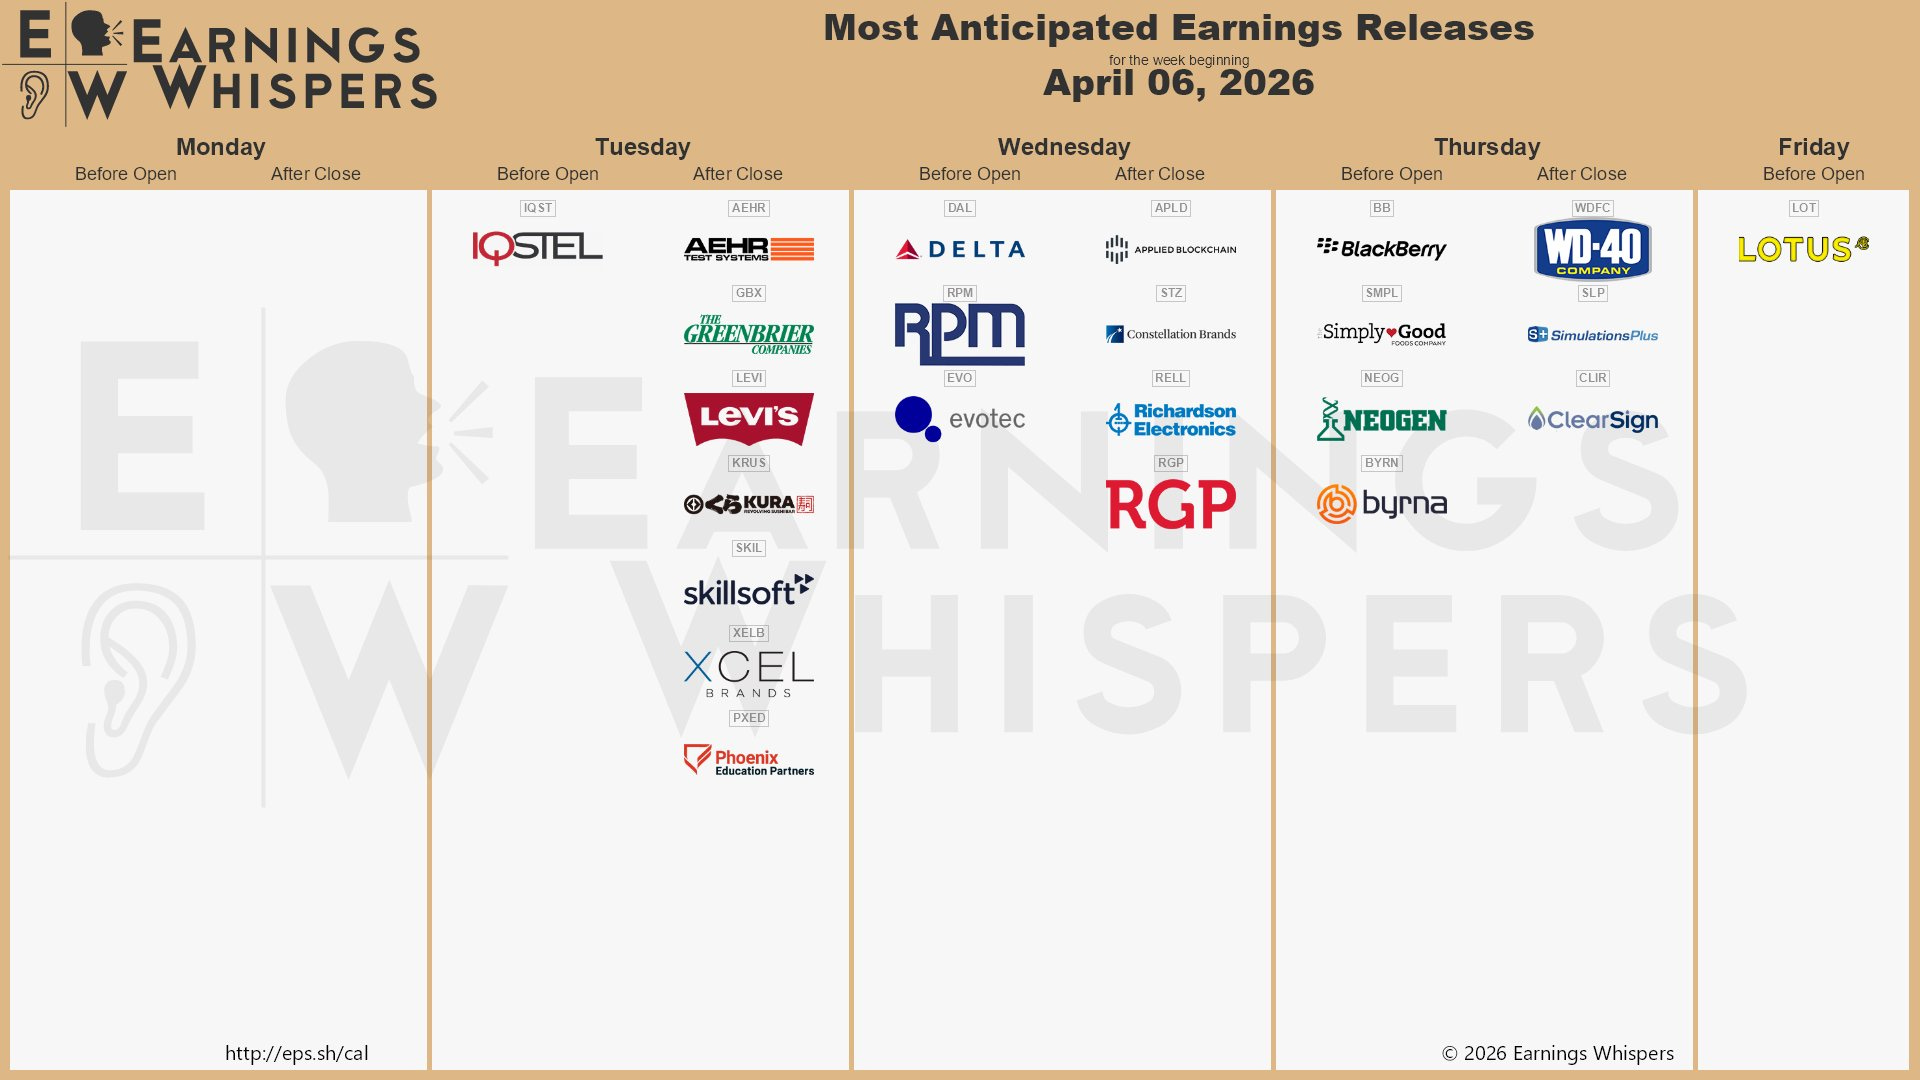
Earnings Whispers
Market Structure
🟨 Daily: BALANCE → 2-Day → High: 6653.75 / Low: 6514.25
🟥 Weekly: OTFD → Ends at: 6653.75
🟥 Monthly: OTFD → Ends at: 6911.25
Balance: A market condition where price consolidates within a defined range, reflecting indecision as the market awaits more market-generated information. We apply balance guidelines—favoring fade trades at range extremes (highs/lows) and preparing for breakout setups if balance resolves.
One-Time Framing Up (OTFU): A market condition where each subsequent bar forms a higher low, signaling a strong upward trend.
One-Time Framing Down (OTFD): A market condition where each subsequent bar forms a lower high, signaling a strong downward trend.
Contextual Analysis & Plan
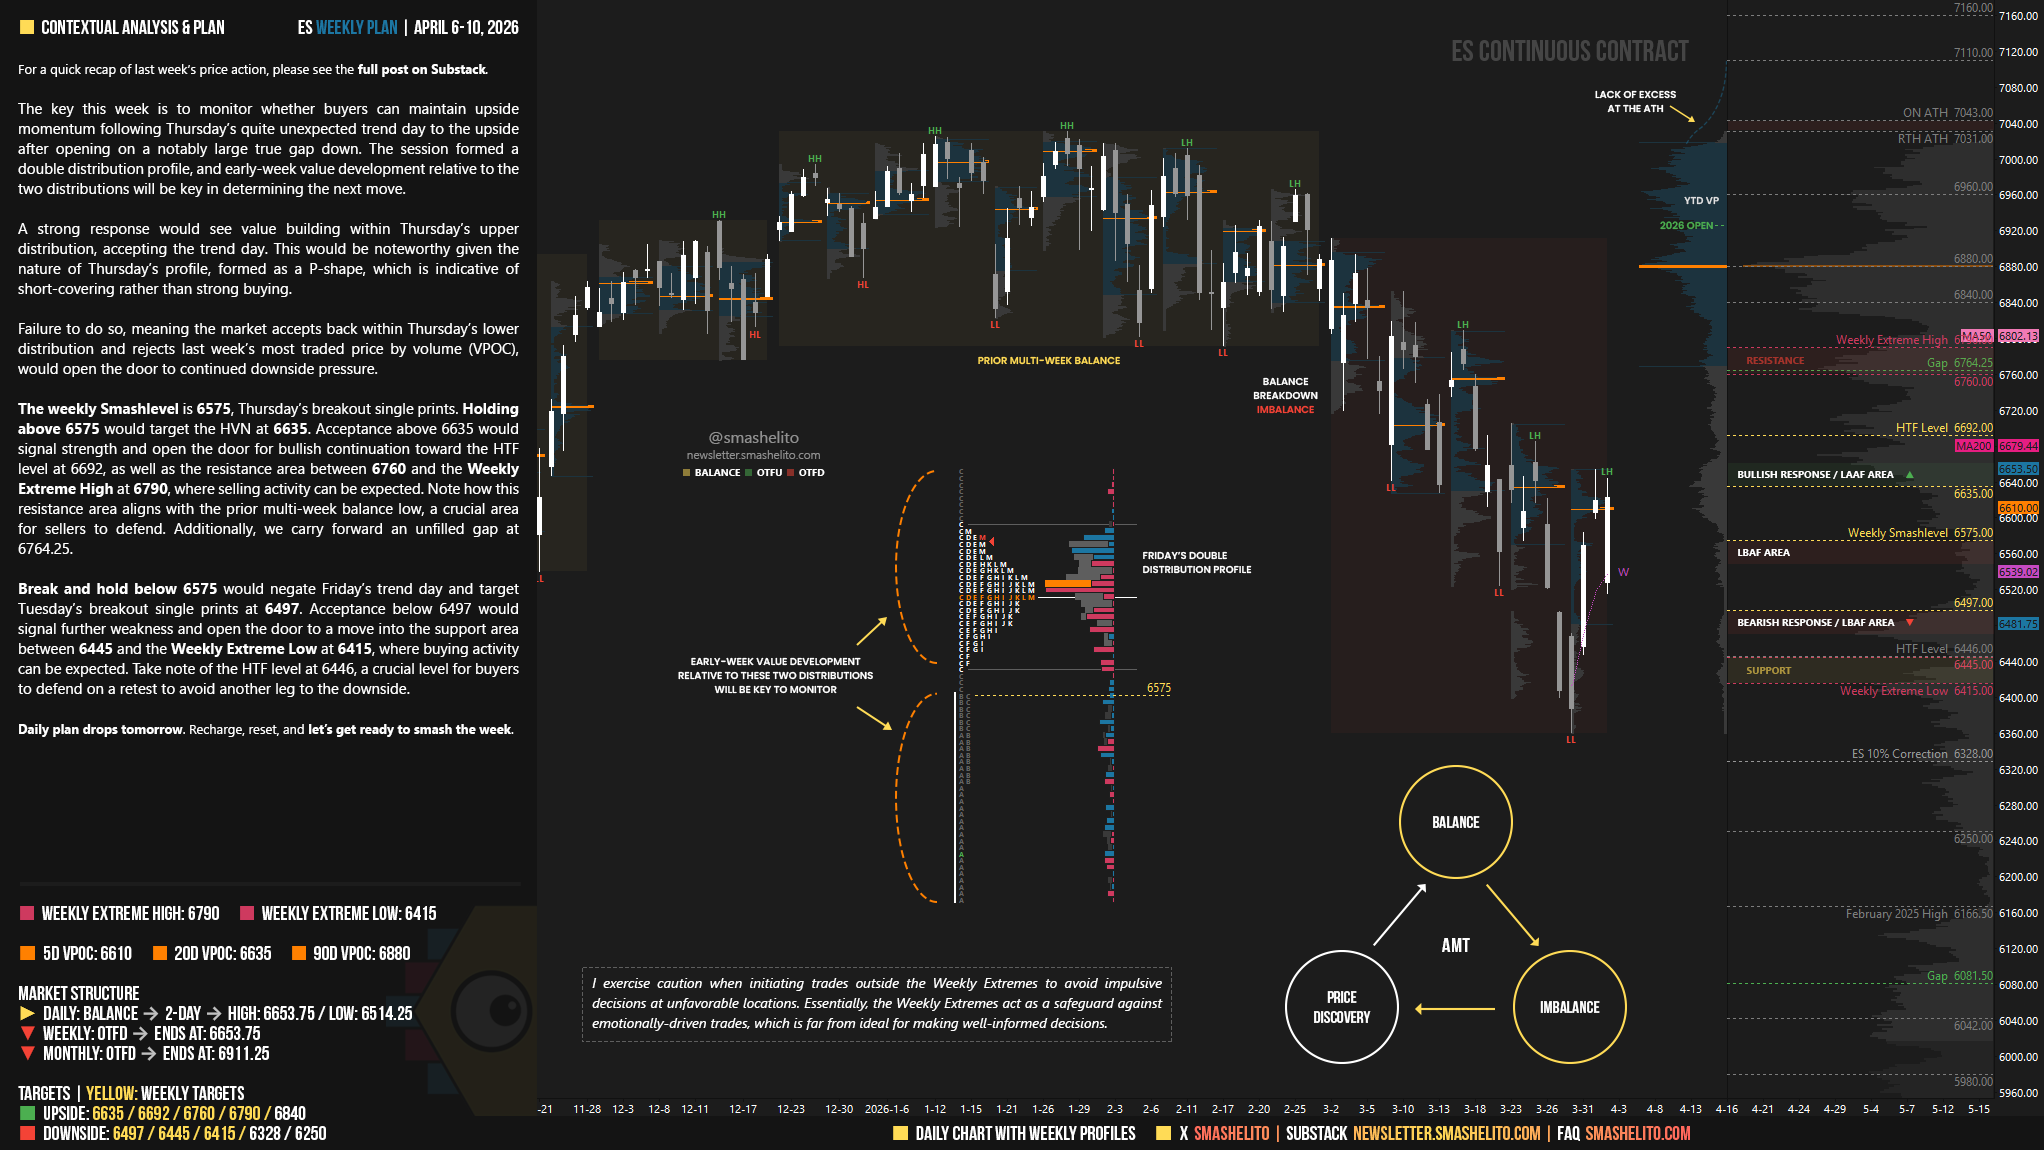
The key this week is to monitor whether buyers can maintain upside momentum following Thursday’s quite unexpected trend day to the upside after opening on a notably large true gap down. The session formed a double distribution profile, and early-week value development relative to the two distributions will be key in determining the next move.
A strong response would see value building within Thursday’s upper distribution, accepting the trend day. This would be noteworthy given the nature of Thursday’s profile, formed as a P-shape, which is indicative of short-covering rather than strong buying.
Failure to do so, meaning the market accepts back within Thursday’s lower distribution and rejects last week’s most traded price by volume (VPOC), would open the door to continued downside pressure.
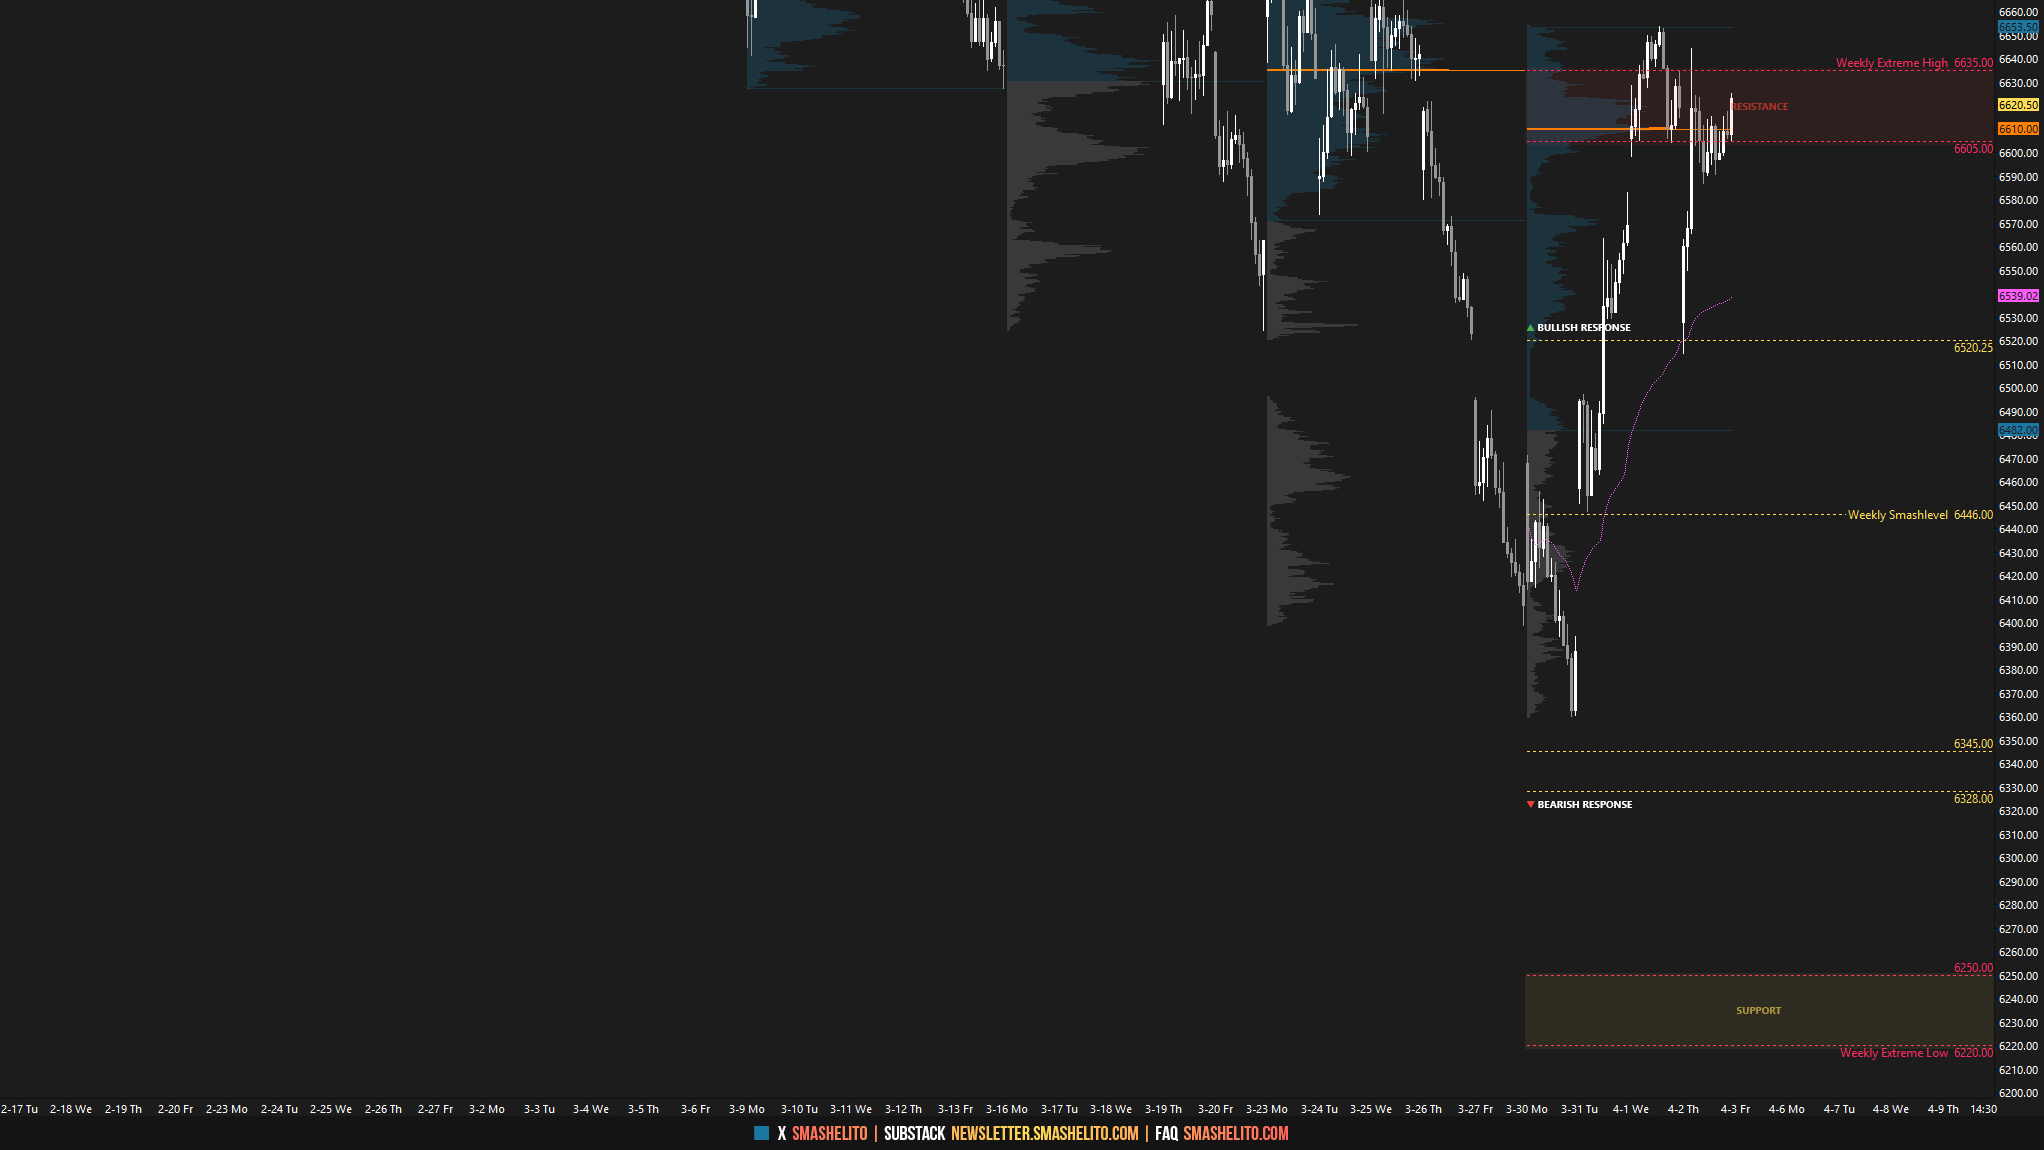
The weekly Smashlevel is 6575, Thursday’s breakout single prints. Holding above 6575 would target the HVN at 6635. Acceptance above 6635 would signal strength and open the door for bullish continuation toward the HTF level at 6692, as well as the resistance area between 6760 and the Weekly Extreme High at 6790, where selling activity can be expected. Note how this resistance area aligns with the prior multi-week balance low, a crucial area for sellers to defend. Additionally, we carry forward an unfilled gap at 6764.25.
Break and hold below 6575 would negate Friday’s trend day and target Tuesday’s breakout single prints at 6497. Acceptance below 6497 would signal further weakness and open the door to a move into the support area between 6445 and the Weekly Extreme Low at 6415, where buying activity can be expected. Take note of the HTF level at 6446, a crucial level for buyers to defend on a retest to avoid another leg to the downside.
Key Levels of Interest
In the upcoming week, I will closely observe the behavior around 6575.
Holding above 6575 would target 6635 / 6692 / 6760 / 6790* / 6840
Break and hold below 6575 would target 6497 / 6445 / 6415* / 6328 / 6250
*Weekly Extremes (defined by proprietary models). I exercise caution when initiating trades outside the Weekly Extremes to avoid impulsive decisions at unfavorable locations. Essentially, the Weekly Extremes act as a safeguard against emotionally-driven trades, which is far from ideal for making well-informed decisions.
Daily plan drops tomorrow. Recharge, reset, and let’s get ready to smash the week.
Thank you for the perspective on this week that is beginning, I appreciate all your guidance and knowledge, have a great week.
Thanks Smash!💥