
ES Daily Plan | April 7, 2026
Market Context & Key Levels for the Day Ahead

— For new subscribers
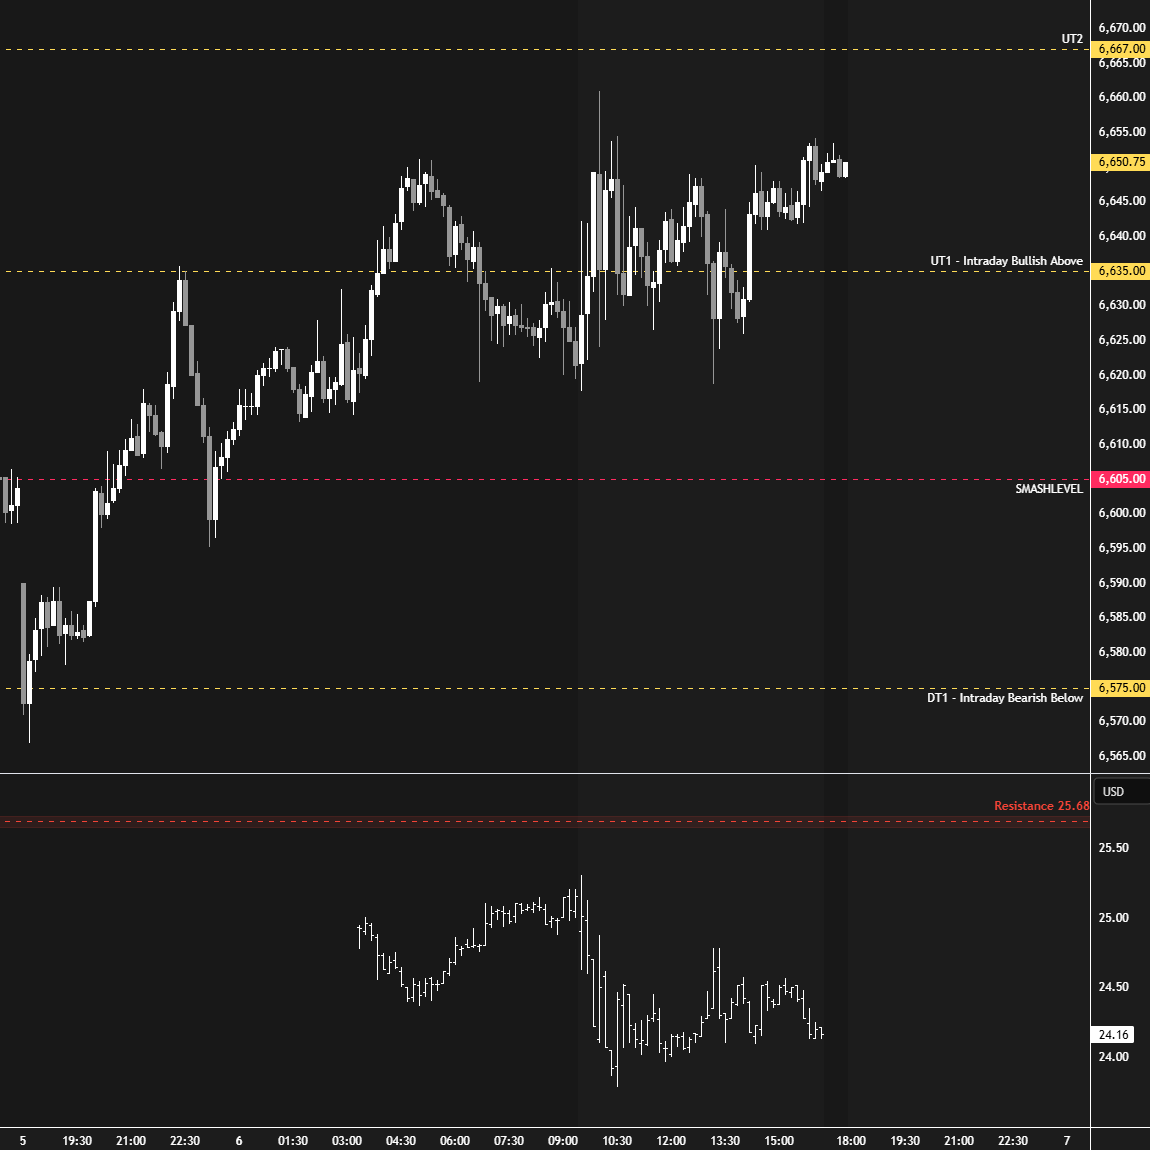
The yellow levels highlighted at the bottom left of the chart are the primary intraday levels I focus on. To avoid impulsive decisions at poor trade locations, I follow a simple but effective rule: exercise caution when initiating trades outside of these yellow levels.
This means I’m cautious about chasing longs above the Final Upside Target (FUT) and shorts below the Final Downside Target (FDT). It’s important to understand that not chasing does not imply initiating a trade in the opposite direction, discipline over impulse.
Be sure to review the Weekly Plan for a broader perspective, key levels, and market expectations for the week ahead.

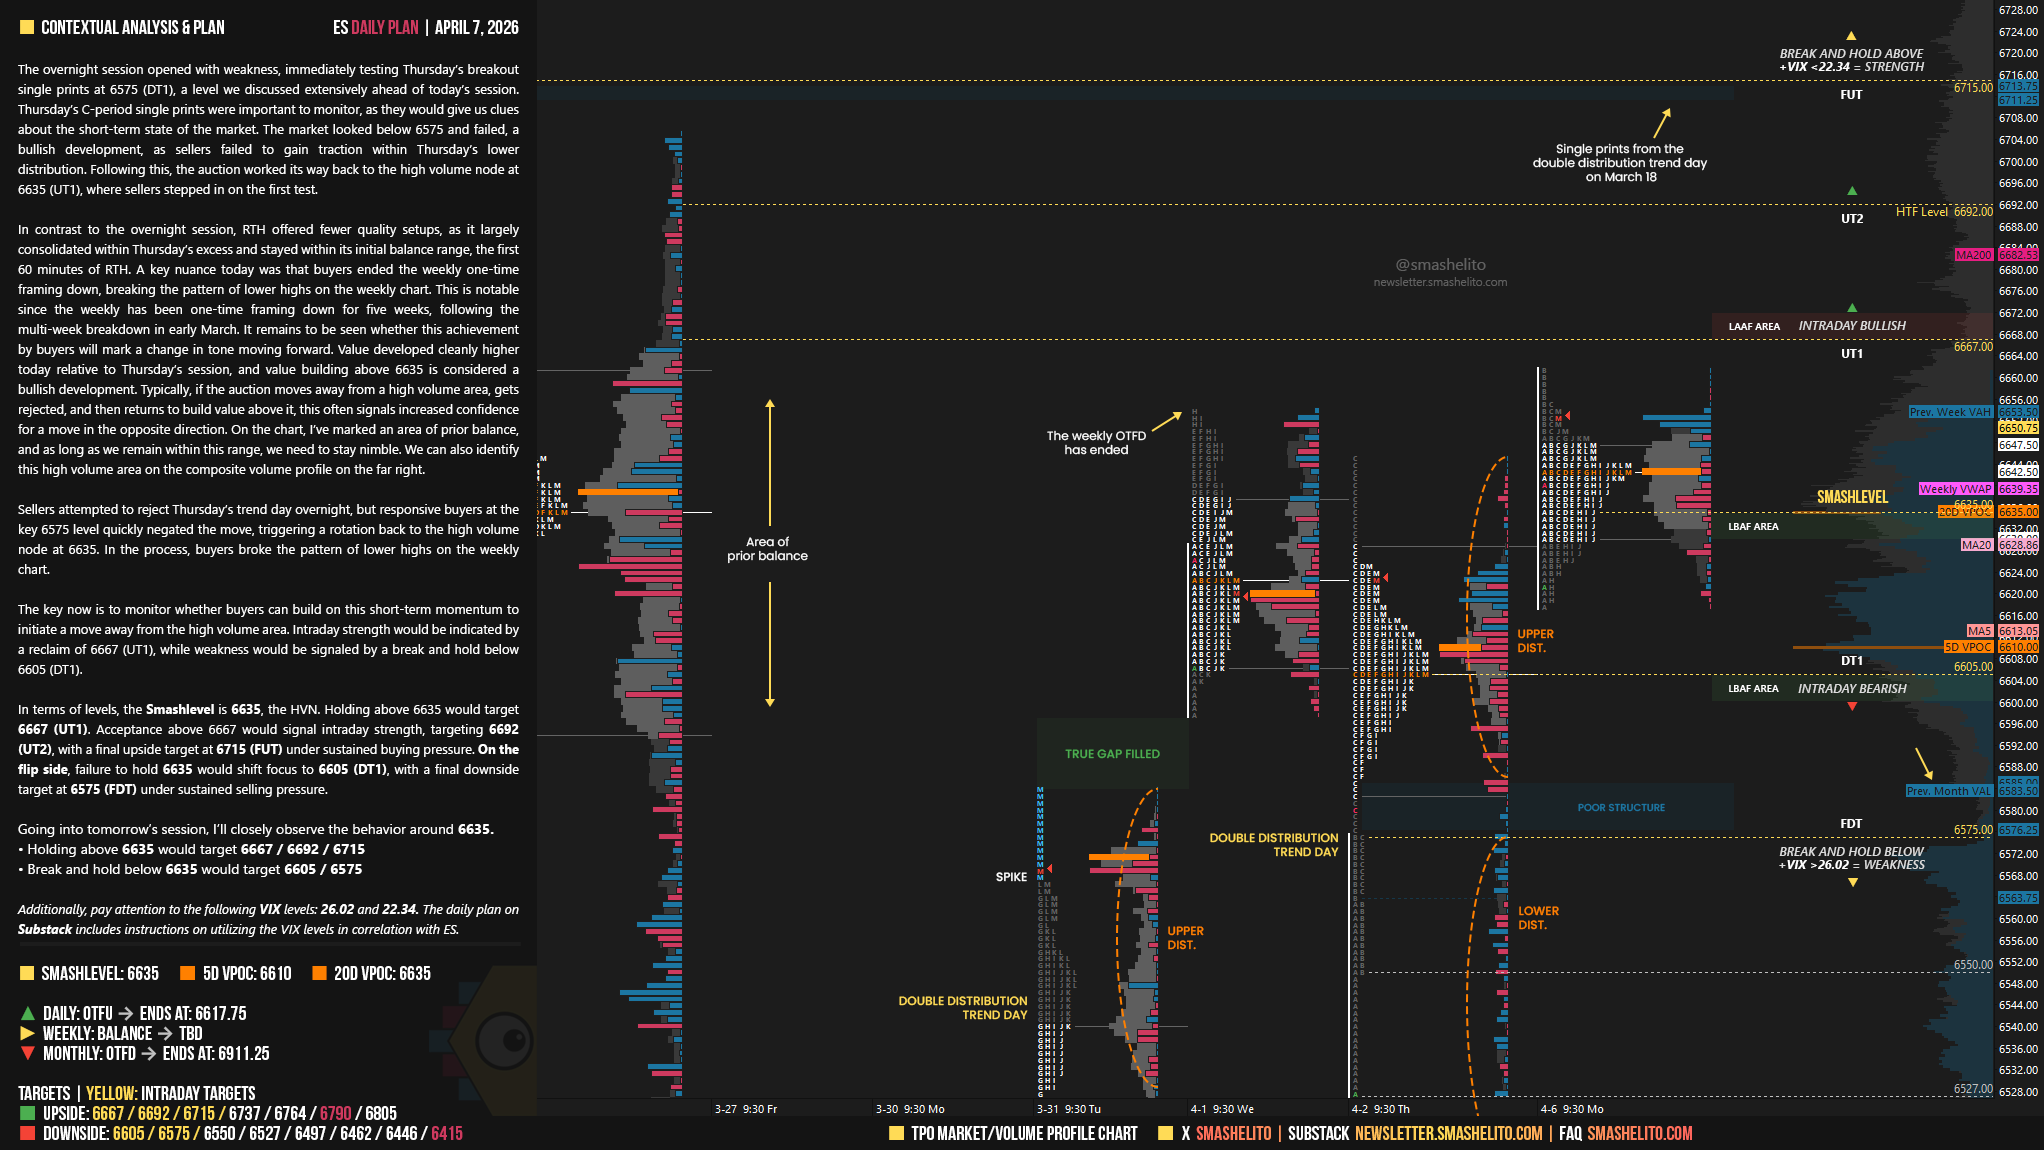
Contextual Analysis & Plan
The overnight session opened with weakness, immediately testing Thursday’s breakout single prints at 6575 (DT1), a level we discussed extensively ahead of today’s session. Thursday’s C-period single prints were important to monitor, as they would give us clues about the short-term state of the market. The market looked below 6575 and failed, a bullish development, as sellers failed to gain traction within Thursday’s lower distribution. Following this, the auction worked its way back to the high volume node at 6635 (UT1), where sellers stepped in on the first test.
In contrast to the overnight session, RTH offered fewer quality setups, as it largely consolidated within Thursday’s excess and stayed within its initial balance range, the first 60 minutes of RTH. A key nuance today was that buyers ended the weekly one-time framing down, breaking the pattern of lower highs on the weekly chart. This is notable since the weekly has been one-time framing down for five weeks, following the multi-week breakdown in early March. It remains to be seen whether this achievement by buyers will mark a change in tone moving forward.
Value developed cleanly higher today relative to Thursday’s session, and value building above 6635 is considered a bullish development. Typically, if the auction moves away from a high volume area, gets rejected, and then returns to build value above it, this often signals increased confidence for a move in the opposite direction. On the chart, I’ve marked an area of prior balance, and as long as we remain within this range, we need to stay nimble. We can also identify this high volume area on the composite volume profile on the far right.
Sellers attempted to reject Thursday’s trend day overnight, but responsive buyers at the key 6575 level quickly negated the move, triggering a rotation back to the high volume node at 6635. In the process, buyers broke the pattern of lower highs on the weekly chart.
The key now is to monitor whether buyers can build on this short-term momentum to initiate a move away from the high volume area. Intraday strength would be indicated by a reclaim of 6667 (UT1), while weakness would be signaled by a break and hold below 6605 (DT1).
In terms of levels, the Smashlevel is 6635, the HVN. Holding above 6635 would target 6667 (UT1). Acceptance above 6667 would signal intraday strength, targeting 6692 (UT2), with a final upside target at 6715 (FUT) under sustained buying pressure.
On the flip side, failure to hold 6635 would shift focus to 6605 (DT1), with a final downside target at 6575 (FDT) under sustained selling pressure.
Visual Representation
Levels of Interest
Going into tomorrow’s session, I’ll closely observe the behavior around 6635.
Holding above 6635 would target 6667 / 6692 / 6715
Break and hold below 6635 would target 6605 / 6575
Additionally, pay attention to the following VIX levels: 26.02 and 22.34. These levels can provide confirmation of strength or weakness.
Break and hold above 6715 with VIX below 22.34 would confirm strength.
Break and hold below 6575 with VIX above 26.02 would confirm weakness.
Overall, it's important to exercise caution when trading outside of the highlighted yellow levels. A non-cooperative VIX may suggest possible reversals i.e trade setups.
Thanks smash for the perspective, great detail!
Thanks Smash!