
ES Daily Plan | April 6, 2026
Market Context & Key Levels for the Day Ahead

— For new subscribers
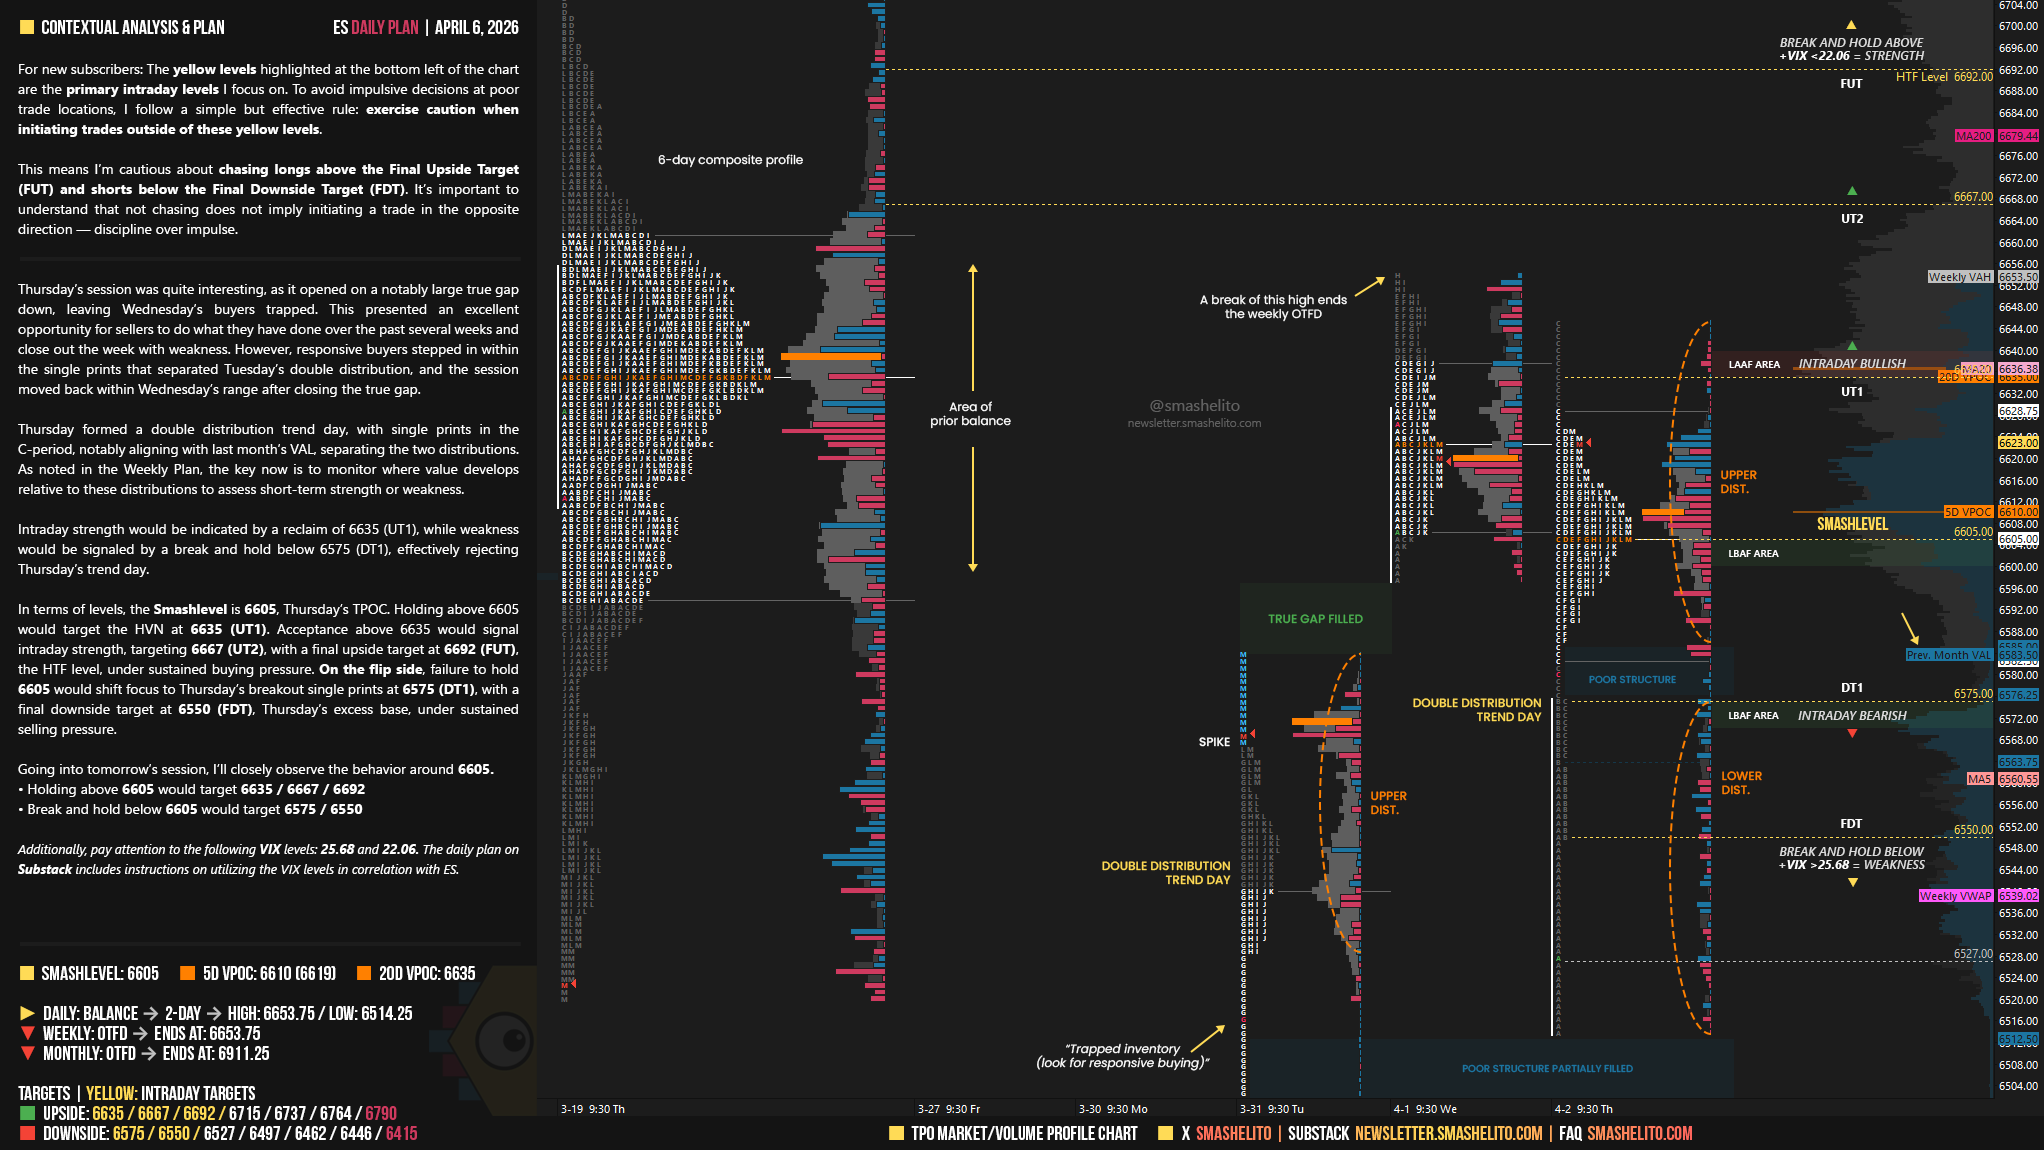
The yellow levels highlighted at the bottom left of the chart are the primary intraday levels I focus on. To avoid impulsive decisions at poor trade locations, I follow a simple but effective rule: exercise caution when initiating trades outside of these yellow levels.
This means I’m cautious about chasing longs above the Final Upside Target (FUT) and shorts below the Final Downside Target (FDT). It’s important to understand that not chasing does not imply initiating a trade in the opposite direction, discipline over impulse.
Be sure to review the Weekly Plan for a broader perspective, key levels, and market expectations for the week ahead.

Contextual Analysis & Plan
Thursday’s session was quite interesting, as it opened on a notably large true gap down, leaving Wednesday’s buyers trapped. This presented an excellent opportunity for sellers to do what they have done over the past several weeks and close out the week with weakness. However, responsive buyers stepped in within the single prints that separated Tuesday’s double distribution, and the session moved back within Wednesday’s range after closing the true gap.
Thursday formed a double distribution trend day, with single prints in the C-period, notably aligning with last month’s VAL, separating the two distributions. As noted in the Weekly Plan, the key now is to monitor where value develops relative to these distributions to assess short-term strength or weakness.
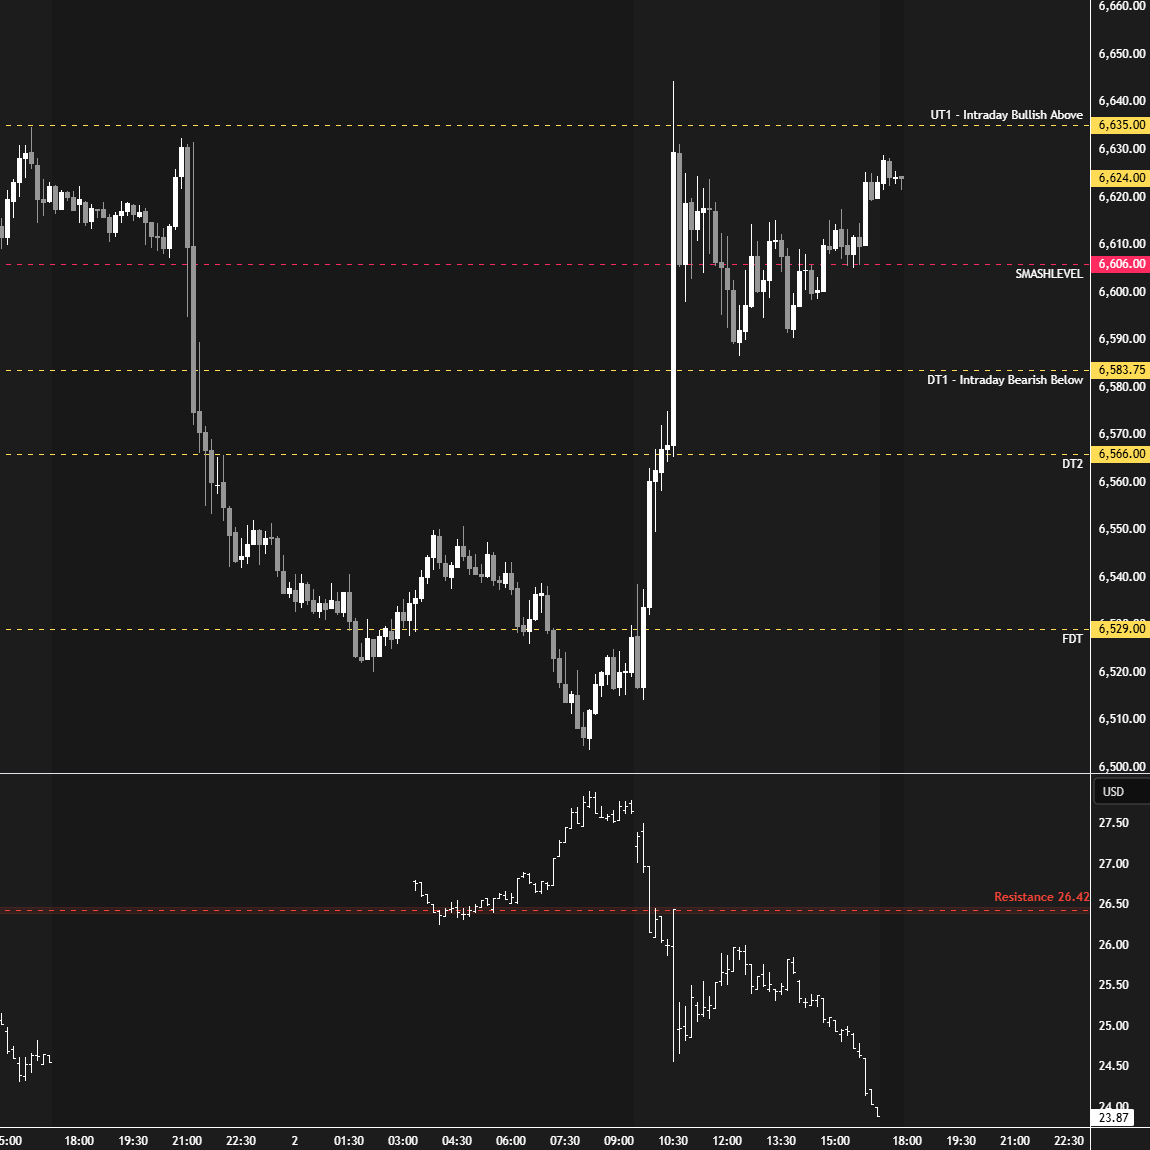
Intraday strength would be indicated by a reclaim of 6635 (UT1), while weakness would be signaled by a break and hold below 6575 (DT1), effectively rejecting Thursday’s trend day.
In terms of levels, the Smashlevel is 6605, Thursday’s TPOC. Holding above 6605 would target the HVN at 6635 (UT1). Acceptance above 6635 would signal intraday strength, targeting 6667 (UT2), with a final upside target at 6692 (FUT), the HTF level, under sustained buying pressure.
On the flip side, failure to hold 6605 would shift focus to Thursday’s breakout single prints at 6575 (DT1), with a final downside target at 6550 (FDT), Thursday’s excess base, under sustained selling pressure.
Visual Representation
Levels of Interest
Going into tomorrow’s session, I’ll closely observe the behavior around 6605.
Holding above 6605 would target 6635 / 6667 / 6692
Break and hold below 6605 would target 6575 / 6550
Additionally, pay attention to the following VIX levels: 25.68 and 22.06. These levels can provide confirmation of strength or weakness.
Break and hold above 6692 with VIX below 22.06 would confirm strength.
Break and hold below 6550 with VIX above 25.68 would confirm weakness.
Overall, it's important to exercise caution when trading outside of the highlighted yellow levels. A non-cooperative VIX may suggest possible reversals i.e trade setups.
Have a great session tomorrow! Many blessings.
Thanks smash 💥 in TPO do you use letter price increment in ticks 5 regular or it’s just for newsletter?