
ES Daily Plan | April 29, 2026
Market Context & Key Levels for the Day Ahead

— For new subscribers
The yellow levels highlighted at the bottom left of the chart are the primary intraday levels I focus on. To avoid impulsive decisions at poor trade locations, I follow a simple but effective rule: exercise caution when initiating trades outside of these yellow levels.
This means I’m cautious about chasing longs above the Final Upside Target (FUT) and shorts below the Final Downside Target (FDT). It’s important to understand that not chasing does not imply initiating a trade in the opposite direction, discipline over impulse.
Be sure to review the Weekly Plan for a broader perspective, key levels, and market expectations for the week ahead.

Contextual Analysis & Plan
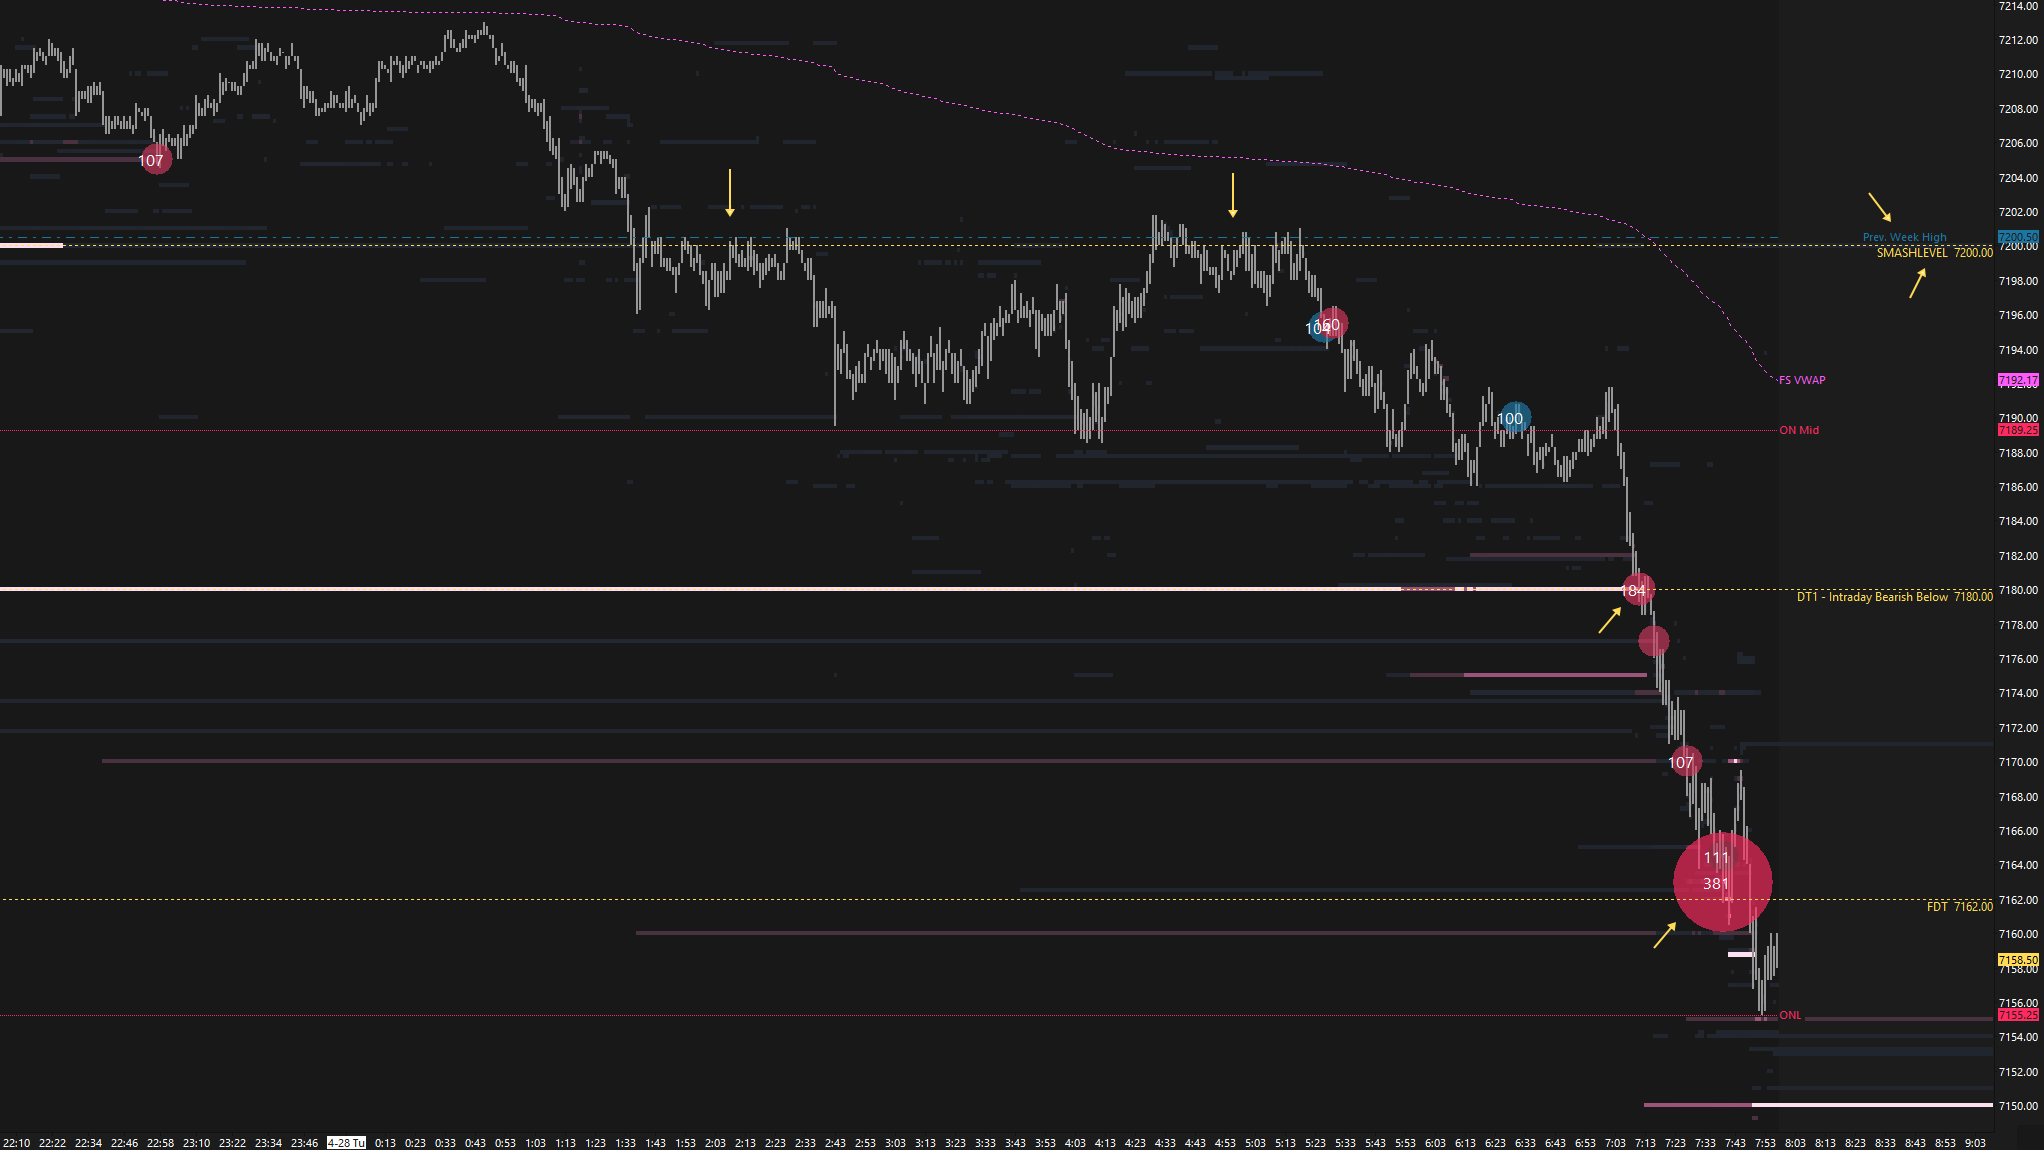
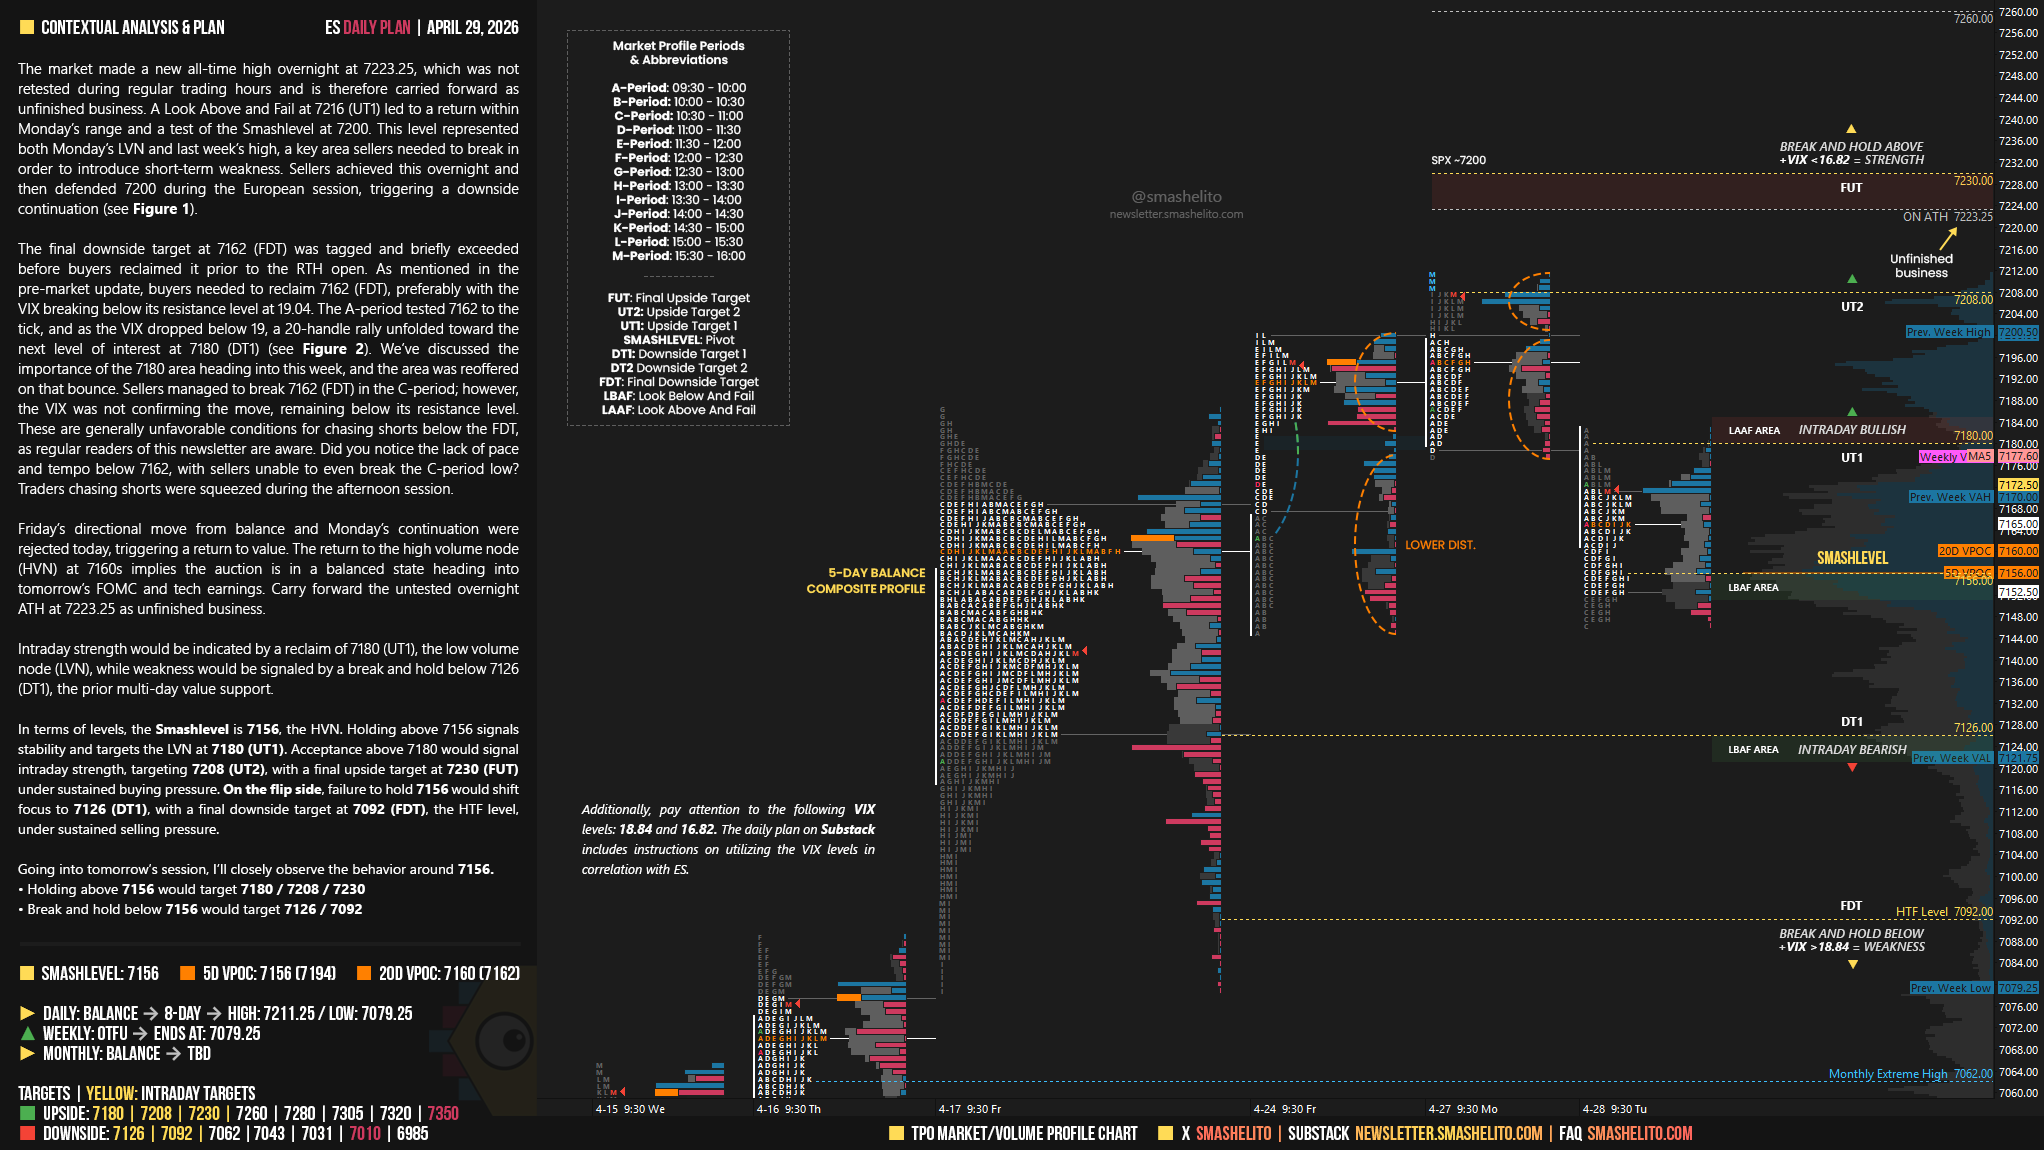
The market made a new all-time high overnight at 7223.25, which was not retested during regular trading hours and is therefore carried forward as unfinished business. A Look Above and Fail at 7216 (UT1) led to a return within Monday’s range and a test of the Smashlevel at 7200. This level represented both Monday’s LVN and last week’s high, a key area sellers needed to break in order to introduce short-term weakness. Sellers achieved this overnight and then defended 7200 during the European session, triggering a downside continuation (see Figure 1).
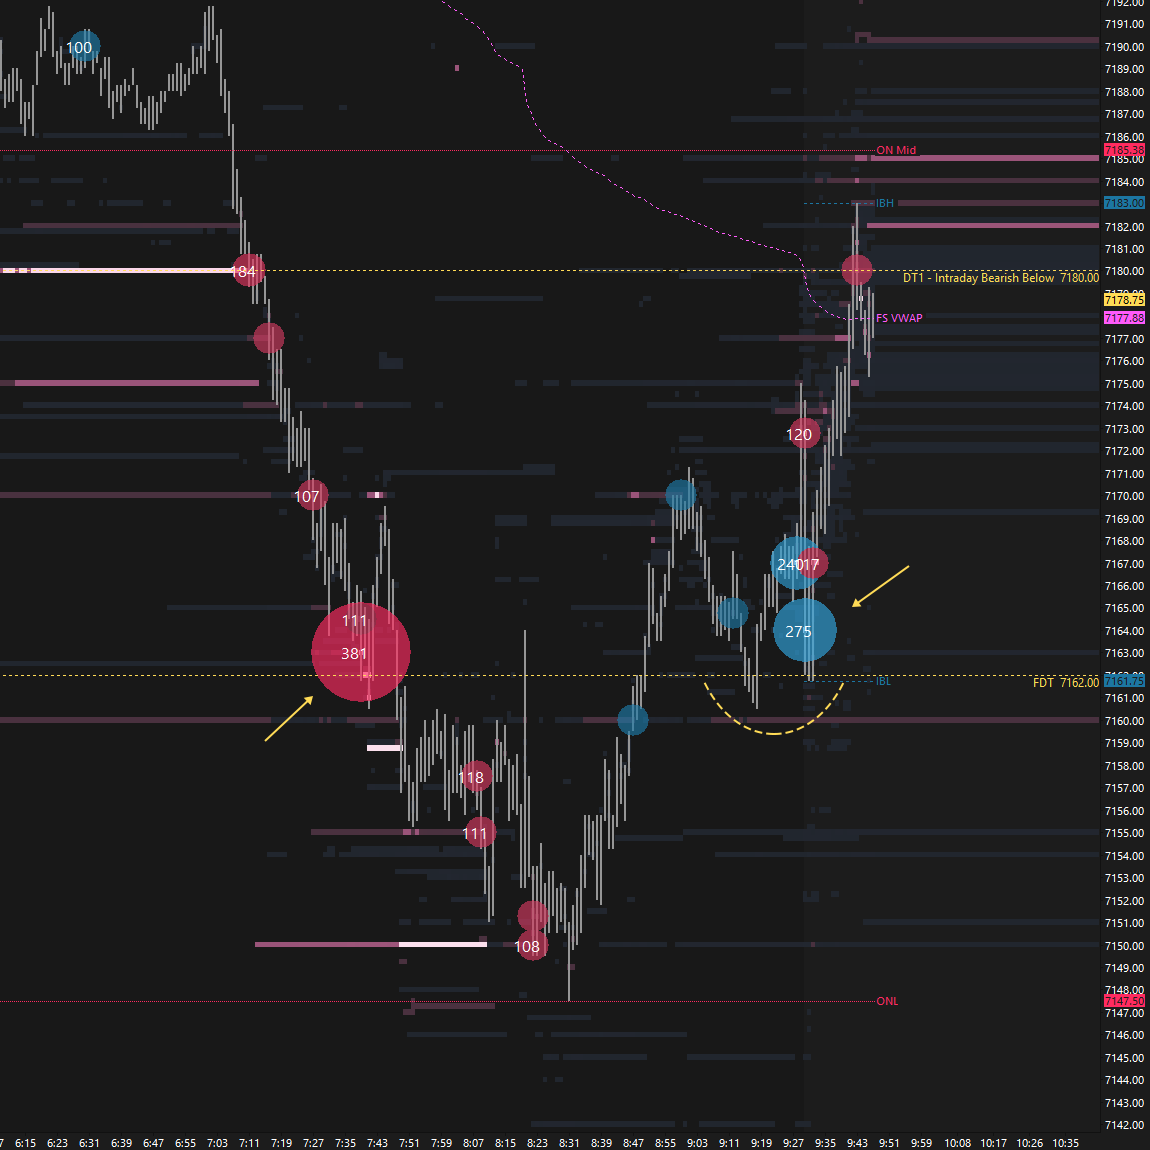
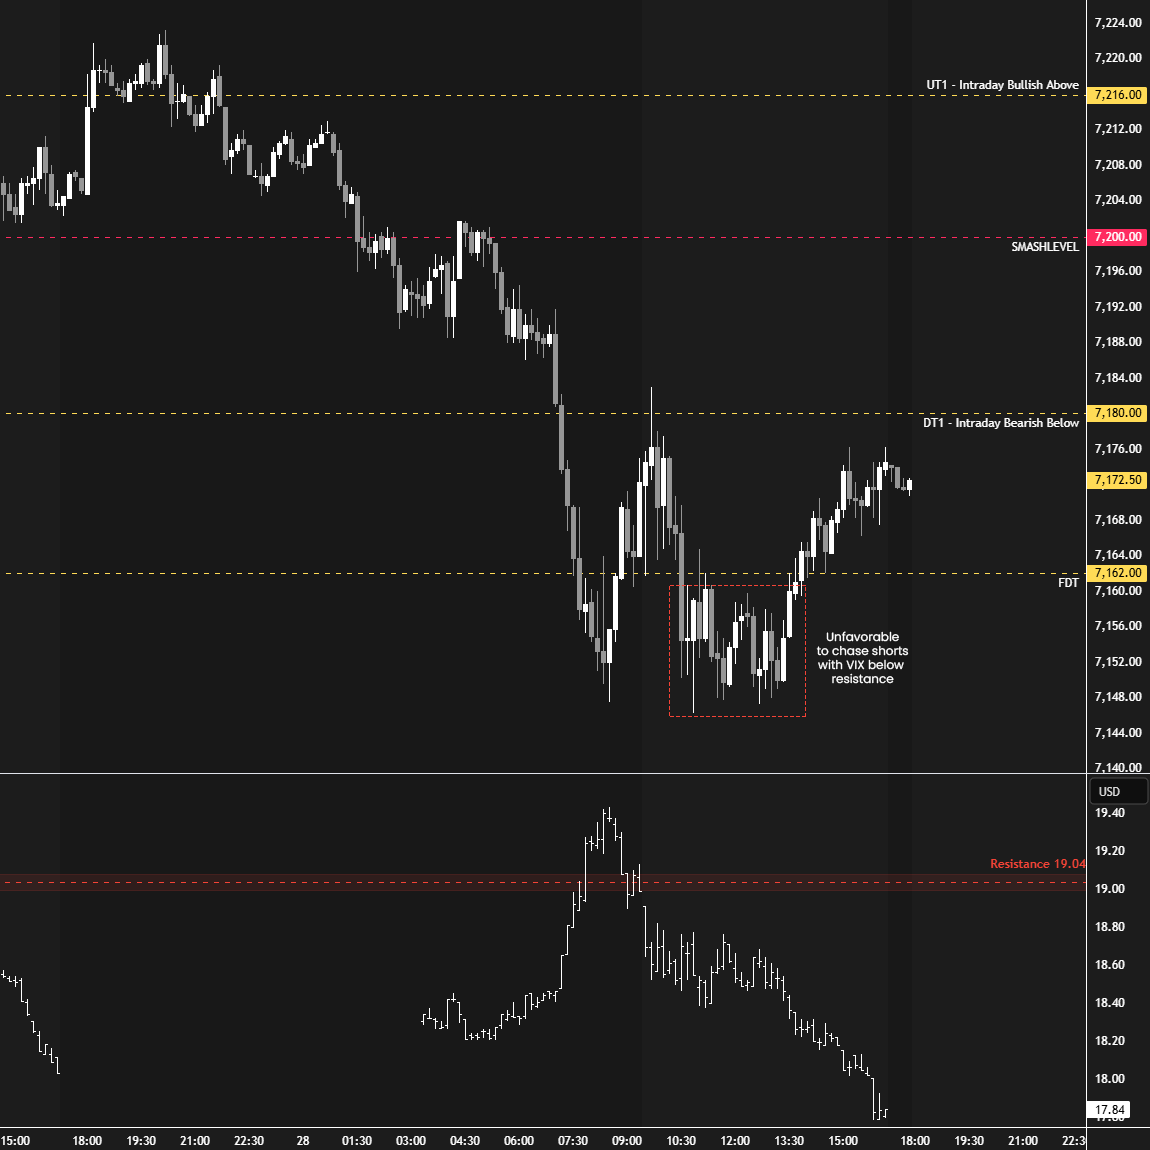
The final downside target at 7162 (FDT) was tagged and briefly exceeded before buyers reclaimed it prior to the RTH open. As mentioned in the pre-market update, buyers needed to reclaim 7162 (FDT), preferably with the VIX breaking below its resistance level at 19.04. The A-period tested 7162 to the tick, and as the VIX dropped below 19, a 20-handle rally unfolded toward the next level of interest at 7180 (DT1) (see Figure 2). We’ve discussed the importance of the 7180 area heading into this week, and the area was reoffered on that bounce. Sellers managed to break 7162 (FDT) in the C-period; however, the VIX was not confirming the move, remaining below its resistance level. These are generally unfavorable conditions for chasing shorts below the FDT, as regular readers of this newsletter are aware. Did you notice the lack of pace and tempo below 7162, with sellers unable to even break the C-period low? Traders chasing shorts were squeezed during the afternoon session.
Smashlevels Recap
Friday’s directional move from balance and Monday’s continuation were rejected today, triggering a return to value. The return to the high volume node (HVN) at 7160s implies the auction is in a balanced state heading into tomorrow’s FOMC and tech earnings. Carry forward the untested overnight ATH at 7223.25 as unfinished business.
Intraday strength would be indicated by a reclaim of 7180 (UT1), the low volume node (LVN), while weakness would be signaled by a break and hold below 7126 (DT1), the prior multi-day value support.
In terms of levels, the Smashlevel is 7156, the HVN. Holding above 7156 signals stability and targets the LVN at 7180 (UT1). Acceptance above 7180 would signal intraday strength, targeting 7208 (UT2), with a final upside target at 7230 (FUT) under sustained buying pressure.
On the flip side, failure to hold 7156 would shift focus to 7126 (DT1), with a final downside target at 7092 (FDT), the HTF level, under sustained selling pressure.
Visual Representation
Levels of Interest
Going into tomorrow’s session, I’ll closely observe the behavior around 7156.
Holding above 7156 would target 7180 / 7208 / 7230
Break and hold below 7156 would target 7126 / 7092
Additionally, pay attention to the following VIX levels: 18.84 and 16.82. These levels can provide confirmation of strength or weakness.
Break and hold above 7230 with VIX below 16.82 would confirm strength.
Break and hold below 7092 with VIX above 18.84 would confirm weakness.
Overall, it's important to exercise caution when trading outside of the highlighted yellow levels. A non-cooperative VIX may suggest possible reversals i.e trade setups.
The Short worked great as a scalp from 12:25 PM ET till 12:34 PM, as VIX went above 18.84 and ES went below 7156, local low was 7142... looking to see if the Short Thesis will keep playing out till the FOMC craziness in about 1 hour 17 minutes...
Thanks Smash, have a great session!