
ES Daily Plan | April 27, 2026
Market Context & Key Levels for the Day Ahead

— For new subscribers
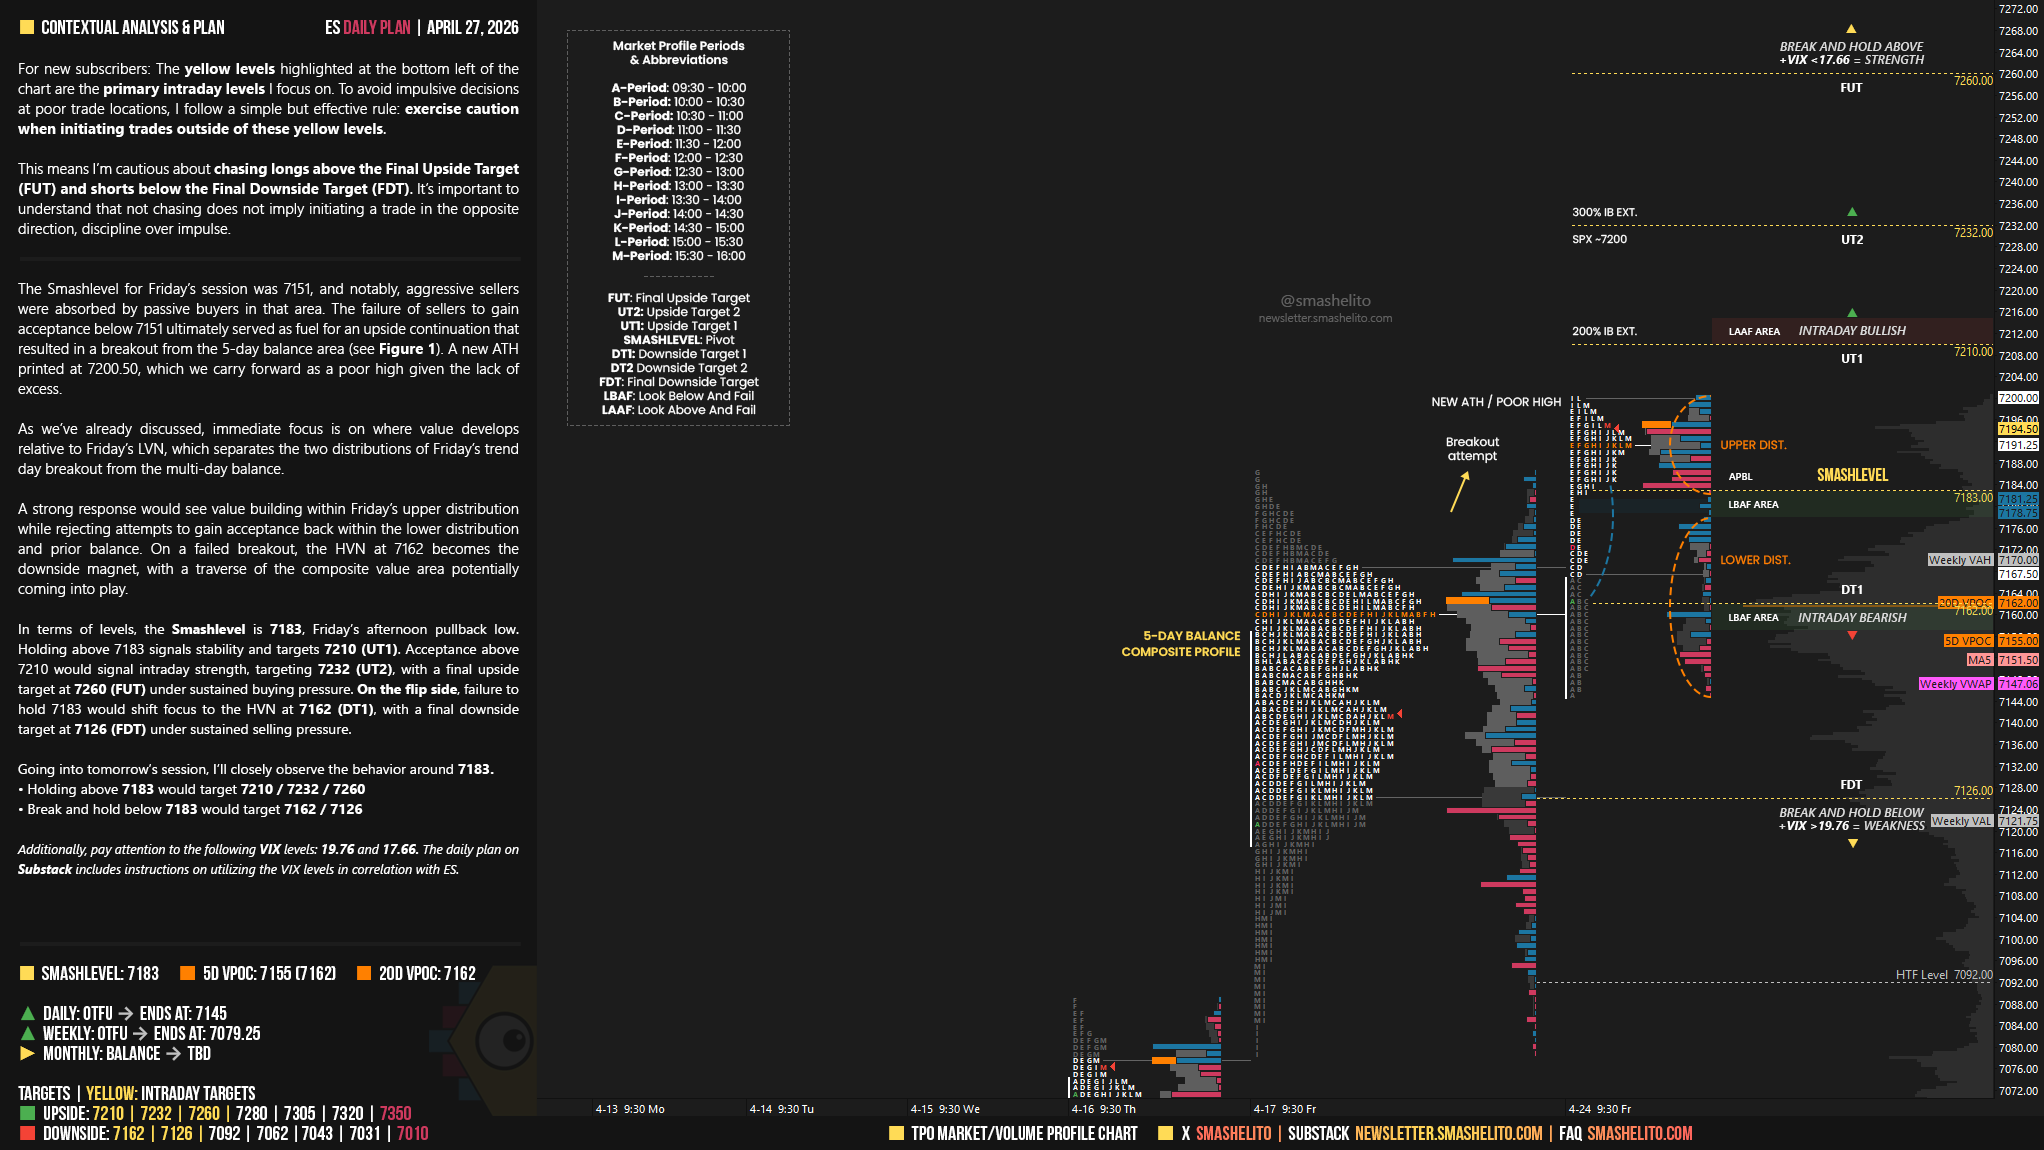
The yellow levels highlighted at the bottom left of the chart are the primary intraday levels I focus on. To avoid impulsive decisions at poor trade locations, I follow a simple but effective rule: exercise caution when initiating trades outside of these yellow levels.
This means I’m cautious about chasing longs above the Final Upside Target (FUT) and shorts below the Final Downside Target (FDT). It’s important to understand that not chasing does not imply initiating a trade in the opposite direction, discipline over impulse.
Be sure to review the Weekly Plan for a broader perspective, key levels, and market expectations for the week ahead.

Contextual Analysis & Plan
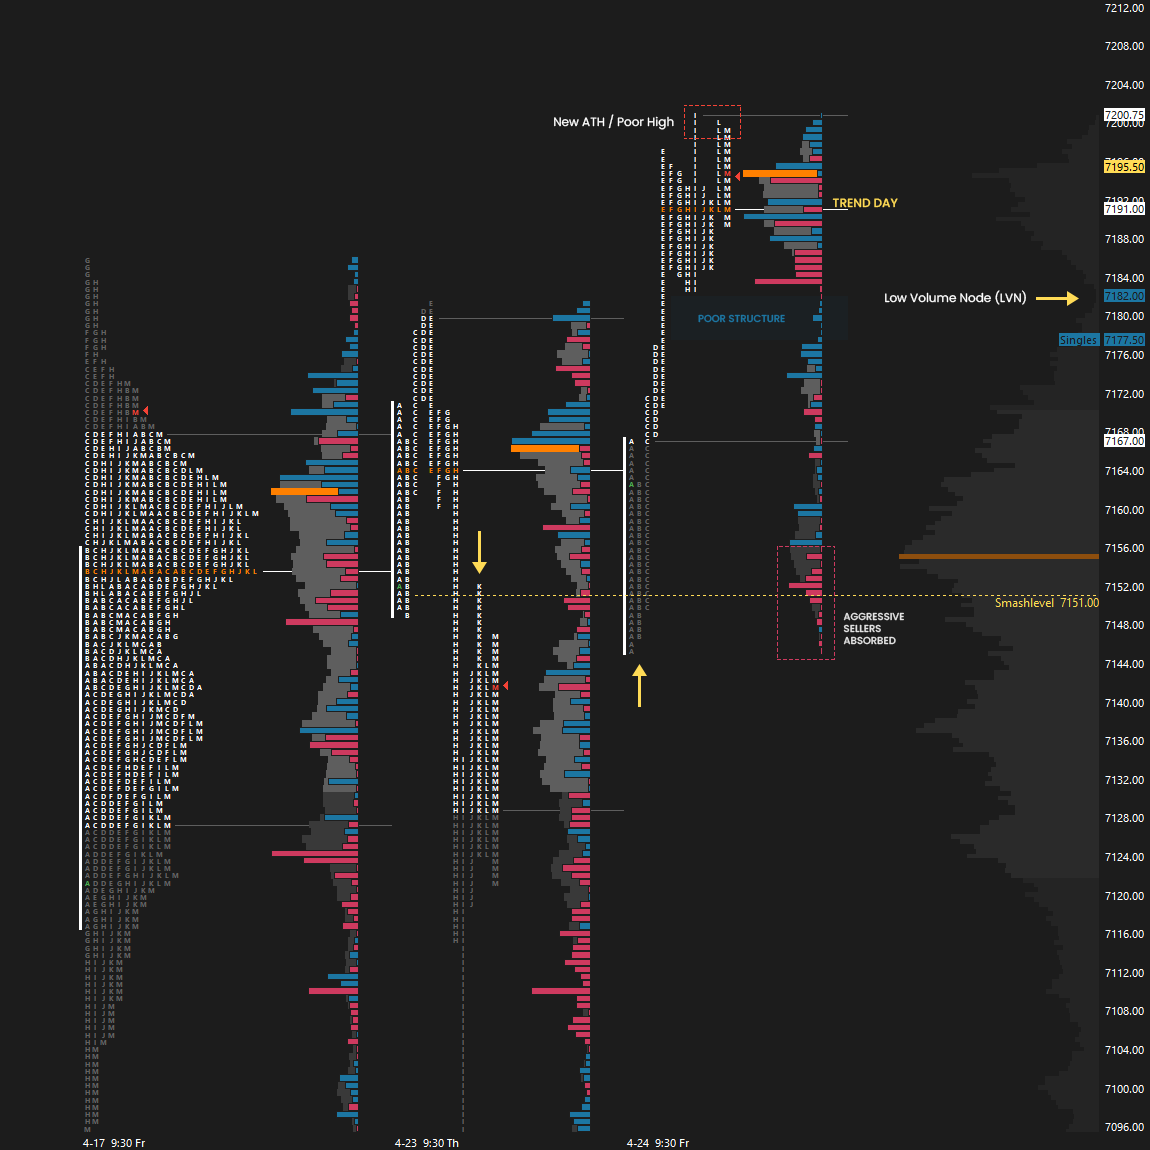
The Smashlevel for Friday’s session was 7151, and notably, aggressive sellers were absorbed by passive buyers in that area. The failure of sellers to gain acceptance below 7151 ultimately served as fuel for an upside continuation that resulted in a breakout from the 5-day balance area (see Figure 1). A new ATH printed at 7200.50, which we carry forward as a poor high given the lack of excess.
Smashlevels Recap
As we’ve already discussed, immediate focus is on where value develops relative to Friday’s LVN, which separates the two distributions of Friday’s trend day breakout from the multi-day balance.
A strong response would see value building within Friday’s upper distribution while rejecting attempts to gain acceptance back within the lower distribution and prior balance.
On a failed breakout, the HVN at 7162 becomes the downside magnet, with a traverse of the composite value area potentially coming into play.
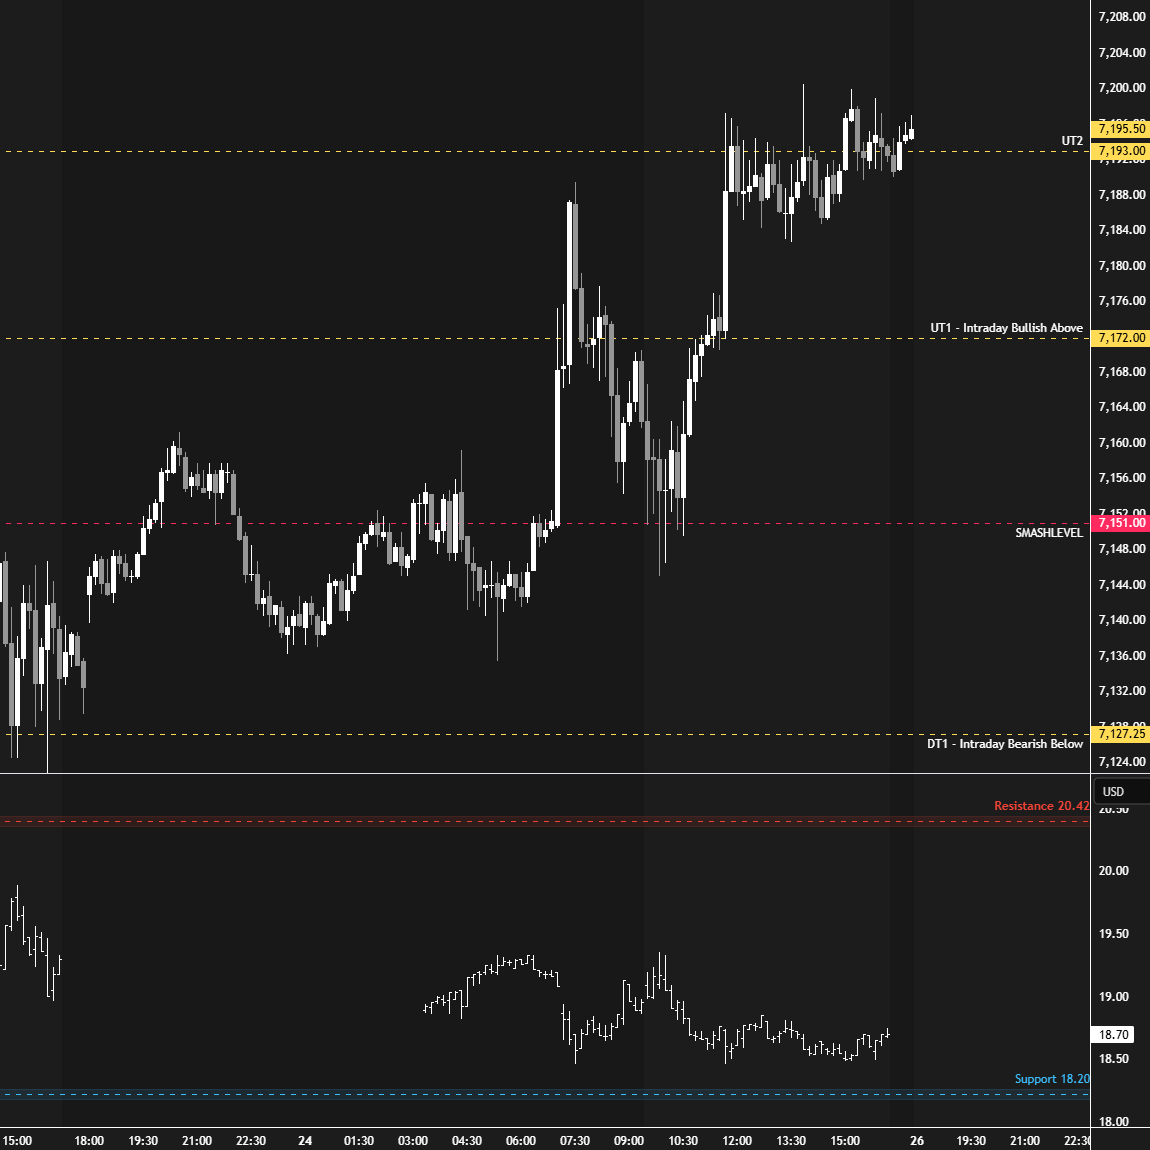
In terms of levels, the Smashlevel is 7183, Friday’s afternoon pullback low. Holding above 7183 signals stability and targets 7210 (UT1). Acceptance above 7210 would signal intraday strength, targeting 7232 (UT2), with a final upside target at 7260 (FUT) under sustained buying pressure.
On the flip side, failure to hold 7183 would shift focus to the HVN at 7162 (DT1), with a final downside target at 7126 (FDT) under sustained selling pressure.
Visual Representation
Levels of Interest
Going into tomorrow’s session, I’ll closely observe the behavior around 7183.
Holding above 7183 would target 7210 / 7232 / 7260
Break and hold below 7183 would target 7162 / 7126
Additionally, pay attention to the following VIX levels: 19.76 and 17.66. These levels can provide confirmation of strength or weakness.
Break and hold above 7260 with VIX below 17.66 would confirm strength.
Break and hold below 7126 with VIX above 19.76 would confirm weakness.
Overall, it's important to exercise caution when trading outside of the highlighted yellow levels. A non-cooperative VIX may suggest possible reversals i.e trade setups.
Have a great session, thanks for everything
Thanks Smash!