
ES Daily Plan | April 25, 2025
Key Levels & Market Context for the Upcoming Session.

For new followers: The yellow levels highlighted at the bottom left of the chart are the primary levels that I focus on intraday. My strategy for preventing impulsive decisions at unfavorable locations involves following a simple yet effective rule of exercising caution when initiating trades outside of the yellow levels. This implies that I am cautious chasing longs above the final yellow upside target and shorts below the final yellow downside target. It is crucial to understand that refraining from chasing a trade is not an automatic invitation to initiate a trade in the opposite direction.
Make sure to review the Weekly Plan, which provides a broader perspective and highlights key levels of interest to observe in the upcoming week.

Visual Representation
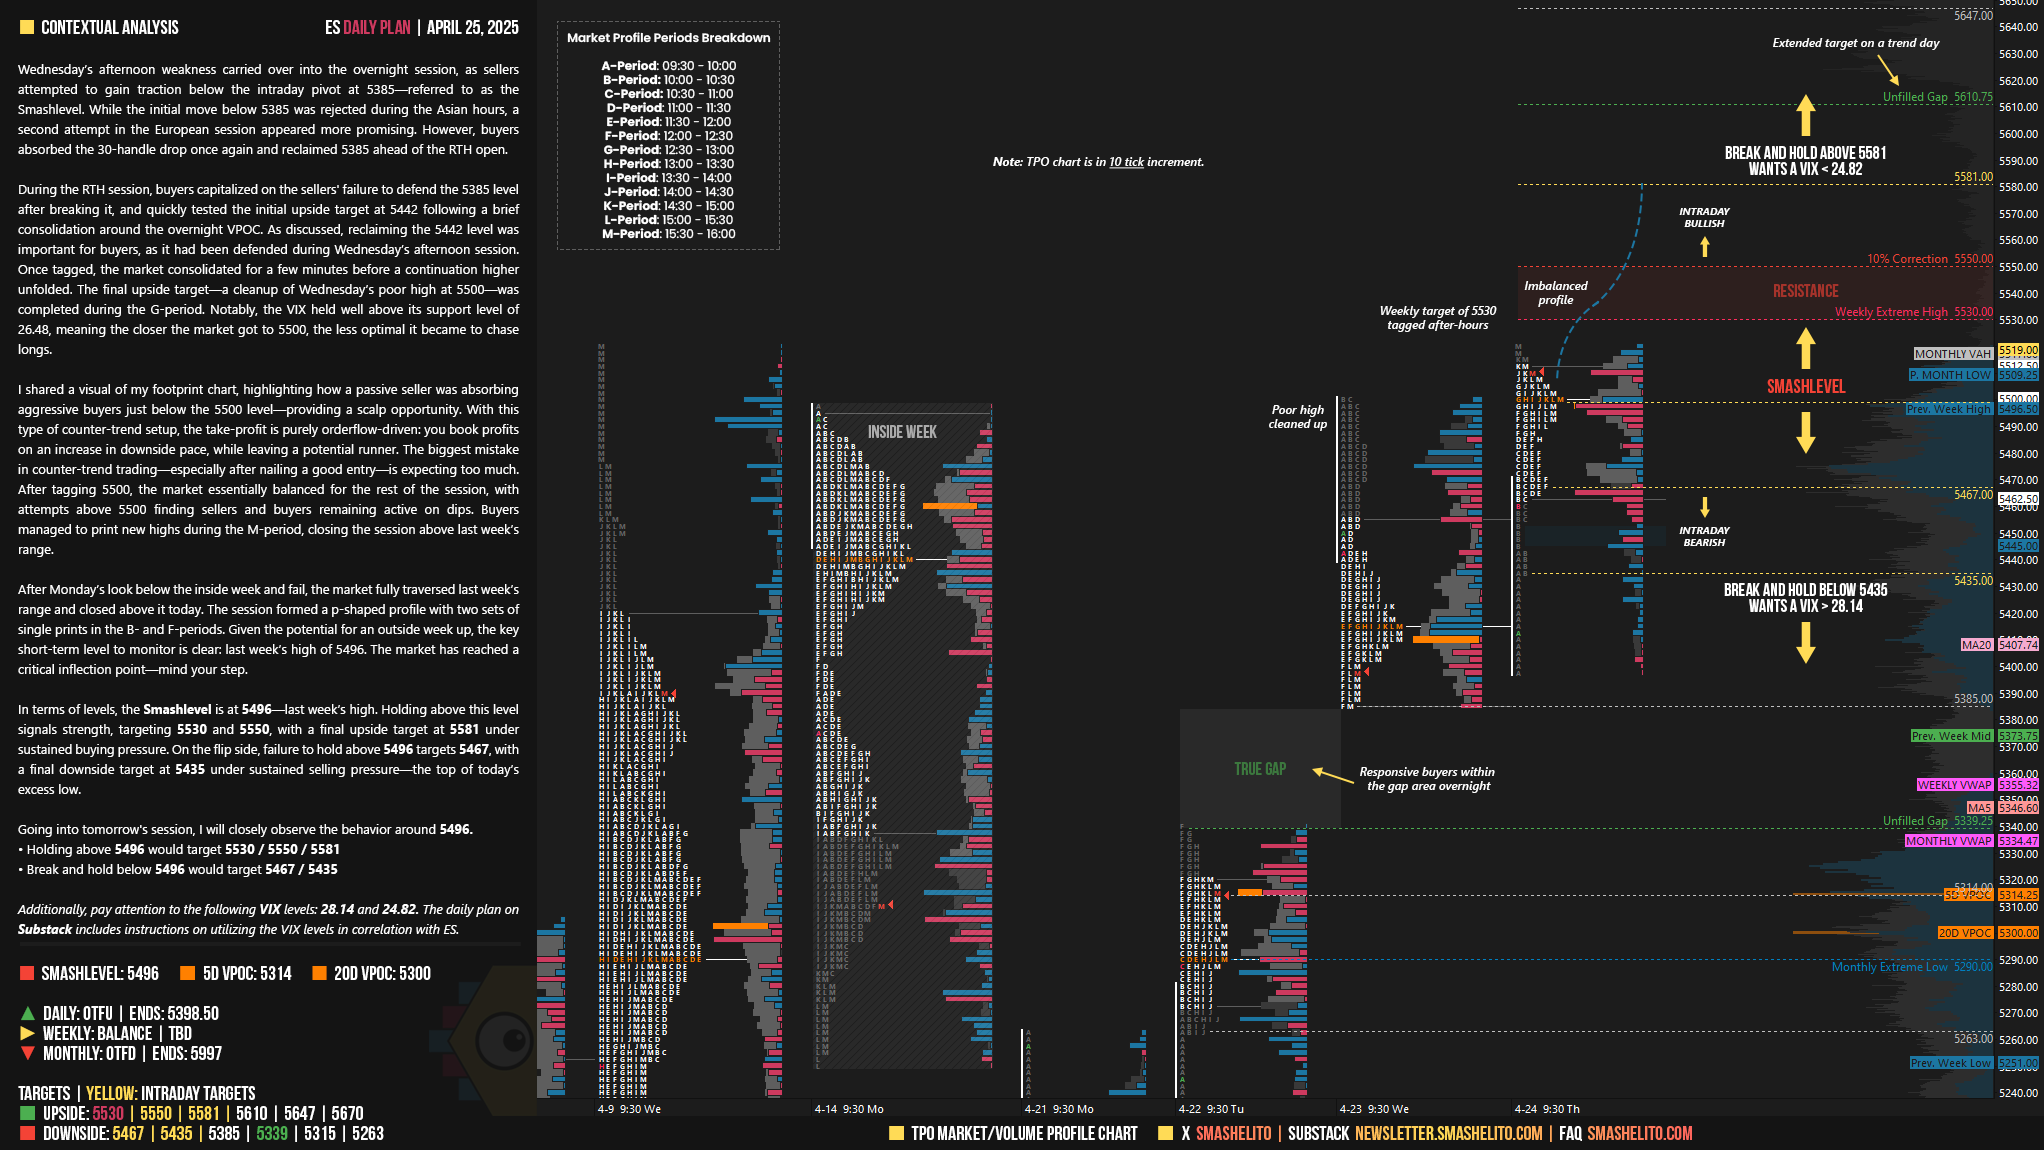
Contextual Analysis
Wednesday’s afternoon weakness carried over into the overnight session, as sellers attempted to gain traction below the intraday pivot at 5385—referred to as the Smashlevel. While the initial move below 5385 was rejected during the Asian hours, a second attempt in the European session appeared more promising. However, buyers absorbed the 30-handle drop once again and reclaimed 5385 ahead of the RTH open.
During the RTH session, buyers capitalized on the sellers' failure to defend the 5385 level after breaking it, and quickly tested the initial upside target at 5442 following a brief consolidation around the overnight VPOC. As discussed, reclaiming the 5442 level was important for buyers, as it had been defended during Wednesday’s afternoon session. Once tagged, the market consolidated for a few minutes before a continuation higher unfolded. The final upside target—a cleanup of Wednesday’s poor high at 5500—was completed during the G-period. Notably, the VIX held well above its support level of 26.48, meaning the closer the market got to 5500, the less optimal it became to chase longs.
I shared a visual of my footprint chart, highlighting how a passive seller was absorbing aggressive buyers just below the 5500 level—providing a scalp opportunity. With this type of counter-trend setup, the take-profit is purely orderflow-driven: you book profits on an increase in downside pace, while leaving a potential runner. The biggest mistake in counter-trend trading—especially after nailing a good entry—is expecting too much. After tagging 5500, the market essentially balanced for the rest of the session, with attempts above 5500 finding sellers and buyers remaining active on dips. Buyers managed to print new highs during the M-period, closing the session above last week’s range.

After Monday’s look below the inside week and fail, the market fully traversed last week’s range and closed above it today. The session formed a p-shaped profile with two sets of single prints in the B- and F-periods. Given the potential for an outside week up, the key short-term level to monitor is clear: last week’s high of 5496. The market has reached a critical inflection point—mind your step.

In terms of levels, the Smashlevel is at 5496—last week’s high. Holding above this level signals strength, targeting 5530 and 5550, with a final upside target at 5581 under sustained buying pressure. On the flip side, failure to hold above 5496 targets 5467, with a final downside target at 5435 under sustained selling pressure—the top of today’s excess low.
Levels of Interest
Going into tomorrow's session, I will closely observe the behavior around 5496.
Holding above 5496 would target 5530 / 5550 / 5581
Break and hold below 5496 would target 5467 / 5435
Additionally, pay attention to the following VIX levels: 28.14 and 24.82. These levels can provide confirmation of strength or weakness.
Break and hold above 5581 with VIX below 24.82 would confirm strength.
Break and hold below 5435 with VIX above 28.14 would confirm weakness.
Overall, it's important to exercise caution when trading outside of the highlighted yellow levels. A non-cooperative VIX may suggest possible reversals i.e trade setups.
Hi, your work is always very useful. Thanks for that. The second target is ment to be 5550? "Holding above 5496 would target 5530 / 5500 / 5581"
Hi Smash, I was looking at the gap between 4/2 LOD in A period at 5611 and the 4/3 HOD in A period at 5540.50. There was some weird post-close and globex open actio on 4/2 such that there is a "gap" between 5567.50 and 5565.25. Is there any marginal value in noting this particular "gap", or does it just get lost in the sauce in the true gap? Thanks.