
ES Daily Plan | April 23, 2026
Market Context & Key Levels for the Day Ahead

— For new subscribers
The yellow levels highlighted at the bottom left of the chart are the primary intraday levels I focus on. To avoid impulsive decisions at poor trade locations, I follow a simple but effective rule: exercise caution when initiating trades outside of these yellow levels.
This means I’m cautious about chasing longs above the Final Upside Target (FUT) and shorts below the Final Downside Target (FDT). It’s important to understand that not chasing does not imply initiating a trade in the opposite direction, discipline over impulse.
Be sure to review the Weekly Plan for a broader perspective, key levels, and market expectations for the week ahead.

Contextual Analysis & Plan
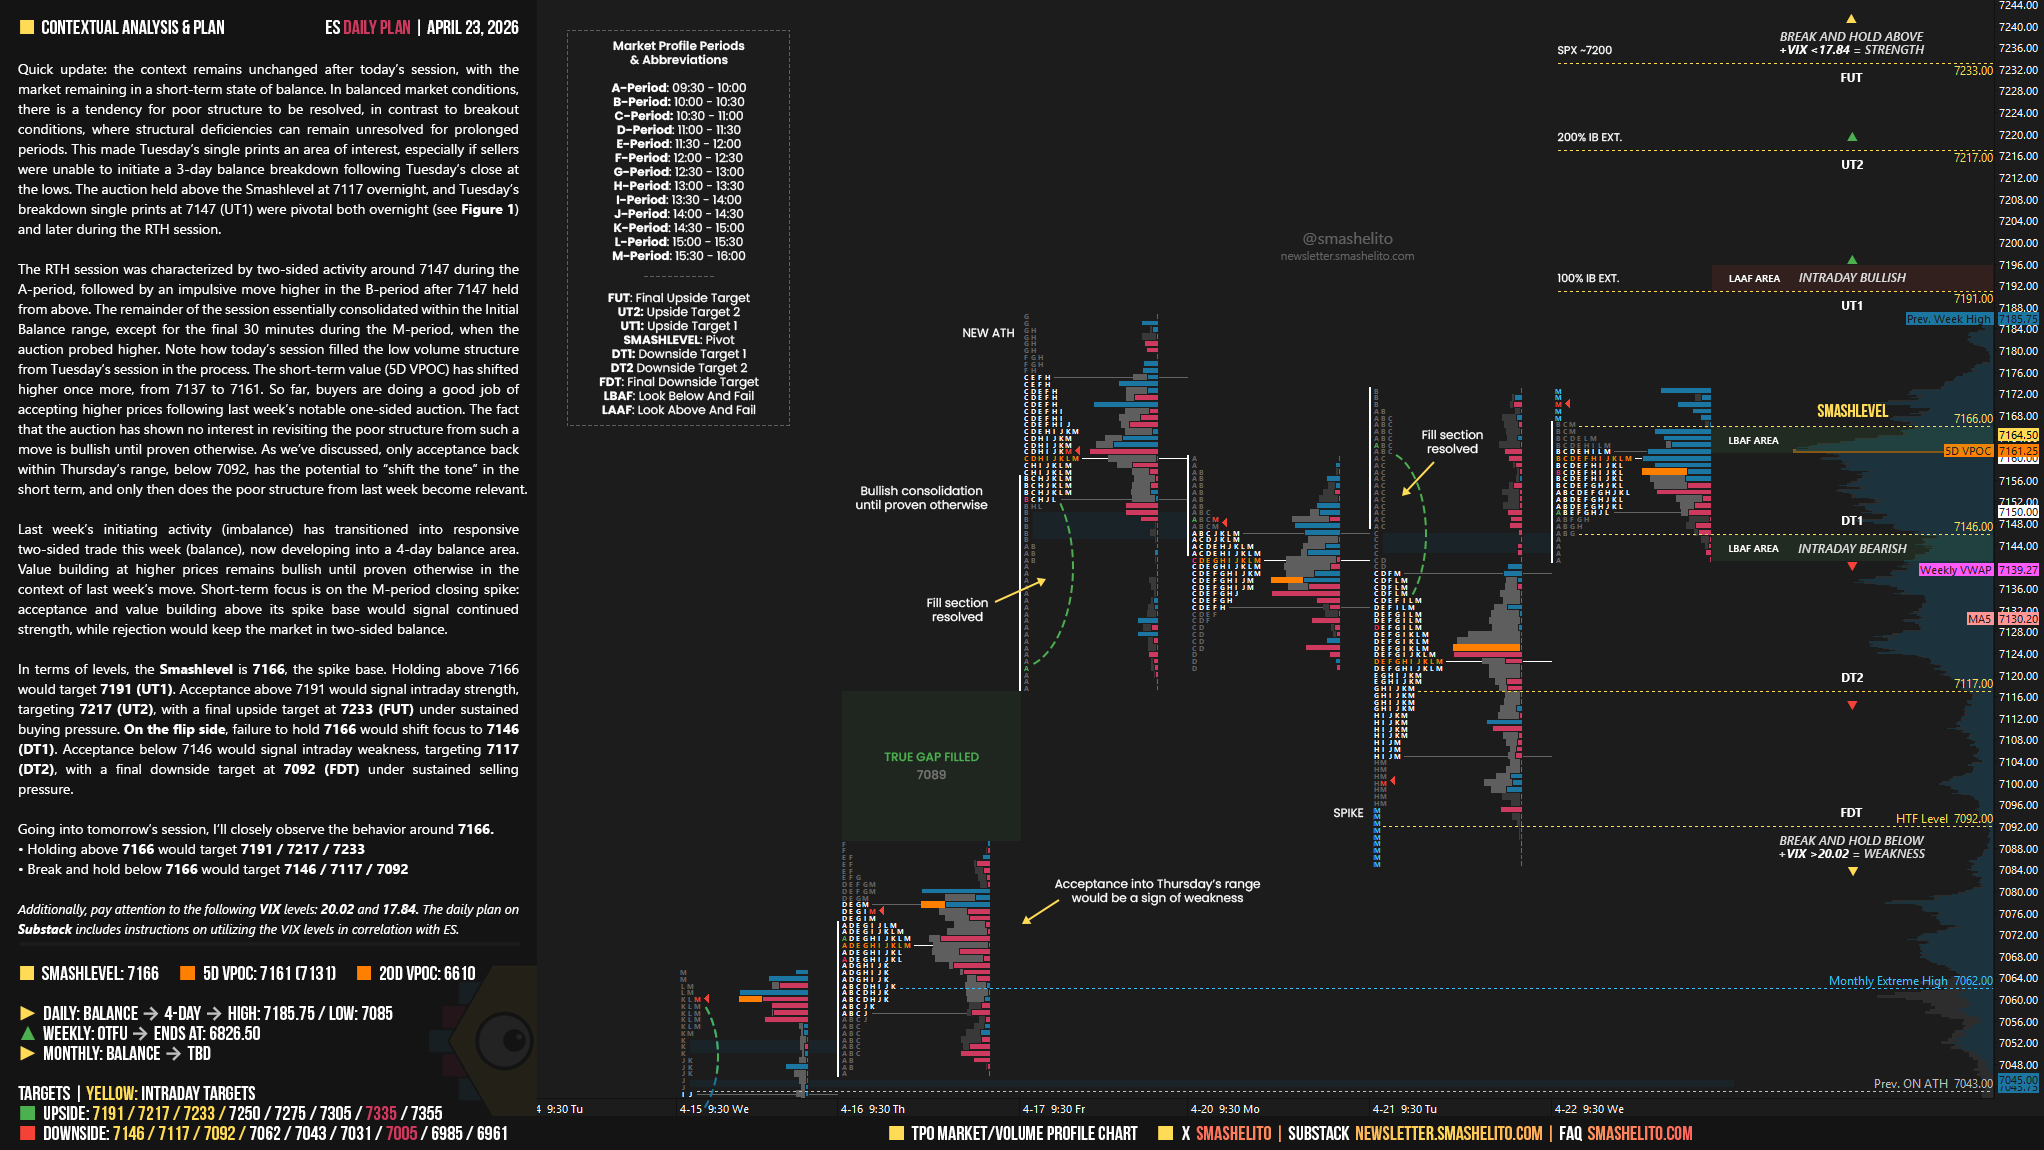
Quick update: the context remains unchanged after today’s session, with the market remaining in a short-term state of balance. In balanced market conditions, there is a tendency for poor structure to be resolved, in contrast to breakout conditions, where structural deficiencies can remain unresolved for prolonged periods. This made Tuesday’s single prints an area of interest, especially if sellers were unable to initiate a 3-day balance breakdown following Tuesday’s close at the lows. The auction held above the Smashlevel at 7117 overnight, and Tuesday’s breakdown single prints at 7147 (UT1) were pivotal both overnight (see Figure 1) and later during the RTH session.
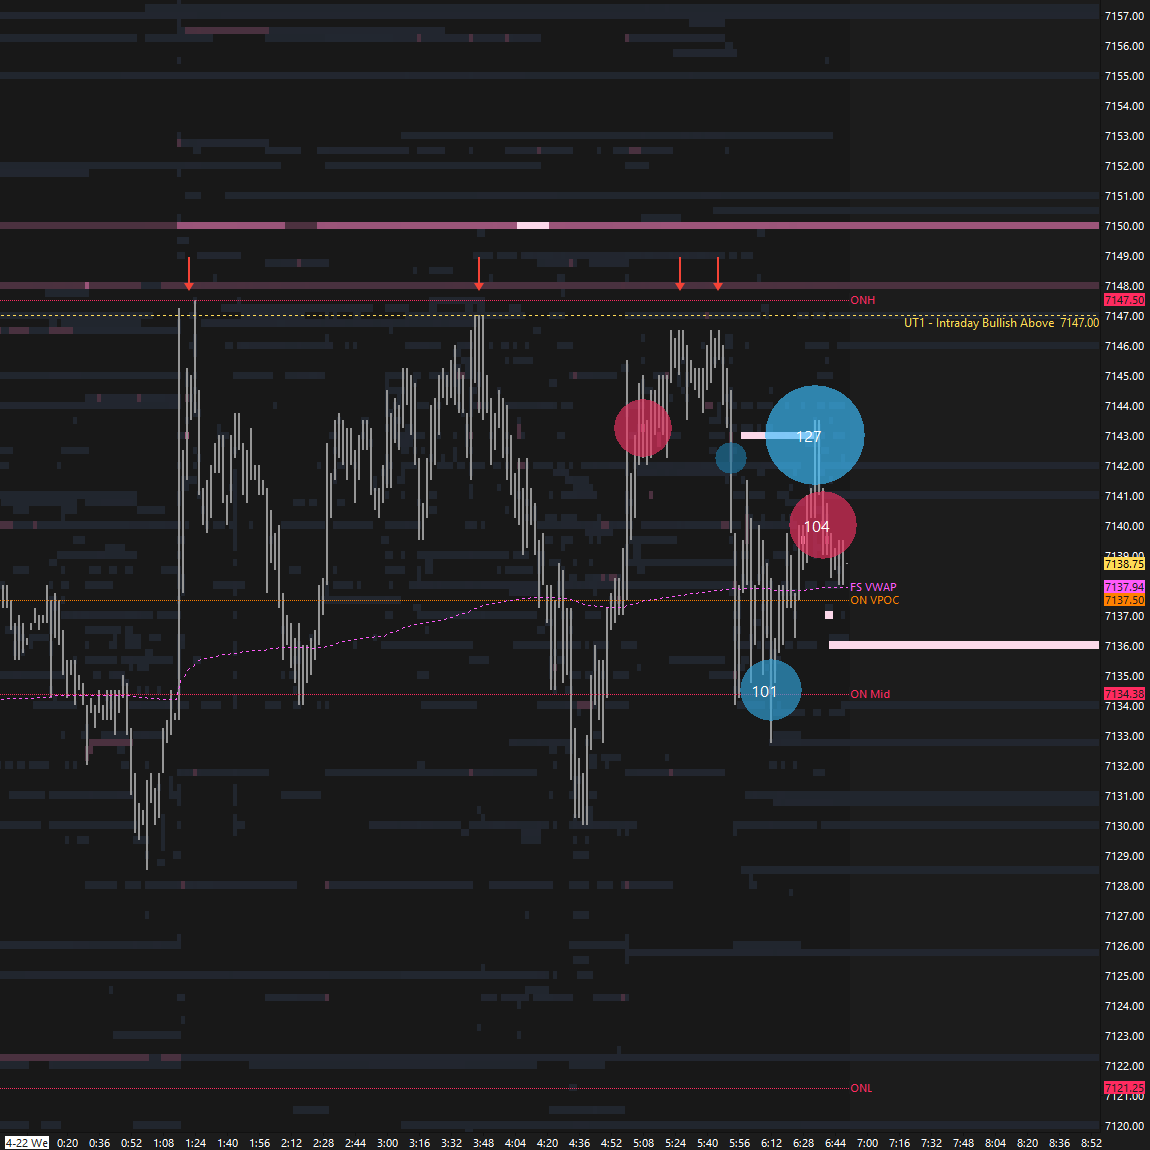
The RTH session was characterized by two-sided activity around 7147 during the A-period, followed by an impulsive move higher in the B-period after 7147 held from above. The remainder of the session essentially consolidated within the Initial Balance range, except for the final 30 minutes during the M-period, when the auction probed higher. Note how today’s session filled the low volume structure from Tuesday’s session in the process. The short-term value (5D VPOC) has shifted higher once more, from 7137 to 7161. So far, buyers are doing a good job of accepting higher prices following last week’s notable one-sided auction. The fact that the auction has shown no interest in revisiting the poor structure from such a move is bullish until proven otherwise. As we’ve discussed, only acceptance back within Thursday’s range, below 7092, has the potential to “shift the tone” in the short term, and only then does the poor structure from last week become relevant.
Smashlevels Recap
Last week’s initiating activity (imbalance) has transitioned into responsive two-sided trade this week (balance), now developing into a 4-day balance area. Value building at higher prices remains bullish until proven otherwise in the context of last week’s move.
Short-term focus is on the M-period closing spike: acceptance and value building above its spike base would signal continued strength, while rejection would keep the market in two-sided balance.
In terms of levels, the Smashlevel is 7166, the spike base. Holding above 7166 would target 7191 (UT1). Acceptance above 7191 would signal intraday strength, targeting 7217 (UT2), with a final upside target at 7233 (FUT) under sustained buying pressure.
On the flip side, failure to hold 7166 would shift focus to 7146 (DT1). Acceptance below 7146 would signal intraday weakness, targeting 7117 (DT2), with a final downside target at 7092 (FDT) under sustained selling pressure.
Visual Representation
Levels of Interest
Going into tomorrow’s session, I’ll closely observe the behavior around 7166.
Holding above 7166 would target 7191 / 7217 / 7233
Break and hold below 7166 would target 7146 / 7117 / 7092
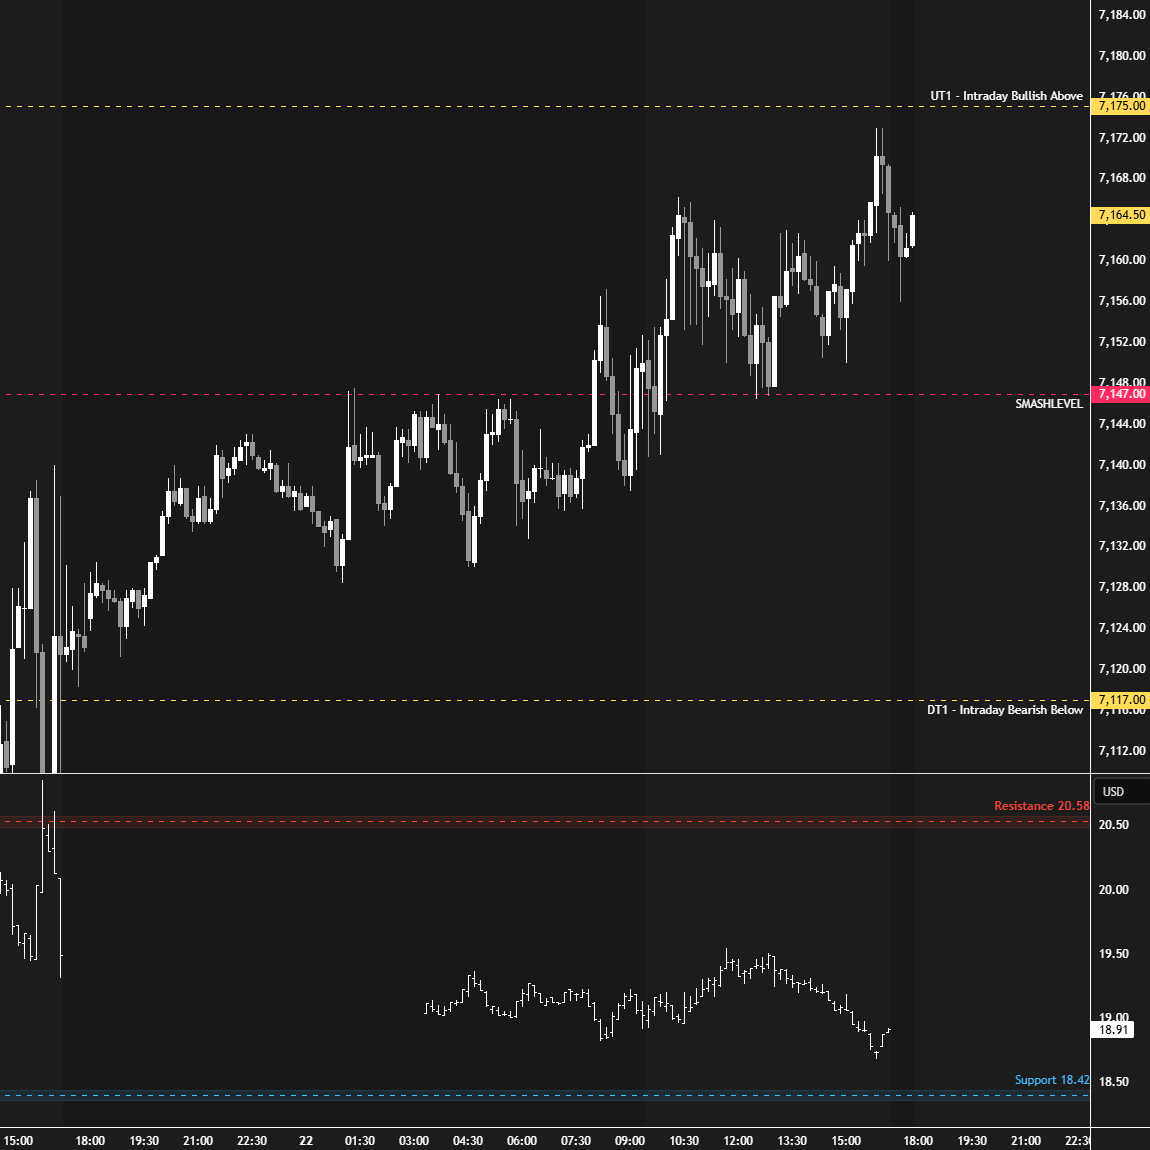
Additionally, pay attention to the following VIX levels: 20.02 and 17.84. These levels can provide confirmation of strength or weakness.
Break and hold above 7233 with VIX below 17.84 would confirm strength.
Break and hold below 7092 with VIX above 20.02 would confirm weakness.
Overall, it's important to exercise caution when trading outside of the highlighted yellow levels. A non-cooperative VIX may suggest possible reversals i.e trade setups.
I have admiration and respect for everything you do. I truly appreciate all the unseen work and the quality of each newsletter. Have a great rest of your day and I wish you much success tomorrow.
Thanks Smash! Great as always!