
ES Daily Plan | April 22, 2026
Market Context & Key Levels for the Day Ahead

— For new subscribers
The yellow levels highlighted at the bottom left of the chart are the primary intraday levels I focus on. To avoid impulsive decisions at poor trade locations, I follow a simple but effective rule: exercise caution when initiating trades outside of these yellow levels.
This means I’m cautious about chasing longs above the Final Upside Target (FUT) and shorts below the Final Downside Target (FDT). It’s important to understand that not chasing does not imply initiating a trade in the opposite direction, discipline over impulse.
Be sure to review the Weekly Plan for a broader perspective, key levels, and market expectations for the week ahead.

Contextual Analysis & Plan
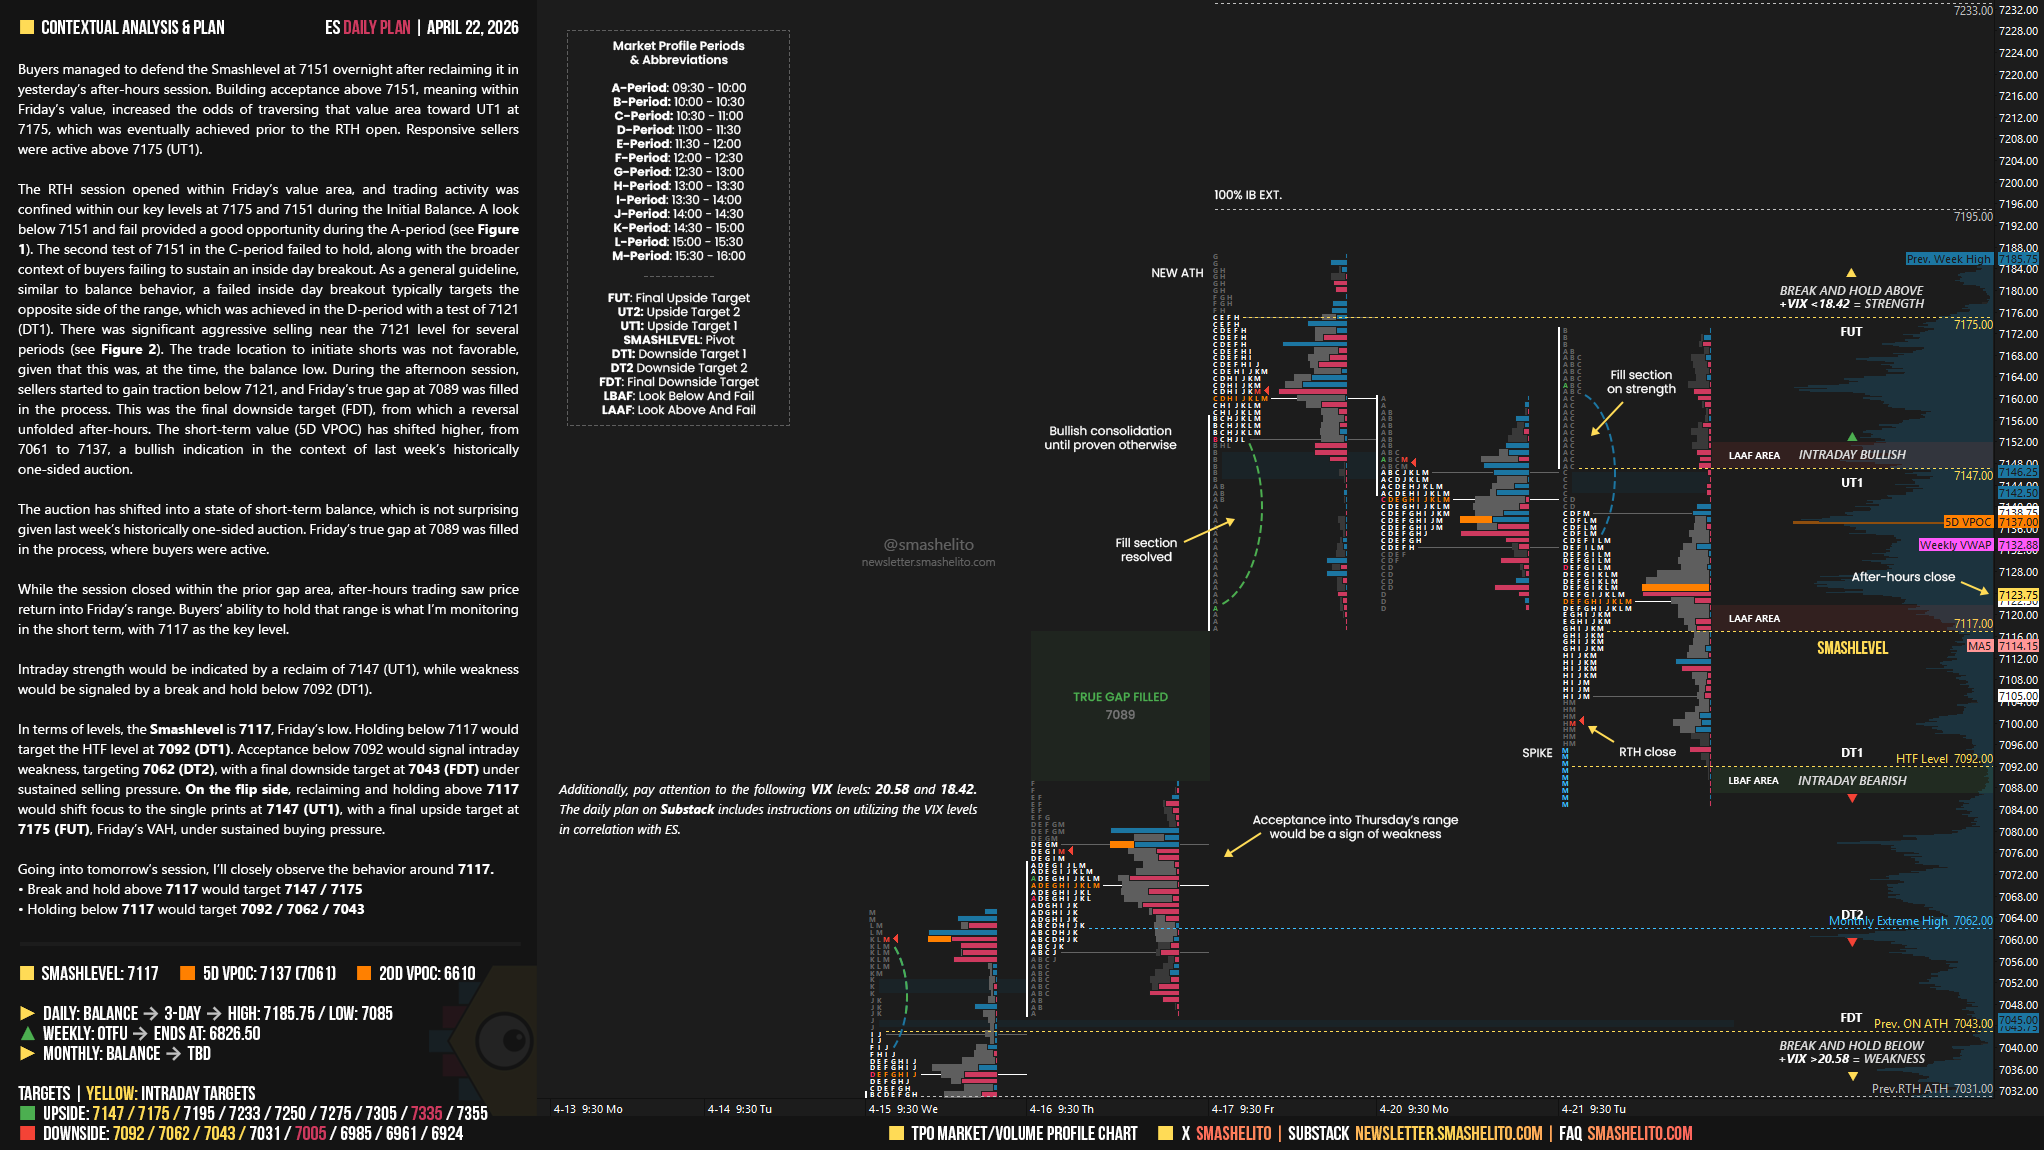
Buyers managed to defend the Smashlevel at 7151 overnight after reclaiming it in yesterday’s after-hours session. Building acceptance above 7151, meaning within Friday’s value, increased the odds of traversing that value area toward UT1 at 7175, which was eventually achieved prior to the RTH open. Responsive sellers were active above 7175 (UT1).
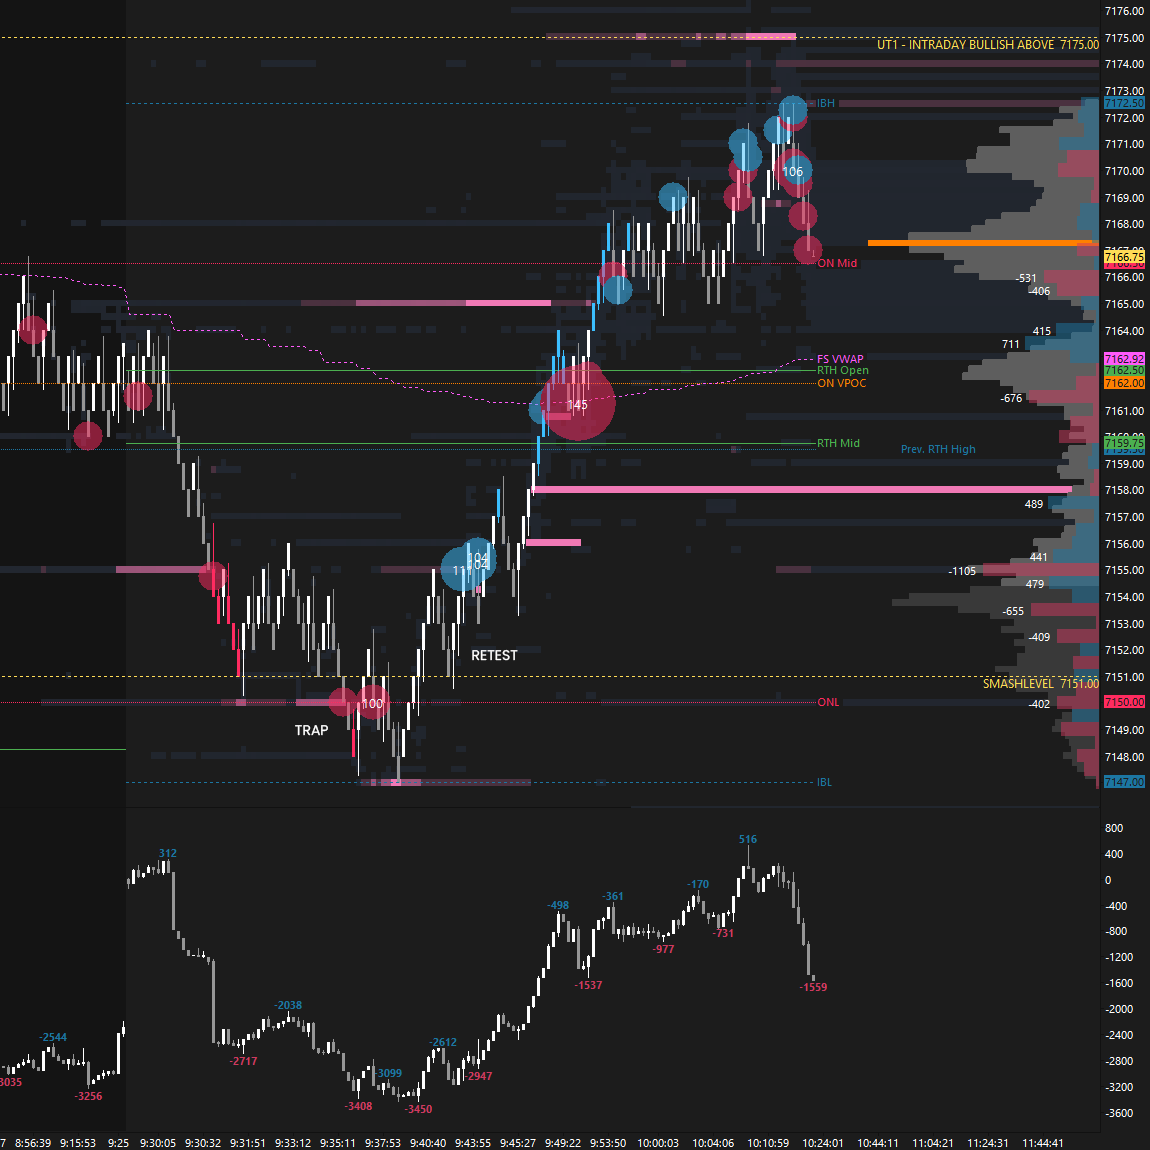
The RTH session opened within Friday’s value area, and trading activity was confined within our key levels at 7175 and 7151 during the Initial Balance. A look below 7151 and fail provided a good opportunity during the A-period (see Figure 1). The second test of 7151 in the C-period failed to hold, along with the broader context of buyers failing to sustain an inside day breakout. As a general guideline, similar to balance behavior, a failed inside day breakout typically targets the opposite side of the range, which was achieved in the D-period with a test of 7121 (DT1).
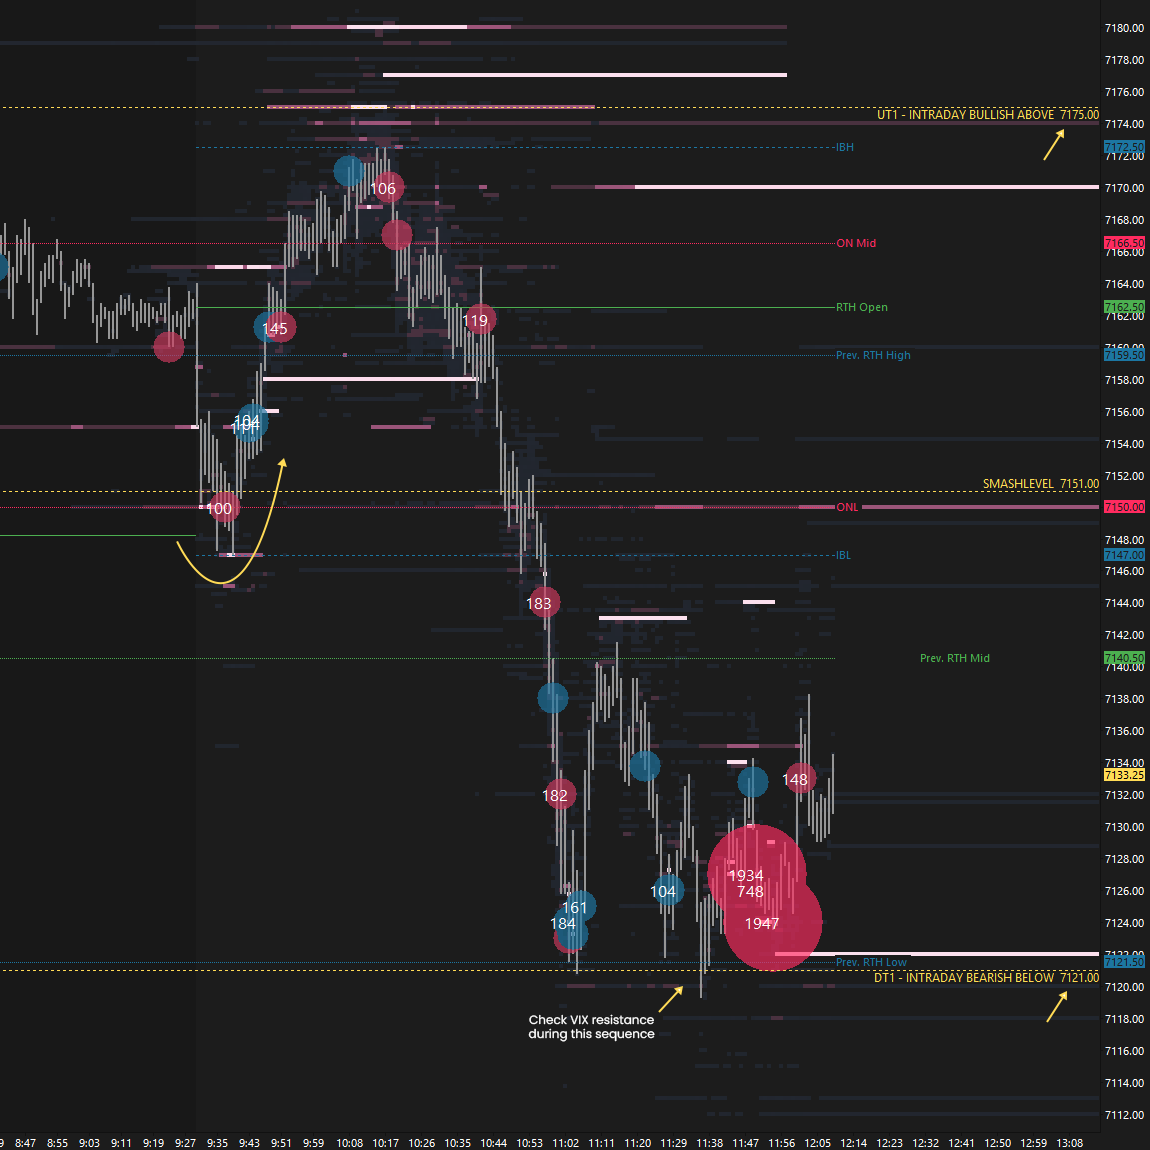
There was significant aggressive selling near the 7121 level for several periods (see Figure 2). The trade location to initiate shorts was not favorable, given that this was, at the time, the balance low. During the afternoon session, sellers started to gain traction below 7121, and Friday’s true gap at 7089 was filled in the process. This was the final downside target (FDT), from which a reversal unfolded after-hours. The short-term value (5D VPOC) has shifted higher, from 7061 to 7137, a bullish indication in the context of last week’s historically one-sided auction.
Smashlevels Recap
The auction has shifted into a state of short-term balance, which is not surprising given last week’s historically one-sided auction. Friday’s true gap at 7089 was filled in the process, where buyers were active.
While the session closed within the prior gap area, after-hours trading saw price return into Friday’s range. Buyers’ ability to hold that range is what I’m monitoring in the short term, with 7117 as the key level.
Intraday strength would be indicated by a reclaim of 7147 (UT1), while weakness would be signaled by a break and hold below 7092 (DT1).
In terms of levels, the Smashlevel is 7117, Friday’s low. Holding below 7117 would target the HTF level at 7092 (DT1). Acceptance below 7092 would signal intraday weakness, targeting 7062 (DT2), with a final downside target at 7043 (FDT) under sustained selling pressure.
On the flip side, reclaiming and holding above 7117 would shift focus to the single prints at 7147 (UT1), with a final upside target at 7175 (FUT), Friday’s VAH, under sustained buying pressure.
Visual Representation
Levels of Interest
Going into tomorrow’s session, I’ll closely observe the behavior around 7117.
Break and hold above 7117 would target 7147 / 7175
Holding below 7117 would target 7092 / 7062 / 7043
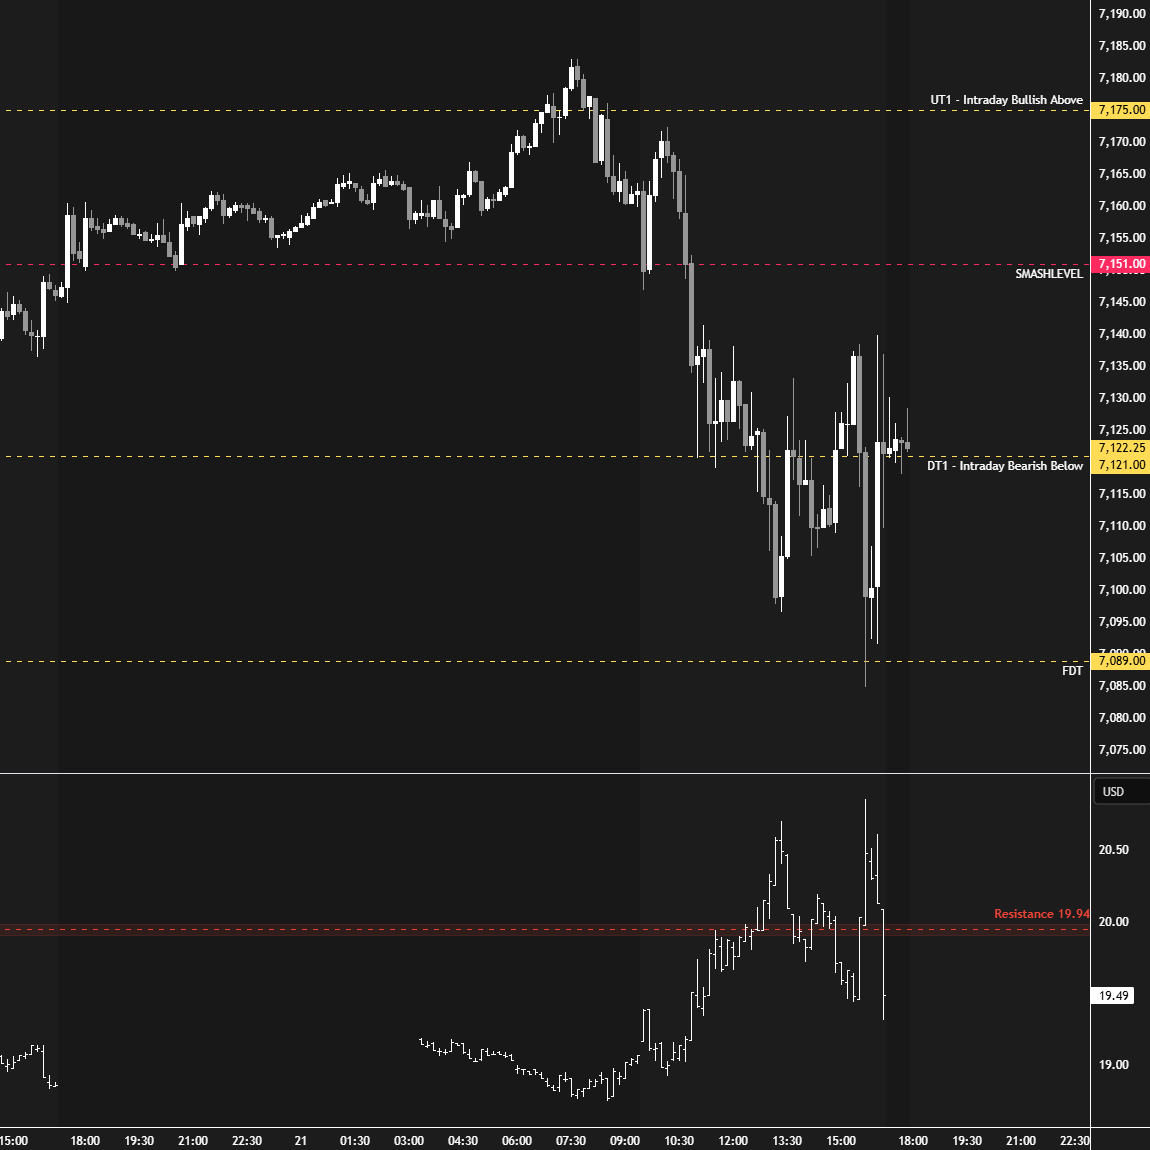
Additionally, pay attention to the following VIX levels: 20.58 and 18.42. These levels can provide confirmation of strength or weakness.
Break and hold above 7175 with VIX below 18.42 would confirm strength.
Break and hold below 7043 with VIX above 20.58 would confirm weakness.
Overall, it's important to exercise caution when trading outside of the highlighted yellow levels. A non-cooperative VIX may suggest possible reversals i.e trade setups.
How can I contact you for more detailed understanding of what constitutes a look and fail and what constitutes a hold?
Thanks for what you do Smashelito. You've really helped me understand the market a bit better day by day....
GRACIAS