
ES Daily Plan | April 22, 2025
Key Levels & Market Context for the Upcoming Session.

For new followers: The yellow levels highlighted at the bottom left of the chart are the primary levels that I focus on intraday. My strategy for preventing impulsive decisions at unfavorable locations involves following a simple yet effective rule of exercising caution when initiating trades outside of the yellow levels. This implies that I am cautious chasing longs above the final yellow upside target and shorts below the final yellow downside target. It is crucial to understand that refraining from chasing a trade is not an automatic invitation to initiate a trade in the opposite direction.
Make sure to review the Weekly Plan, which provides a broader perspective and highlights key levels of interest to observe in the upcoming week.

Visual Representation
Contextual Analysis
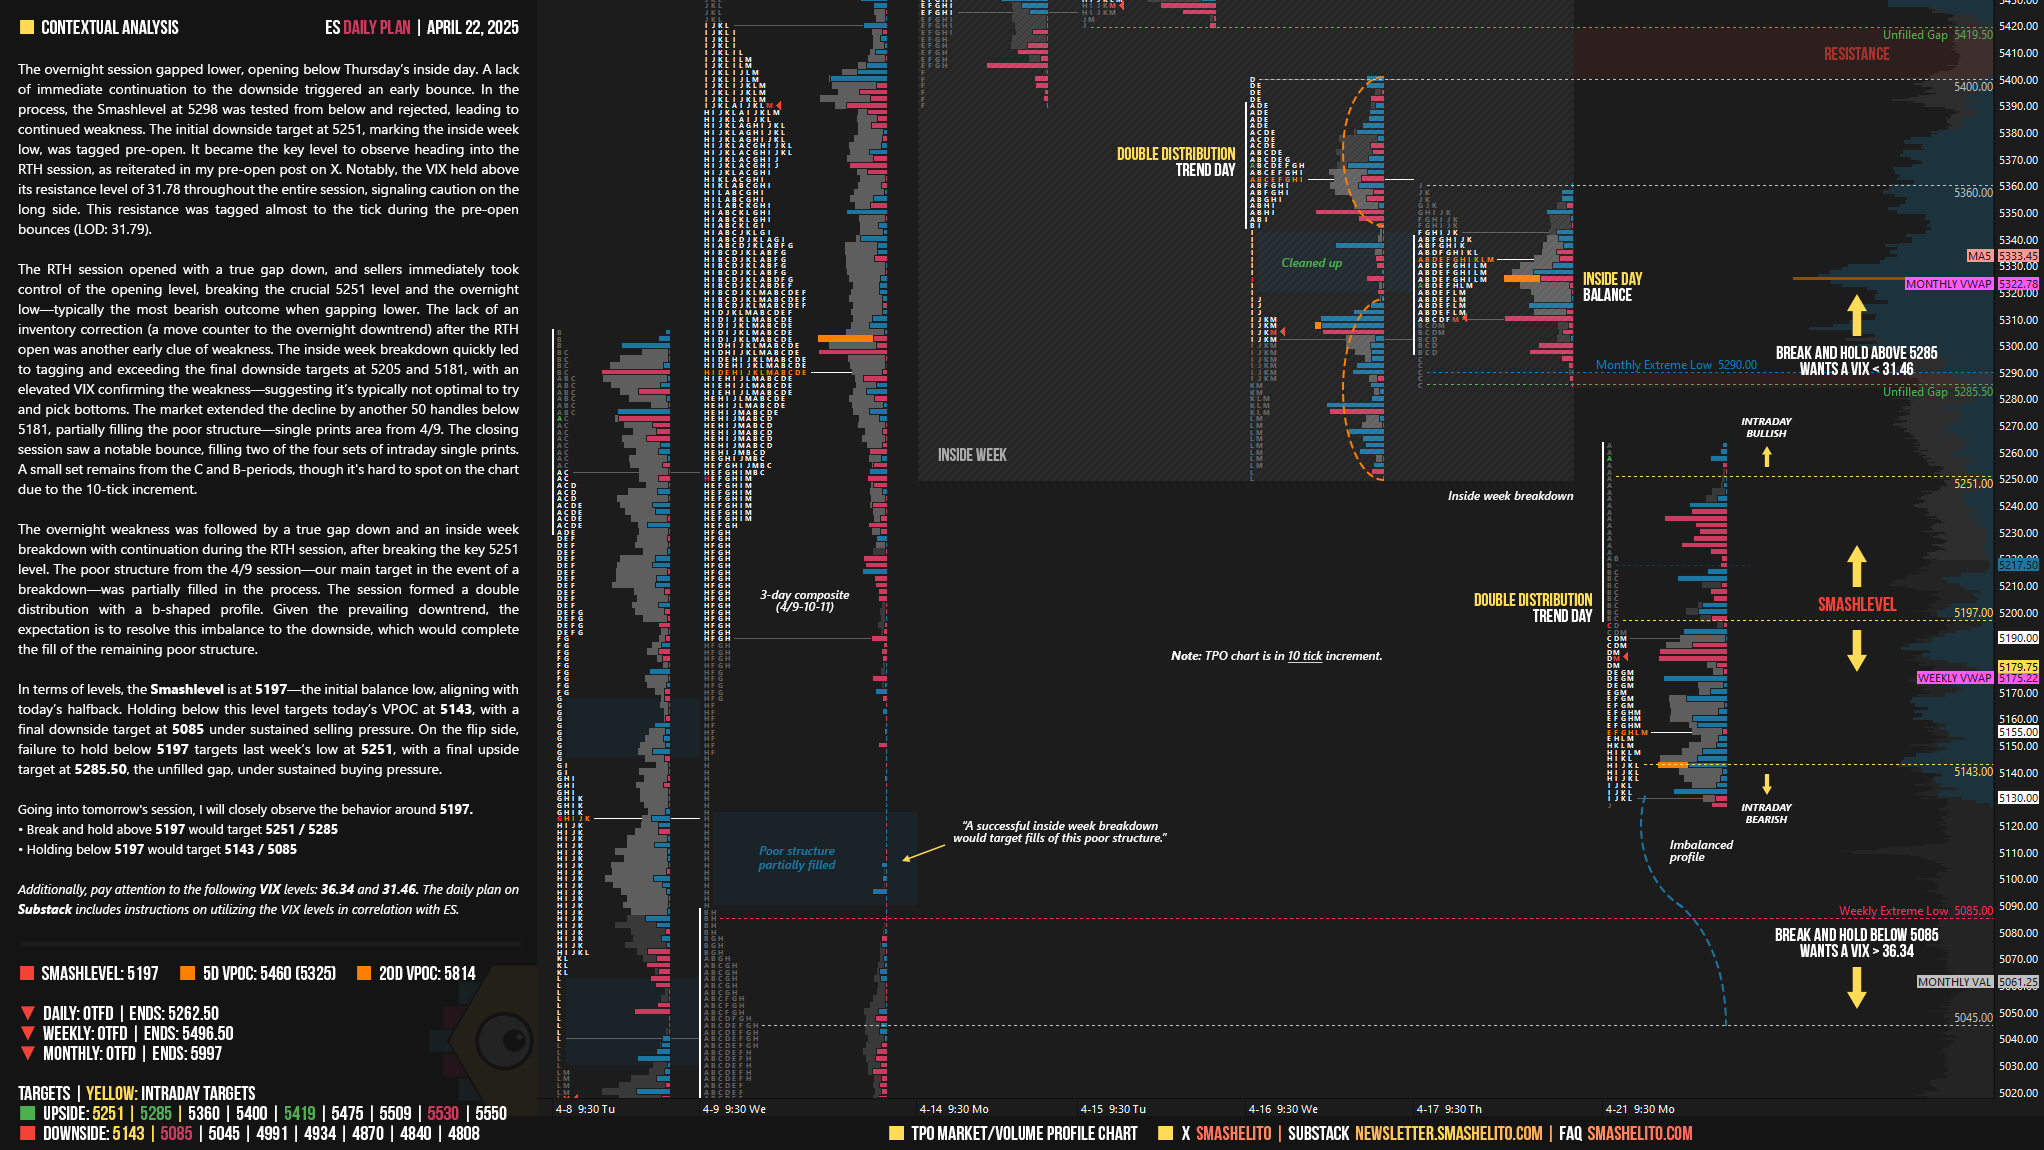
The overnight session gapped lower, opening below Thursday’s inside day. A lack of immediate continuation to the downside triggered an early bounce. In the process, the Smashlevel at 5298 was tested from below and rejected, leading to continued weakness. The initial downside target at 5251, marking the inside week low, was tagged pre-open. It became the key level to observe heading into the RTH session, as reiterated in my pre-open post on X. Notably, the VIX held above its resistance level of 31.78 throughout the entire session, signaling caution on the long side. This resistance was tagged almost to the tick during the pre-open bounces (LOD: 31.79).
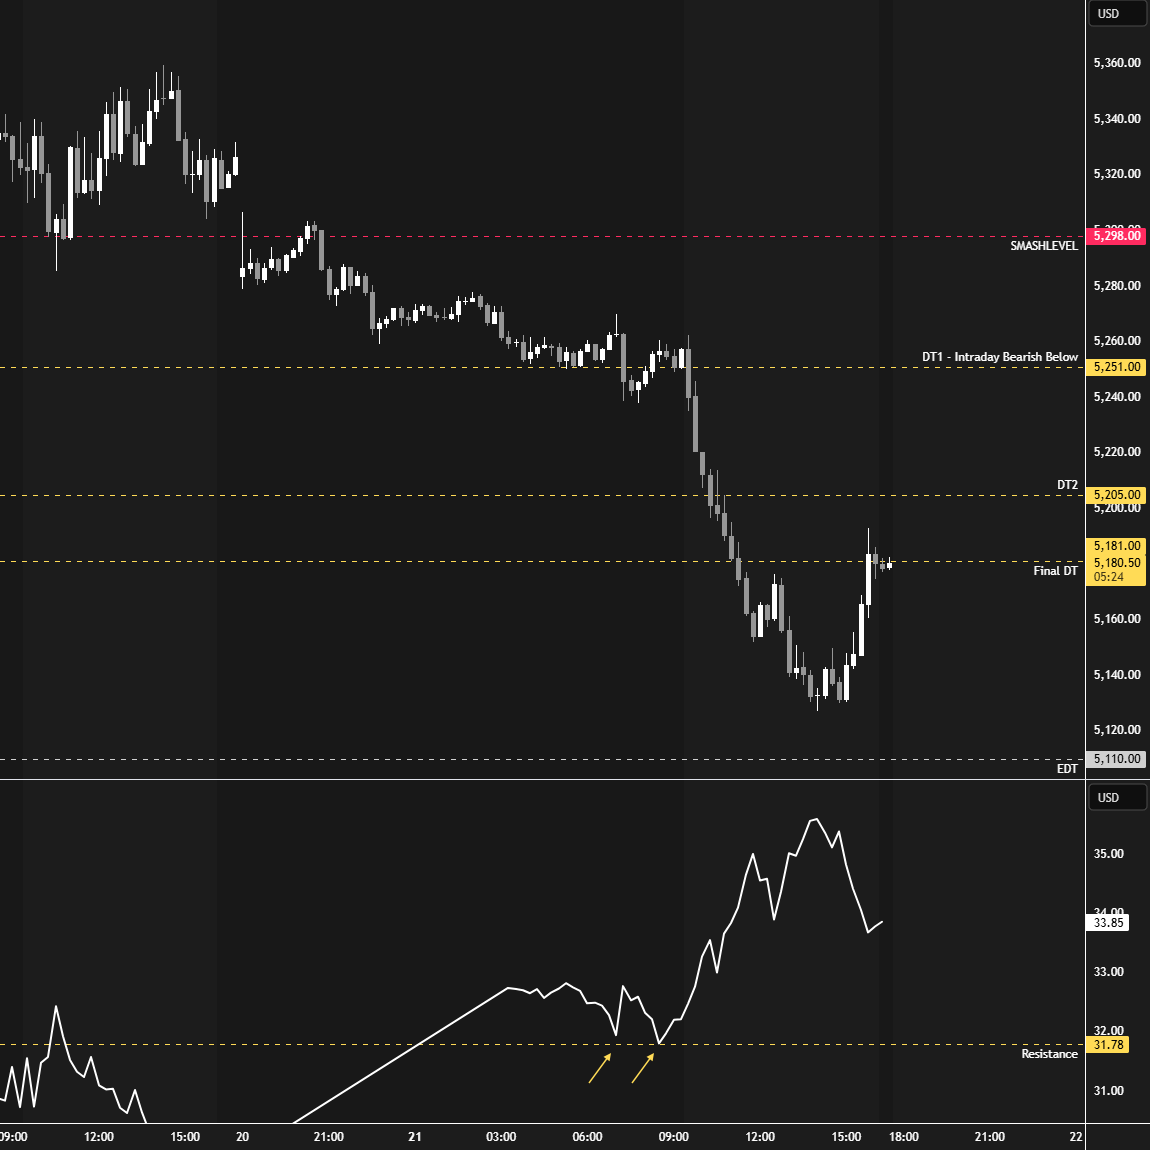
The RTH session opened with a true gap down, and sellers immediately took control of the opening level, breaking the crucial 5251 level and the overnight low—typically the most bearish outcome when gapping lower. The lack of an inventory correction (a move counter to the overnight downtrend) after the RTH open was another early clue of weakness. The inside week breakdown quickly led to tagging and exceeding the final downside targets at 5205 and 5181, with an elevated VIX confirming the weakness—suggesting it’s typically not optimal to try and pick bottoms. The market extended the decline by another 50 handles below 5181, partially filling the poor structure—single prints area from 4/9. The closing session saw a notable bounce, filling two of the four sets of intraday single prints. A small set remains from the C and B-periods, though it's hard to spot on the chart due to the 10-tick increment.
The overnight weakness was followed by a true gap down and an inside week breakdown with continuation during the RTH session, after breaking the key 5251 level. The poor structure from the 4/9 session—our main target in the event of a breakdown—was partially filled in the process. The session formed a double distribution with a b-shaped profile. Given the prevailing downtrend, the expectation is to resolve this imbalance to the downside, which would complete the fill of the remaining poor structure.
In terms of levels, the Smashlevel is at 5197—the initial balance low, aligning with today’s halfback. Holding below this level targets today’s VPOC at 5143, with a final downside target at 5085 under sustained selling pressure. On the flip side, failure to hold below 5197 targets last week’s low at 5251, with a final upside target at 5285.50, the unfilled gap, under sustained buying pressure.
Levels of Interest
Going into tomorrow's session, I will closely observe the behavior around 5197.
Break and hold above 5197 would target 5251 / 5285
Holding below 5197 would target 5143 / 5085
Additionally, pay attention to the following VIX levels: 36.34 and 31.46. These levels can provide confirmation of strength or weakness.
Break and hold above 5285 with VIX below 31.46 would confirm strength.
Break and hold below 5085 with VIX above 36.34 would confirm weakness.
Overall, it's important to exercise caution when trading outside of the highlighted yellow levels. A non-cooperative VIX may suggest possible reversals i.e trade setups.
Thank you as always!
Thank you very much!