
ES Daily Plan | April 21, 2026
Market Context & Key Levels for the Day Ahead

— For new subscribers
The yellow levels highlighted at the bottom left of the chart are the primary intraday levels I focus on. To avoid impulsive decisions at poor trade locations, I follow a simple but effective rule: exercise caution when initiating trades outside of these yellow levels.
This means I’m cautious about chasing longs above the Final Upside Target (FUT) and shorts below the Final Downside Target (FDT). It’s important to understand that not chasing does not imply initiating a trade in the opposite direction, discipline over impulse.
Be sure to review the Weekly Plan for a broader perspective, key levels, and market expectations for the week ahead.

Contextual Analysis & Plan
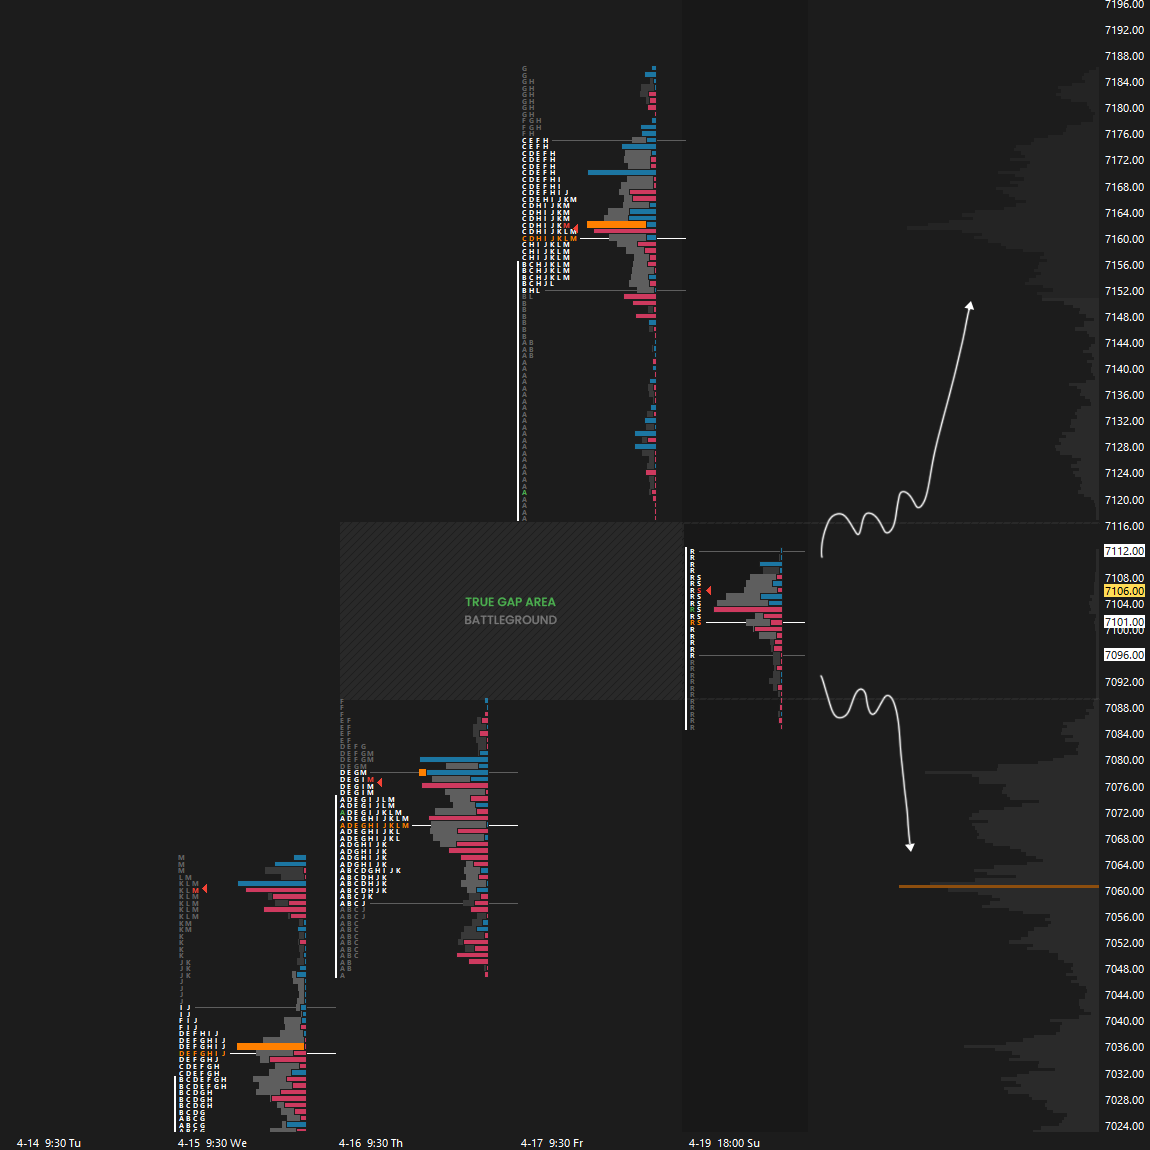
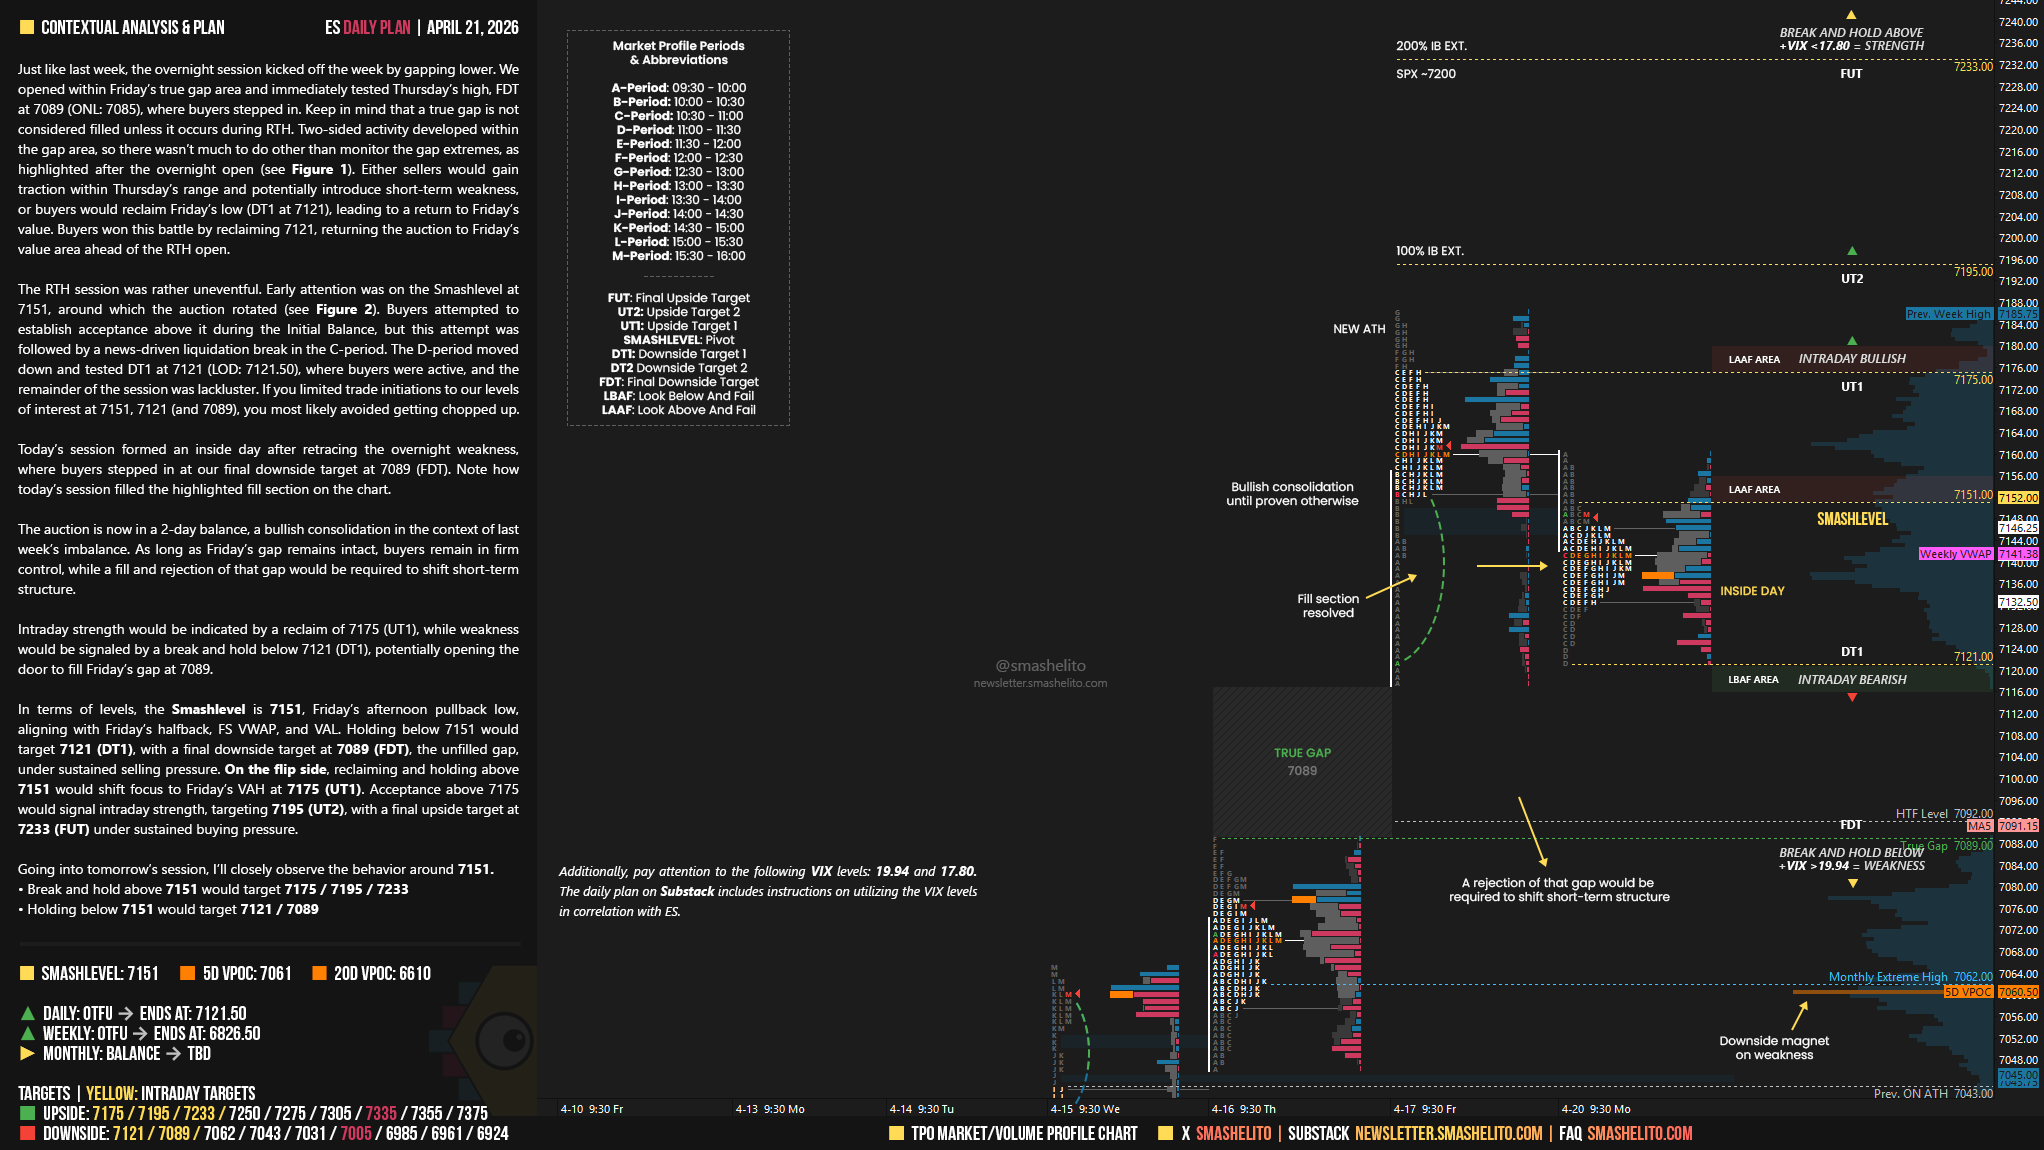
Just like last week, the overnight session kicked off the week by gapping lower. We opened within Friday’s true gap area and immediately tested Thursday’s high, FDT at 7089 (ONL: 7085), where buyers stepped in. Keep in mind that a true gap is not considered filled unless it occurs during RTH. Two-sided activity developed within the gap area, so there wasn’t much to do other than monitor the gap extremes, as highlighted after the overnight open (see Figure 1). Either sellers would gain traction within Thursday’s range and potentially introduce short-term weakness, or buyers would reclaim Friday’s low (DT1 at 7121), leading to a return to Friday’s value. Buyers won this battle by reclaiming 7121, returning the auction to Friday’s value area ahead of the RTH open.
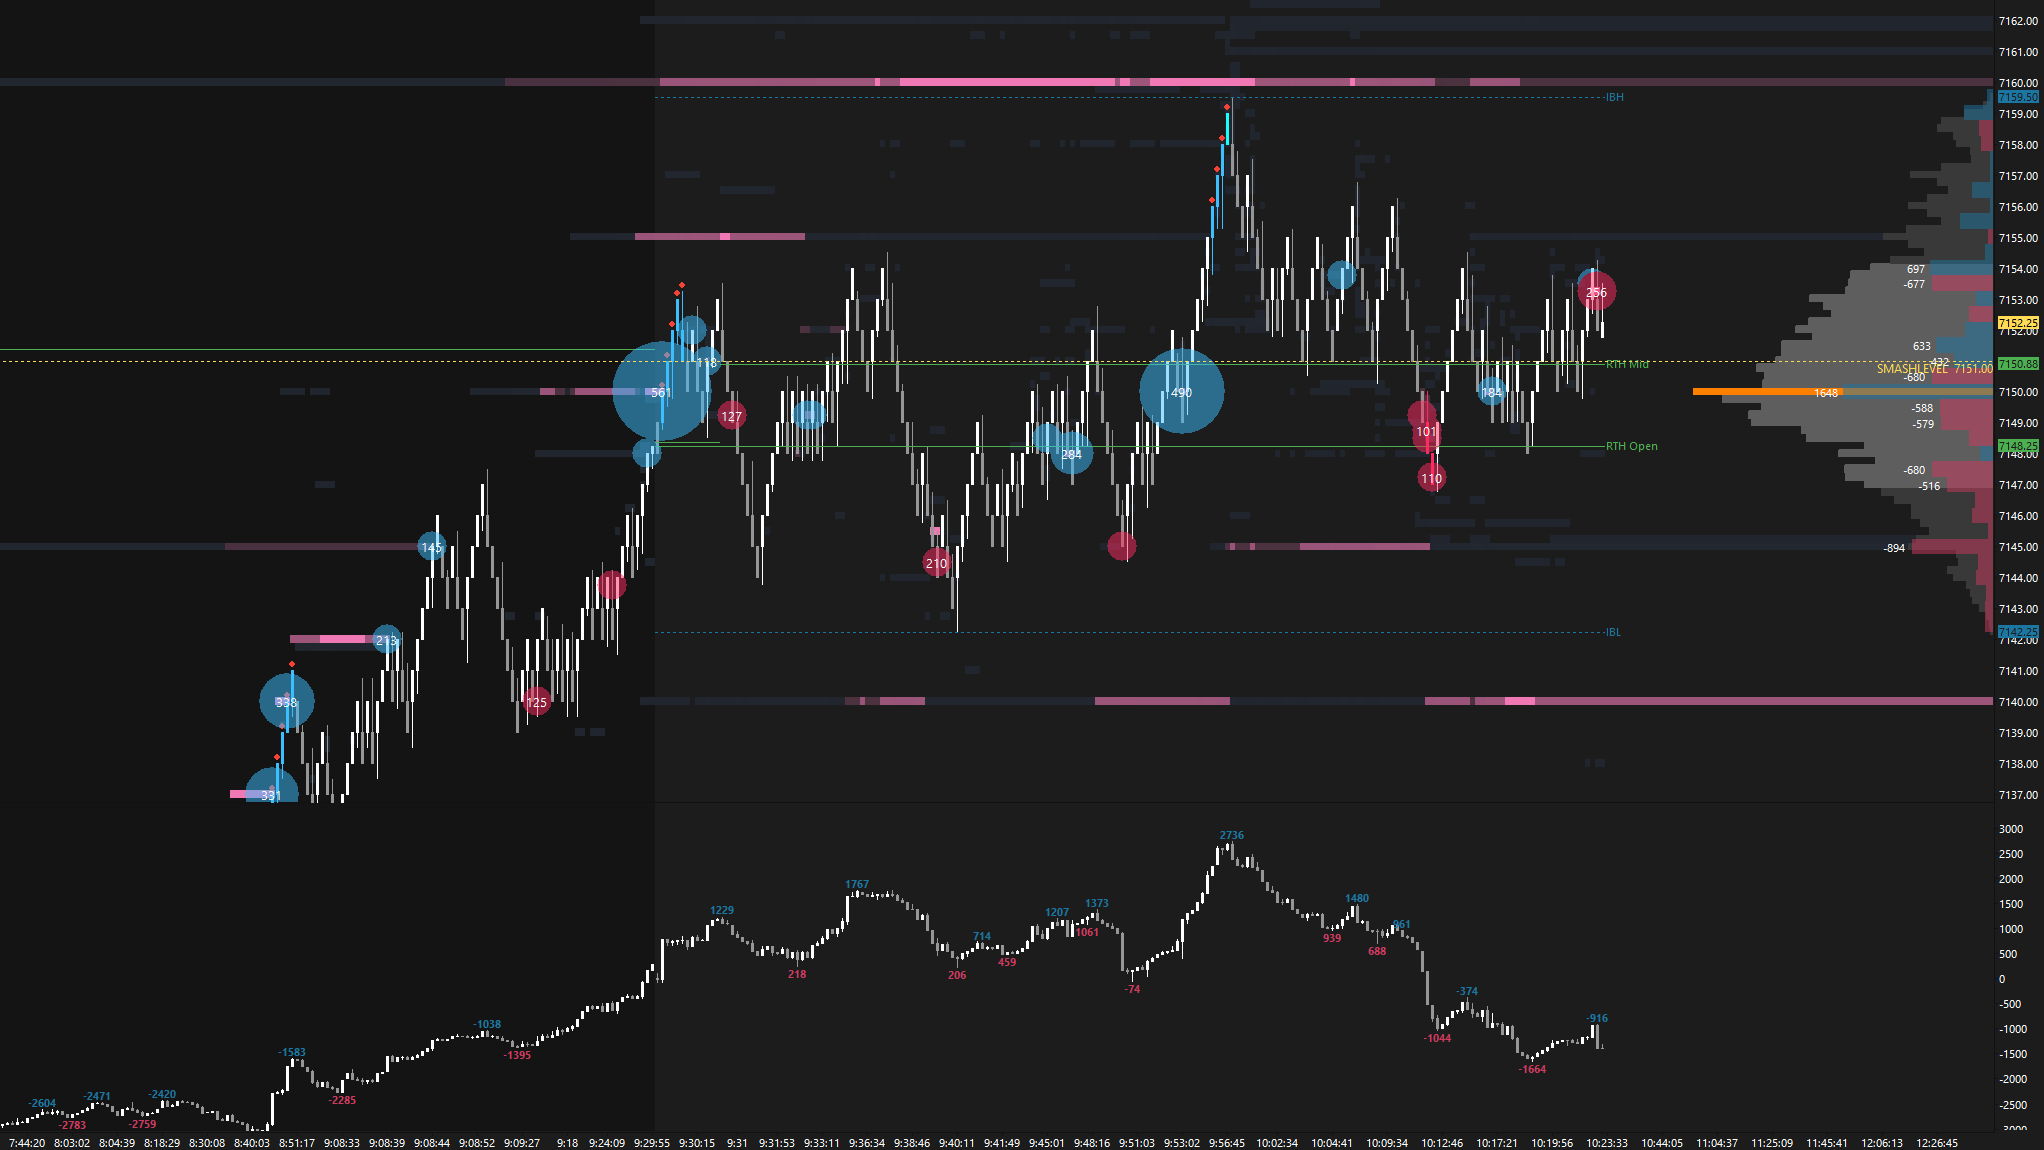
The RTH session was rather uneventful. Early attention was on the Smashlevel at 7151, around which the auction rotated (see Figure 2). Buyers attempted to establish acceptance above it during the Initial Balance, but this attempt was followed by a news-driven liquidation break in the C-period. The D-period moved down and tested DT1 at 7121 (LOD: 7121.50), where buyers were active, and the remainder of the session was lackluster. If you limited trade initiations to our levels of interest at 7151, 7121 (and 7089), you most likely avoided getting chopped up.
Smashlevels Recap
Today’s session formed an inside day after retracing the overnight weakness, where buyers stepped in at our final downside target at 7089 (FDT). Note how today’s session filled the highlighted fill section on the chart.
The auction is now in a 2-day balance, a bullish consolidation in the context of last week’s imbalance. As long as Friday’s gap remains intact, buyers remain in firm control, while a fill and rejection of that gap would be required to shift short-term structure.
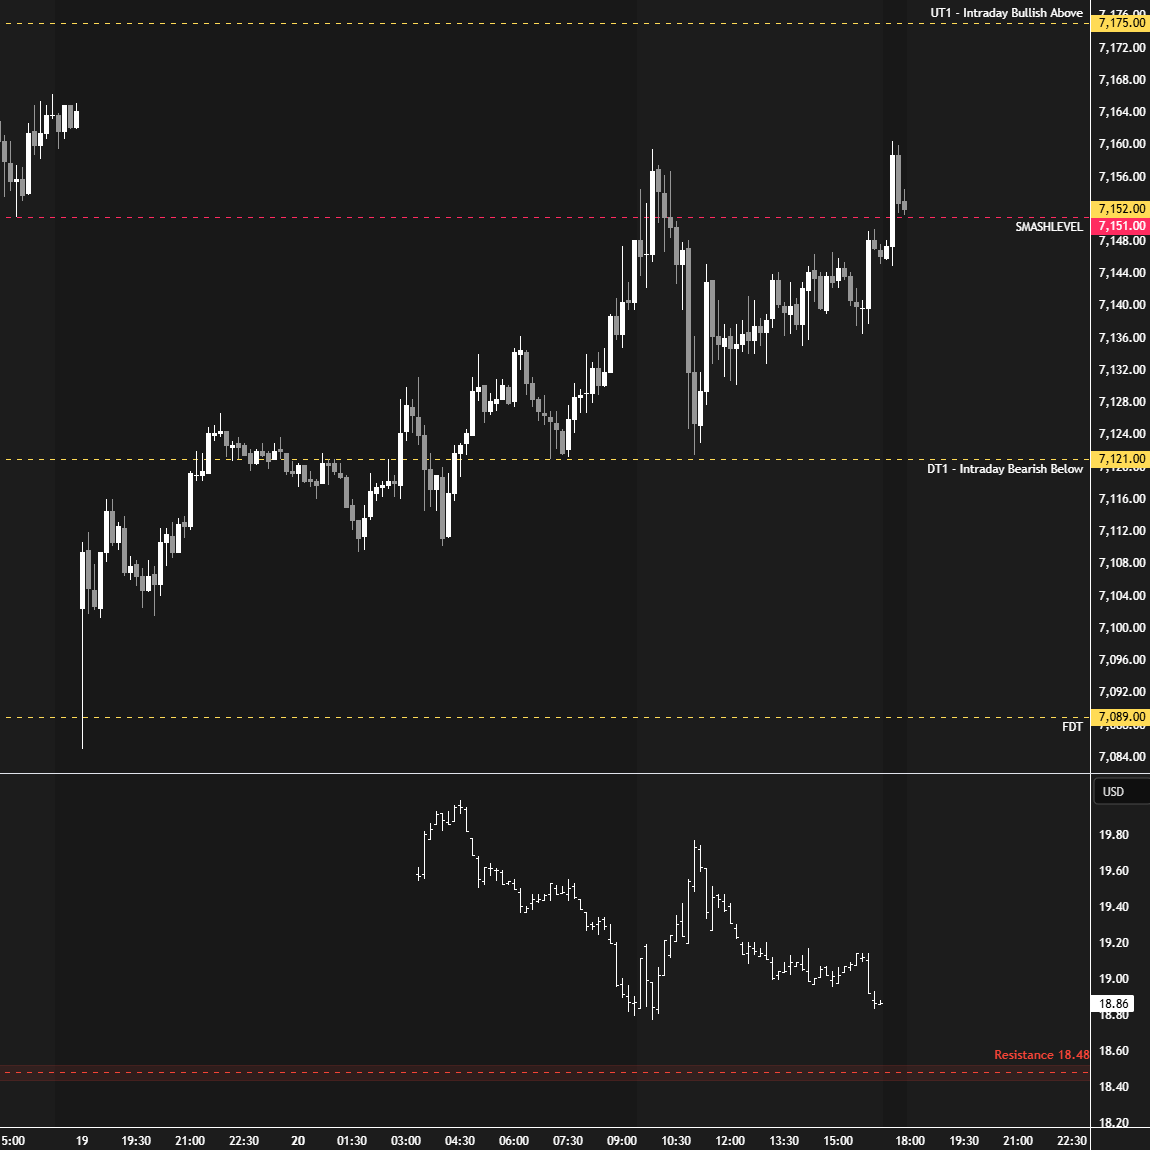
Intraday strength would be indicated by a reclaim of 7175 (UT1), while weakness would be signaled by a break and hold below 7121 (DT1), potentially opening the door to fill Friday’s gap at 7089.
In terms of levels, the Smashlevel is 7151, Friday’s afternoon pullback low, aligning with Friday’s halfback, FS VWAP, and VAL. Holding below 7151 would target 7121 (DT1), with a final downside target at 7089 (FDT), the unfilled gap, under sustained selling pressure.
On the flip side, reclaiming and holding above 7151 would shift focus to Friday’s VAH at 7175 (UT1). Acceptance above 7175 would signal intraday strength, targeting 7195 (UT2), with a final upside target at 7233 (FUT) under sustained buying pressure.
Visual Representation
Levels of Interest
Going into tomorrow’s session, I’ll closely observe the behavior around 7151.
Break and hold above 7151 would target 7175 / 7195 / 7233
Holding below 7151 would target 7121 / 7089
Additionally, pay attention to the following VIX levels: 19.94 and 17.80. These levels can provide confirmation of strength or weakness.
Break and hold above 7233 with VIX below 17.80 would confirm strength.
Break and hold below 7089 with VIX above 19.94 would confirm weakness.
Overall, it's important to exercise caution when trading outside of the highlighted yellow levels. A non-cooperative VIX may suggest possible reversals i.e trade setups.
Thank you Smash. I have a question if I may please ? You have a red zone above the 7151 level, when price is below. However as I now mark up my charts in Globex, price is above 7151 at 7160. If price stays above 7151 into RTH, should that zone then be green and below 7151 ? Many thanks.
Thanks a lot Smash!!