
ES Daily Plan | April 20, 2026
Market Context & Key Levels for the Day Ahead

— For new subscribers
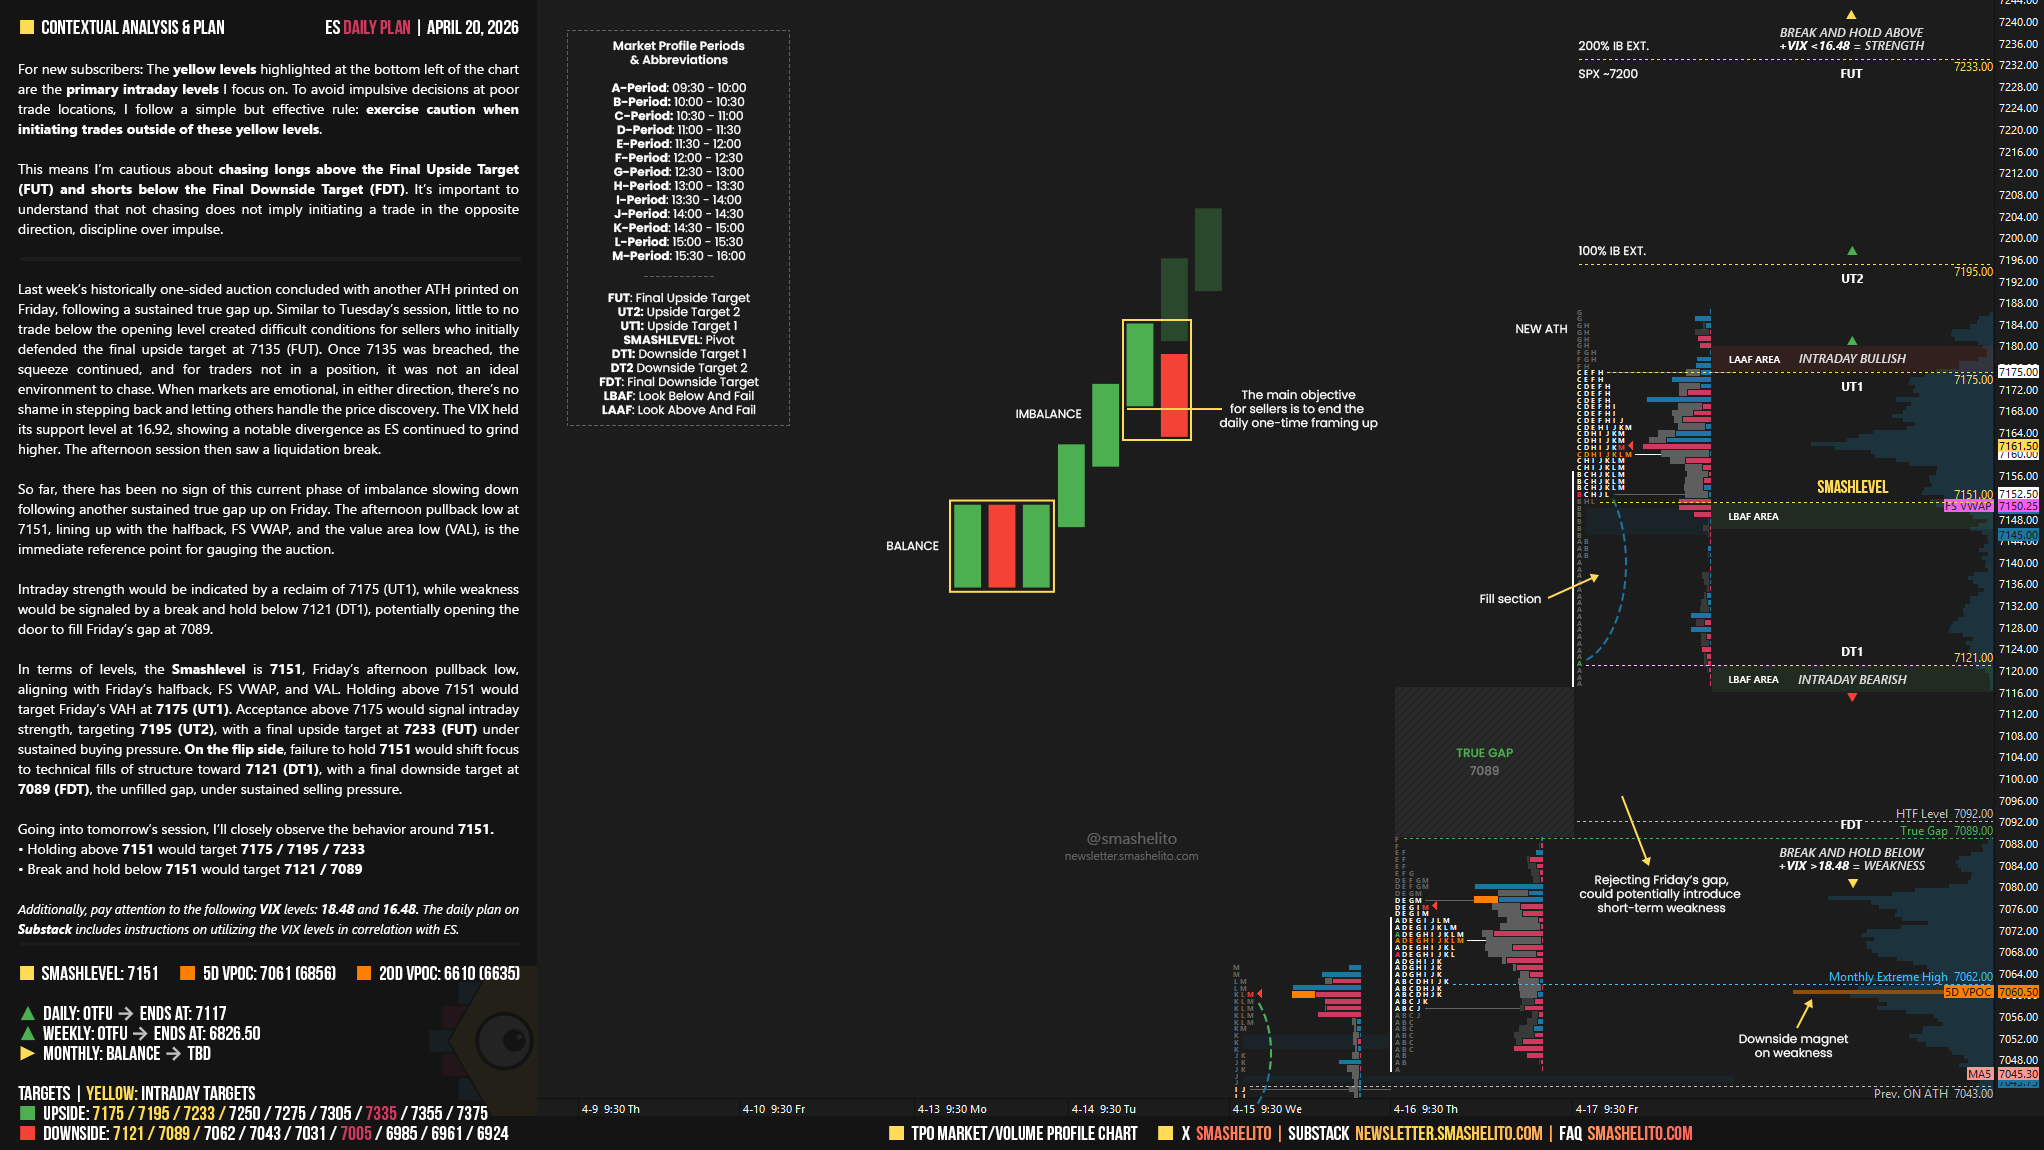
The yellow levels highlighted at the bottom left of the chart are the primary intraday levels I focus on. To avoid impulsive decisions at poor trade locations, I follow a simple but effective rule: exercise caution when initiating trades outside of these yellow levels.
This means I’m cautious about chasing longs above the Final Upside Target (FUT) and shorts below the Final Downside Target (FDT). It’s important to understand that not chasing does not imply initiating a trade in the opposite direction, discipline over impulse.
Be sure to review the Weekly Plan for a broader perspective, key levels, and market expectations for the week ahead.

Contextual Analysis & Plan
Last week’s historically one-sided auction concluded with another ATH printed on Friday, following a sustained true gap up. Similar to Tuesday’s session, little to no trade below the opening level created difficult conditions for sellers who initially defended the final upside target at 7135 (FUT). Once 7135 was breached, the squeeze continued, and for traders not in a position, it was not an ideal environment to chase. When markets are emotional, in either direction, there’s no shame in stepping back and letting others handle the price discovery. The VIX held its support level at 16.92, showing a notable divergence as ES continued to grind higher. The afternoon session then saw a liquidation break.
Smashlevels Recap
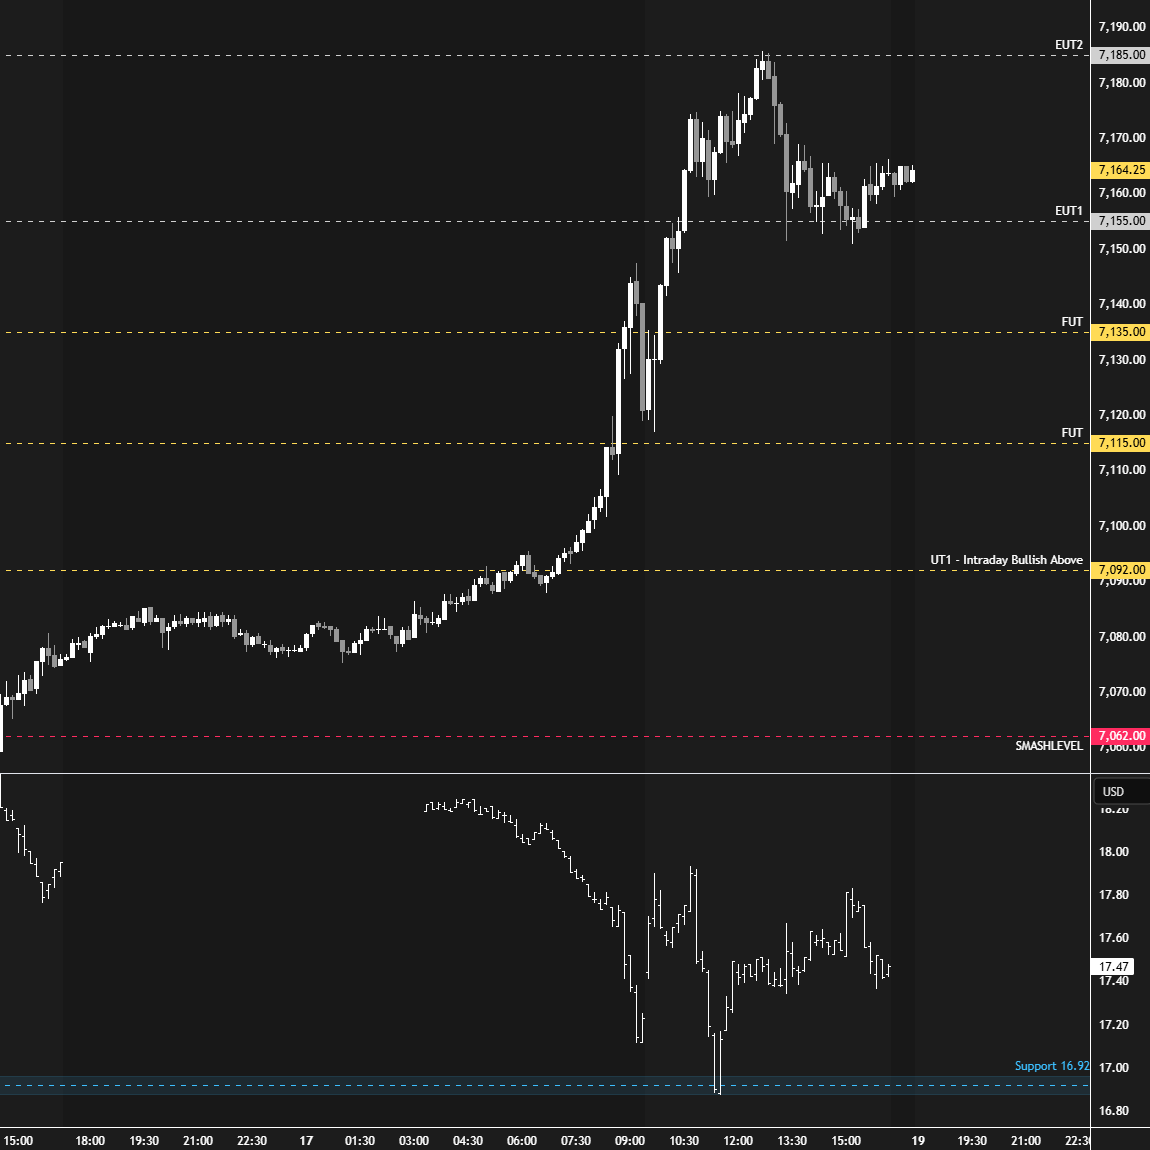
So far, there has been no sign of this current phase of imbalance slowing down following another sustained true gap up on Friday. The afternoon pullback low at 7151, lining up with the halfback, FS VWAP, and the value area low (VAL), is the immediate reference point for gauging the auction.
Intraday strength would be indicated by a reclaim of 7175 (UT1), while weakness would be signaled by a break and hold below 7121 (DT1), potentially opening the door to fill Friday’s gap at 7089.
In terms of levels, the Smashlevel is 7151, aligning with Friday’s halfback, FS VWAP and VAL. Holding above 7151 would target Friday’s VAH at 7175 (UT1). Acceptance above 7175 would signal intraday strength, targeting 7195 (UT2), with a final upside target at 7233 (FUT) under sustained buying pressure.
On the flip side, failure to hold 7151 would shift focus to technical fills of structure toward 7121 (DT1), with a final downside target at 7089 (FDT), the unfilled gap, under sustained selling pressure.
Visual Representation
Levels of Interest
Going into tomorrow’s session, I’ll closely observe the behavior around 7151.
Holding above 7151 would target 7175 / 7195 / 7233
Break and hold below 7151 would target 7121 / 7089
Additionally, pay attention to the following VIX levels: 18.48 and 16.48. These levels can provide confirmation of strength or weakness.
Break and hold above 7233 with VIX below 16.48 would confirm strength.
Break and hold below 7089 with VIX above 18.48 would confirm weakness.
Overall, it's important to exercise caution when trading outside of the highlighted yellow levels. A non-cooperative VIX may suggest possible reversals i.e trade setups.
Thank you so much
Thanks Smash, have a great session