
ES Daily Plan | April 17, 2026
Market Context & Key Levels for the Day Ahead

— For new subscribers
The yellow levels highlighted at the bottom left of the chart are the primary intraday levels I focus on. To avoid impulsive decisions at poor trade locations, I follow a simple but effective rule: exercise caution when initiating trades outside of these yellow levels.
This means I’m cautious about chasing longs above the Final Upside Target (FUT) and shorts below the Final Downside Target (FDT). It’s important to understand that not chasing does not imply initiating a trade in the opposite direction, discipline over impulse.
Be sure to review the Weekly Plan for a broader perspective, key levels, and market expectations for the week ahead.

Contextual Analysis & Plan
Wednesday’s closing strength carried into the overnight session, with price exploring uncharted territory. A new all-time high printed at 7078.50 before a pullback unfolded during the European session. The Smashlevel at 7062 attracted buying activity on two occasions ahead of the RTH open.
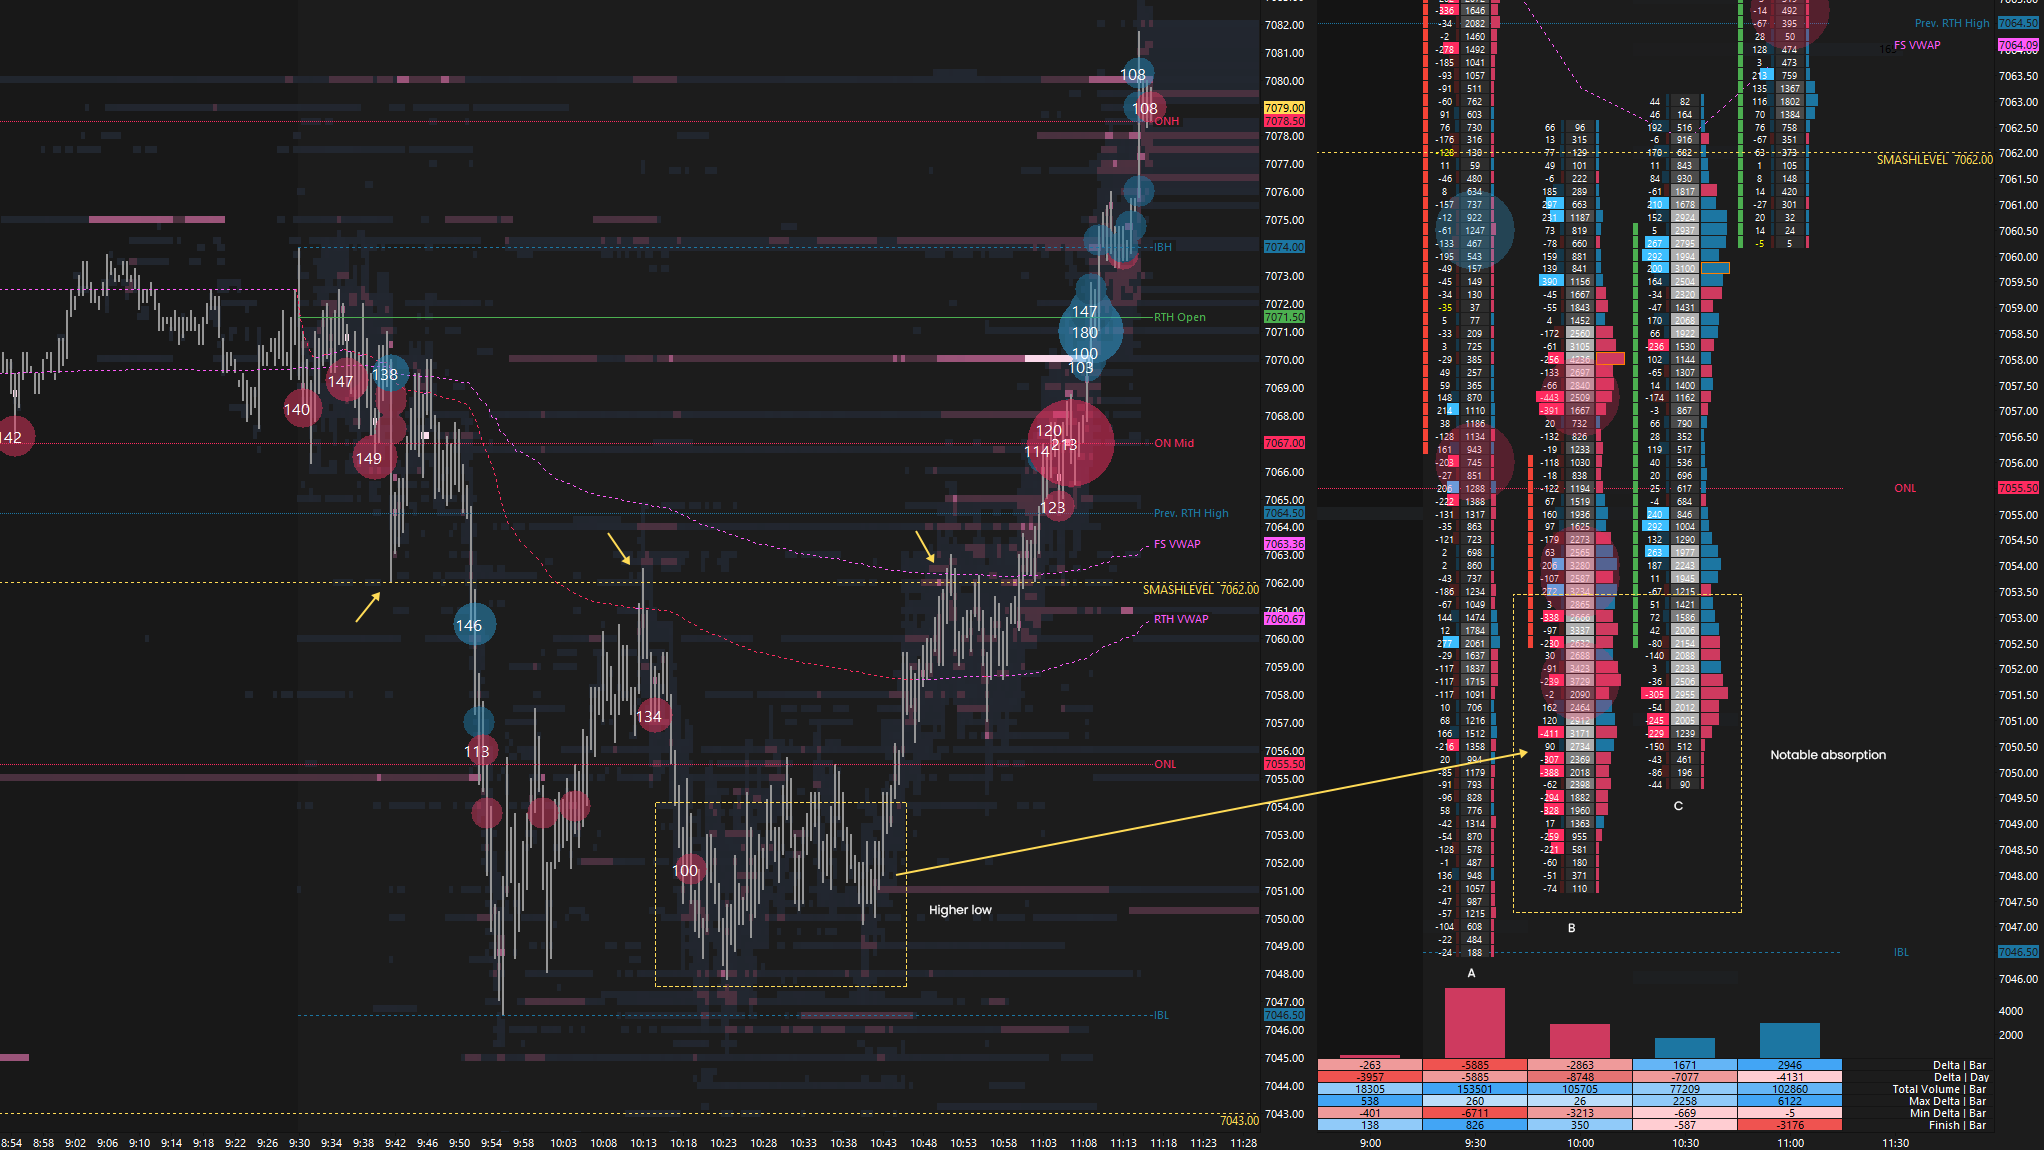
Similar to recent sessions, RTH opened on a true gap up, shifting immediate focus to whether the gap would be filled and, if so, whether sellers could gain traction within the prior day’s range. The gap was filled in the A-period, but unlike Wednesday’s session, the gap-fill reversal failed, giving sellers an opportunity to act. As discussed, sellers needed to break the 7043–7035 area, marking the prior ATH, to potentially introduce short-term weakness. Wednesday’s poor structure was partially filled before buyers stepped in at 7046.50.
While both the B- and C-periods held within the prior day’s range, with the Smashlevel at 7062 acting as a pivot, aggressive sellers were unable to push through the passive limit orders sitting above the 7043–7035 area. The resulting absorption fueled a continuation higher in the D-period once 7062 was breached (see Figure 1), a common outcome when counter-trend effort fails. The overnight ATH was cleaned up during this squeeze, printing a new ATH at 7089, just 3 handles shy of the HTF level at 7092, where a potential reversal could occur. Thanks for front-running it, guys! The Smashlevel at 7062 remained crucial for the rest of the session, capping the afternoon downside.
Be observant: The auction has moved significantly away from multiple value references, making it tricky to chase here. What makes this situation more complex is the fact that we have breached the prior ATH, making fades unfavorable until the auction at least fails to hold the 7043–7035 area.
As always, markets don’t become “overbought” or “oversold.” I would not get involved with these terms. It’s all about whether prices are accepted or rejected. As long as higher prices are accepted, the market can keep moving upward.
Smashlevels Recap
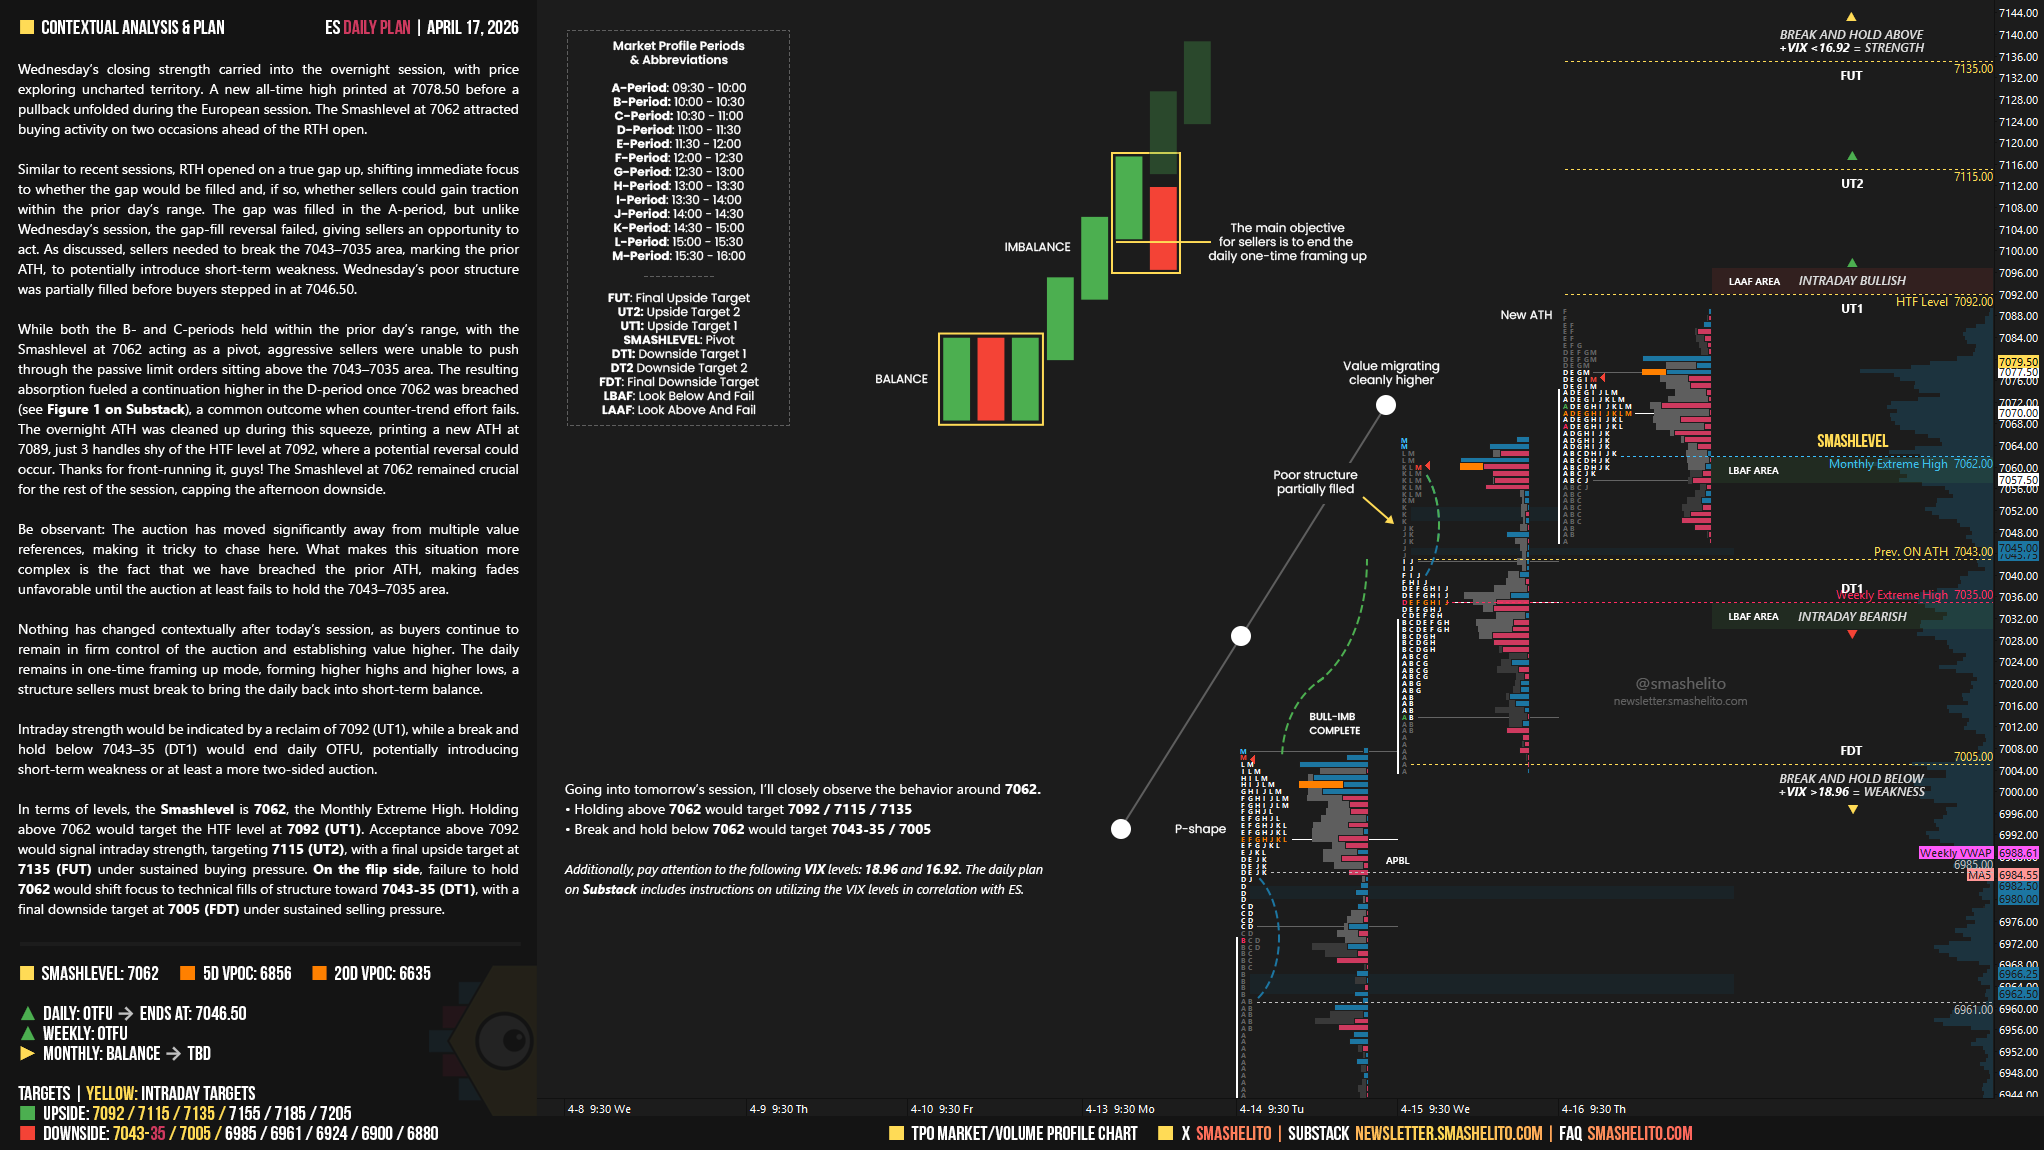
Nothing has changed contextually after today’s session, as buyers continue to remain in firm control of the auction and establishing value higher.
The daily remains in one-time framing up mode, forming higher highs and higher lows, a structure sellers must break to bring the daily back into short-term balance.
Intraday strength would be indicated by a reclaim of 7092 (UT1), while a break and hold below 7043–35 (DT1) would end daily OTFU, potentially introducing short-term weakness or at least a more two-sided auction.
In terms of levels, the Smashlevel is 7062, the Monthly Extreme High. Holding above 7062 would target the HTF level at 7092 (UT1). Acceptance above 7092 would signal intraday strength, targeting 7115 (UT2), with a final upside target at 7135 (FUT) under sustained buying pressure.
On the flip side, failure to hold 7062 would shift focus to technical fills of structure toward 7043-35 (DT1), with a final downside target at 7005 (FDT) under sustained selling pressure.
Visual Representation
Levels of Interest
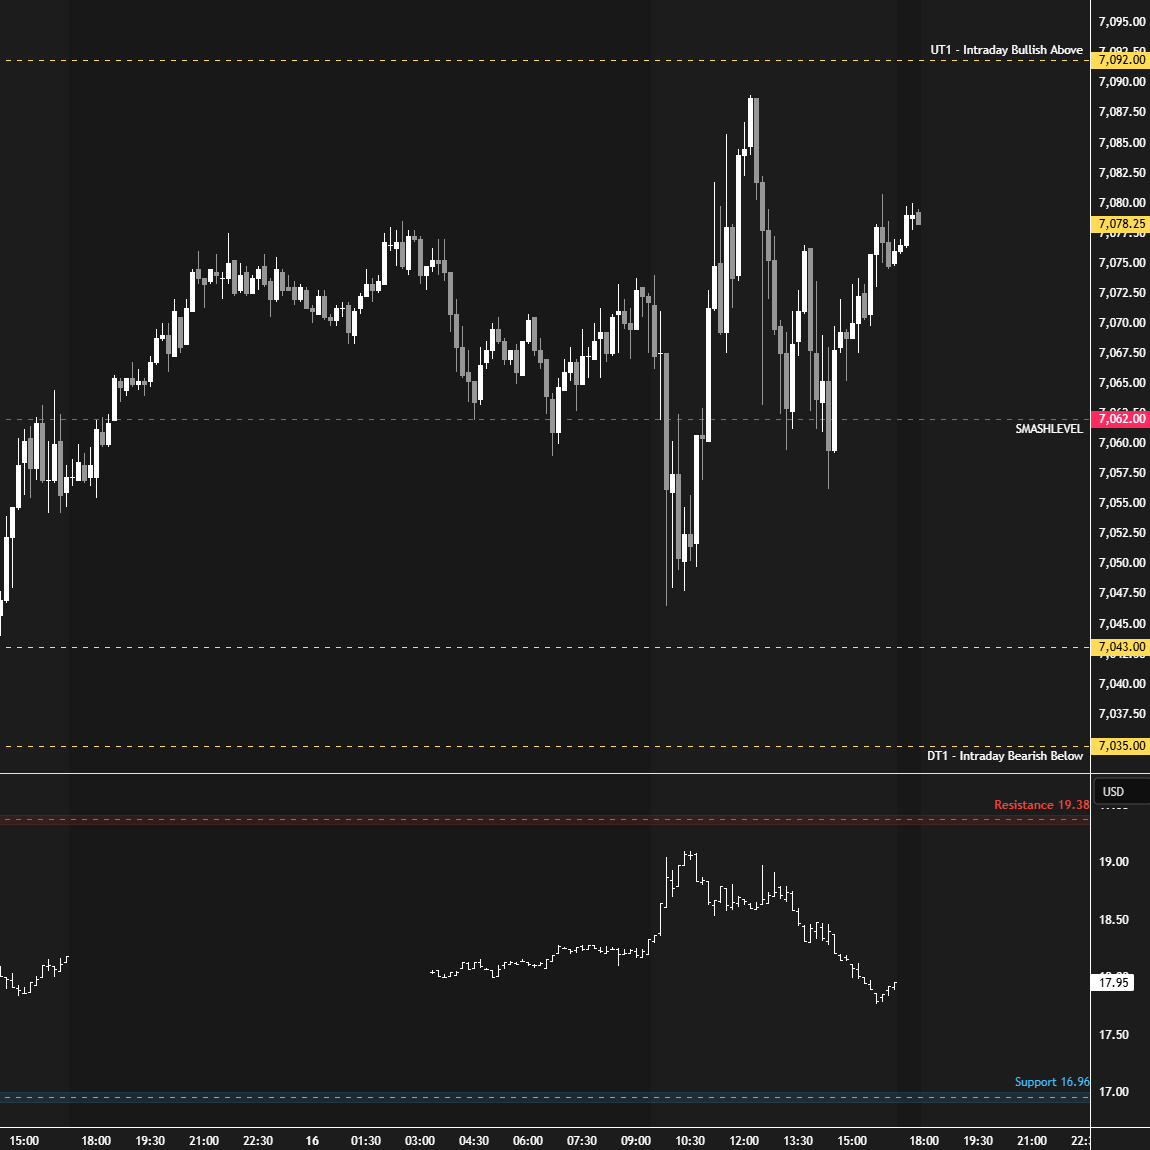
Going into tomorrow’s session, I’ll closely observe the behavior around 7062.
Holding above 7062 would target 7092 / 7115 / 7135
Break and hold below 7062 would target 7043-35 / 7005
Additionally, pay attention to the following VIX levels: 18.96 and 16.92. These levels can provide confirmation of strength or weakness.
Break and hold above 7135 with VIX below 16.92 would confirm strength.
Break and hold below 7005 with VIX above 18.96 would confirm weakness.
Overall, it's important to exercise caution when trading outside of the highlighted yellow levels. A non-cooperative VIX may suggest possible reversals i.e trade setups.
Thanks Smash!
F period excess?