ES Daily Plan | April 16, 2024
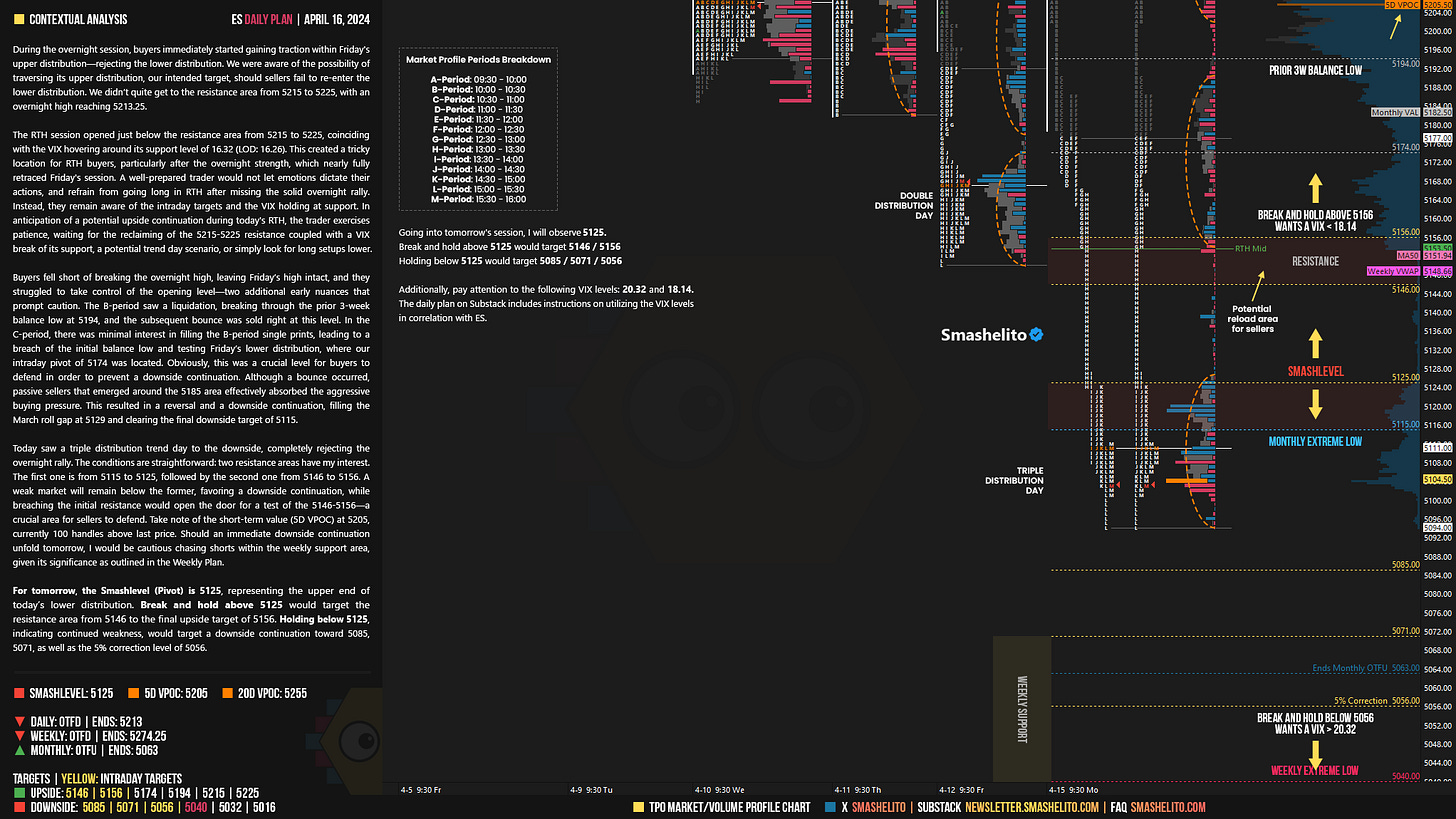
The conditions are straightforward: two resistance areas have my interest. The first one is from 5115 to 5125, followed by the second one from 5146 to 5156.
Visual Representation
For new followers, the yellow levels highlighted at the bottom are the primary levels that I focus on intraday. My strategy for preventing impulsive decisions at unfavorable locations involves following a simple yet effective rule of exercising caution when initiating trades outside of the yellow levels. This implies that I am cautious chasing longs above the final yellow upside target and shorts below the final yellow downside target. It is crucial to understand that refraining from chasing a trade is not an automatic invitation to initiate a trade in the opposite direction.
Contextual Analysis
During the overnight session, buyers immediately started gaining traction within Friday's upper distribution—rejecting the lower distribution. We were aware of the possibility of traversing its upper distribution, our intended target, should sellers fail to re-enter the lower distribution. We didn’t quite get to the resistance area from 5215 to 5225, with an overnight high reaching 5213.25.
The RTH session opened just below the resistance area from 5215 to 5225, coinciding with the VIX hovering around its support level of 16.32 (LOD: 16.26). This created a tricky location for RTH buyers, particularly after the overnight strength, which nearly fully retraced Friday's session. A well-prepared trader would not let emotions dictate their actions, and refrain from going long in RTH after missing the solid overnight rally. Instead, they remain aware of the intraday targets and the VIX holding at support. In anticipation of a potential upside continuation during today's RTH, the trader exercises patience, waiting for the reclaiming of the 5215-5225 resistance coupled with a VIX break of its support, a potential trend day scenario, or simply look for long setups lower.
Buyers fell short of breaking the overnight high, leaving Friday’s high intact, and they struggled to take control of the opening level—two additional early nuances that prompt caution. The B-period saw a liquidation, breaking through the prior 3-week balance low at 5194, and the subsequent bounce was sold right at this level. In the C-period, there was minimal interest in filling the B-period single prints, leading to a breach of the initial balance low and testing Friday’s lower distribution, where our intraday pivot of 5174 was located. Obviously, this was a crucial level for buyers to defend in order to prevent a downside continuation. Although a bounce occurred, passive sellers that emerged around the 5185 area effectively absorbed the aggressive buying pressure. This resulted in a reversal and a downside continuation, filling the March roll gap at 5129 and clearing the final downside target of 5115.
Today saw a triple distribution trend day to the downside, completely rejecting the overnight rally. The conditions are straightforward: two resistance areas have my interest. The first one is from 5115 to 5125, followed by the second one from 5146 to 5156. A weak market will remain below the former, favoring a downside continuation, while breaching the initial resistance would open the door for a test of the 5146-5156—a crucial area for sellers to defend. Take note of the short-term value (5D VPOC) at 5205, currently 100 handles above last price. Should an immediate downside continuation unfold tomorrow, I would be cautious chasing shorts within the weekly support area, given its significance as outlined in the Weekly Plan.
For tomorrow, the Smashlevel (Pivot) is 5125, representing the upper end of today’s lower distribution. Break and hold above 5125 would target the resistance area from 5146 to the final upside target of 5156. Holding below 5125, indicating continued weakness, would target a downside continuation toward 5085, 5071, as well as the 5% correction level of 5056.
Levels of Interest
Going into tomorrow's session, I will observe 5125.
Break and hold above 5125 would target 5146 / 5156
Holding below 5125 would target 5085 / 5071 / 5056
Additionally, pay attention to the following VIX levels: 20.32 and 18.14. These levels can provide confirmation of strength or weakness.
Break and hold above 5156 with VIX below 18.14 would confirm strength.
Break and hold below 5056 with VIX above 20.32 would confirm weakness.
Overall, it's important to exercise caution when trading outside of the highlighted yellow levels. A non-cooperative VIX may suggest possible reversals i.e trade setups.
Weekly Plan
Be sure to check out the Weekly Plan, which provides a broader perspective and highlights significant levels of interest to watch in the coming week.
Disclaimer: Futures and options trading involves a high level of risk, with the potential for substantial losses. The information provided in this newsletter is for informational purposes only and is not intended to be a trade recommendation. It is the responsibility of the reader to make their own investment decisions and they should seek the advice of a qualified securities professional before making any investments. The owners/authors of this newsletter are not certified as registered financial professionals or investment advisers.


Is the NQ roll gap also based on Mondays like ES?