
ES Daily Plan | April 15, 2026
Market Context & Key Levels for the Day Ahead

— For new subscribers
The yellow levels highlighted at the bottom left of the chart are the primary intraday levels I focus on. To avoid impulsive decisions at poor trade locations, I follow a simple but effective rule: exercise caution when initiating trades outside of these yellow levels.
This means I’m cautious about chasing longs above the Final Upside Target (FUT) and shorts below the Final Downside Target (FDT). It’s important to understand that not chasing does not imply initiating a trade in the opposite direction, discipline over impulse.
Be sure to review the Weekly Plan for a broader perspective, key levels, and market expectations for the week ahead.

Contextual Analysis & Plan
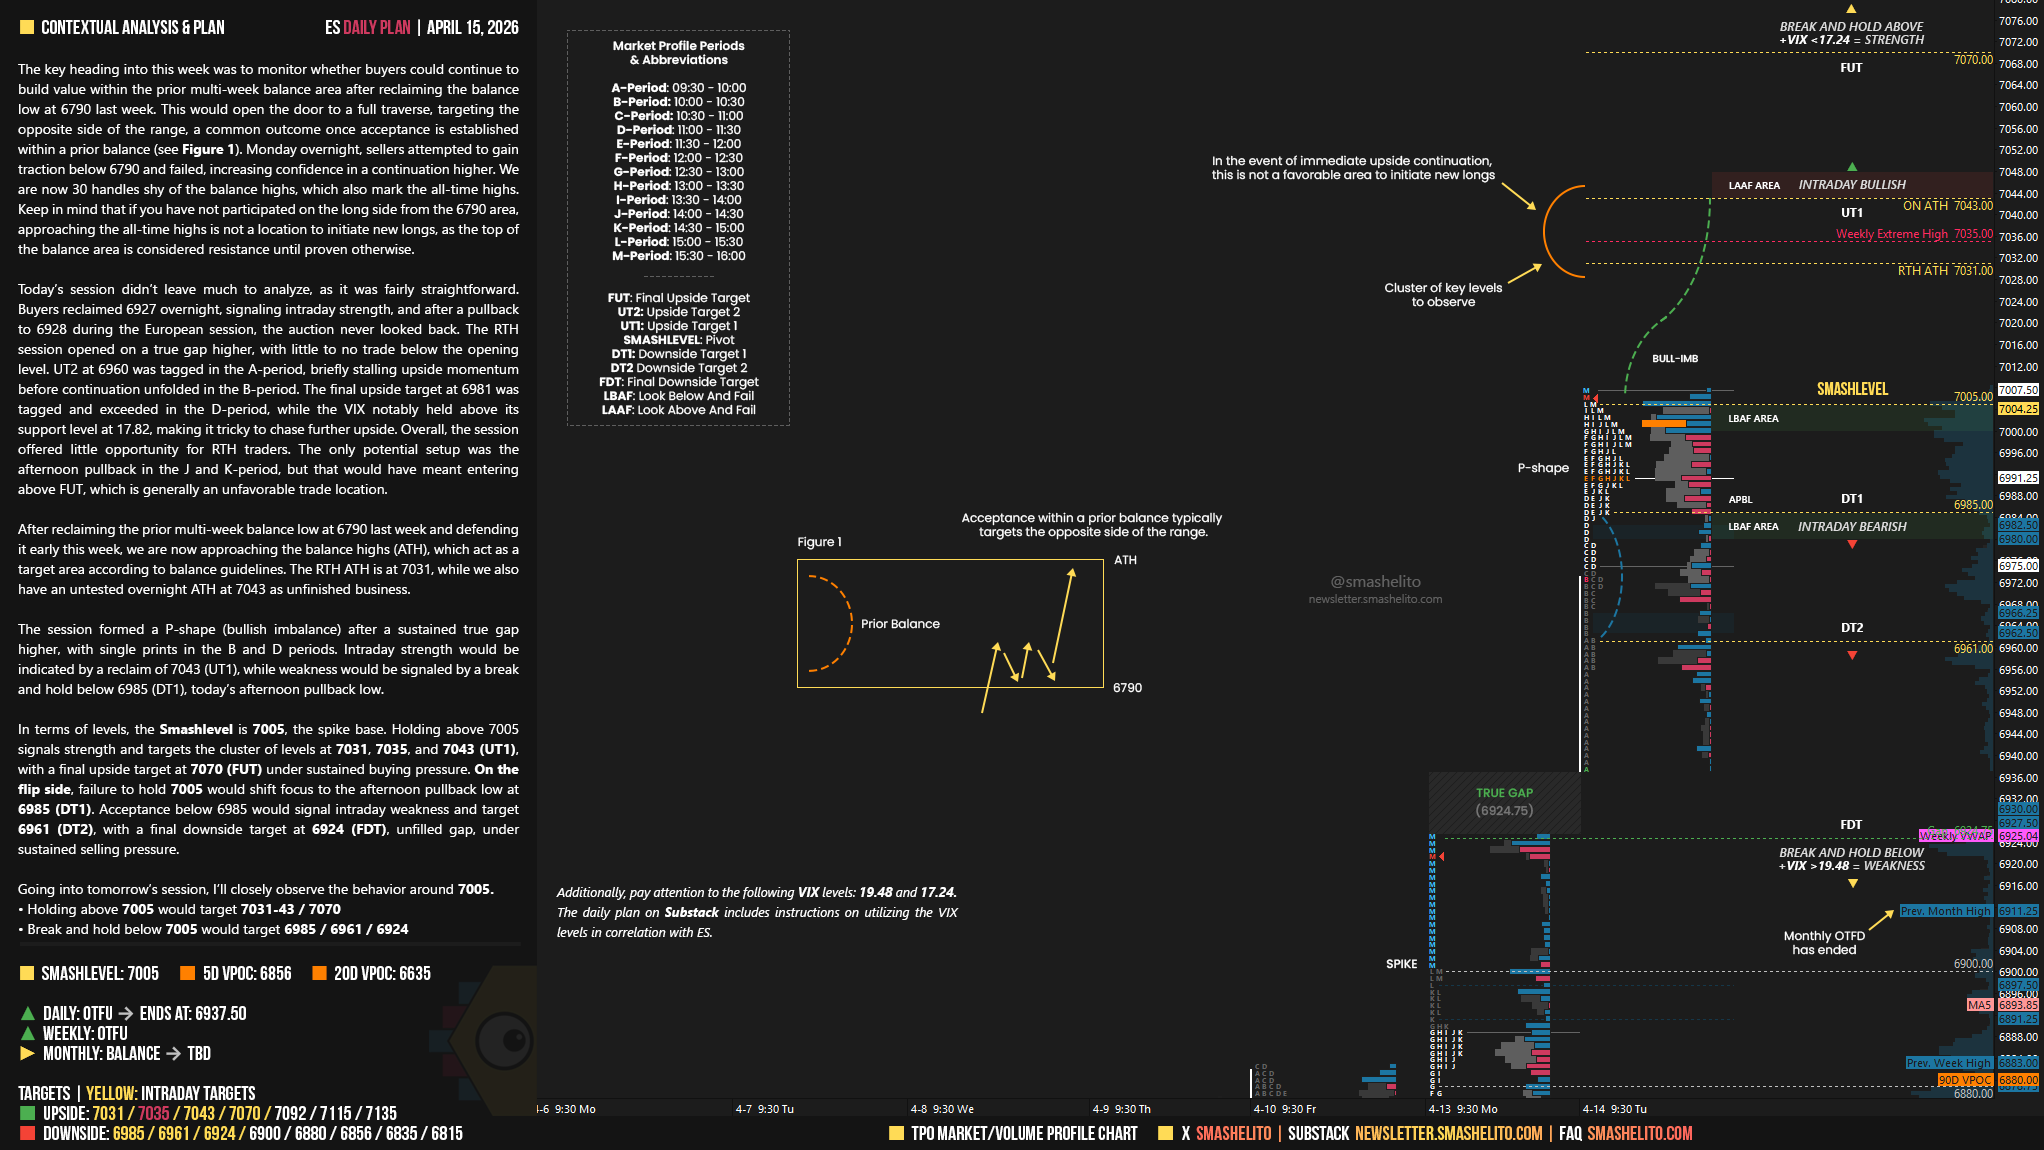
The key heading into this week was to monitor whether buyers could continue to build value within the prior multi-week balance area after reclaiming the balance low at 6790 last week. This would open the door to a full traverse, targeting the opposite side of the range, a common outcome once acceptance is established within a prior balance (see Figure 1 on chart). Monday overnight, sellers attempted to gain traction below 6790 and failed, increasing confidence in a continuation higher. We are now 30 handles shy of the balance highs, which also mark the all-time highs. Keep in mind that if you have not participated on the long side from the 6790 area, approaching the all-time highs is not a location to initiate new longs, as the top of the balance area is considered resistance until proven otherwise.
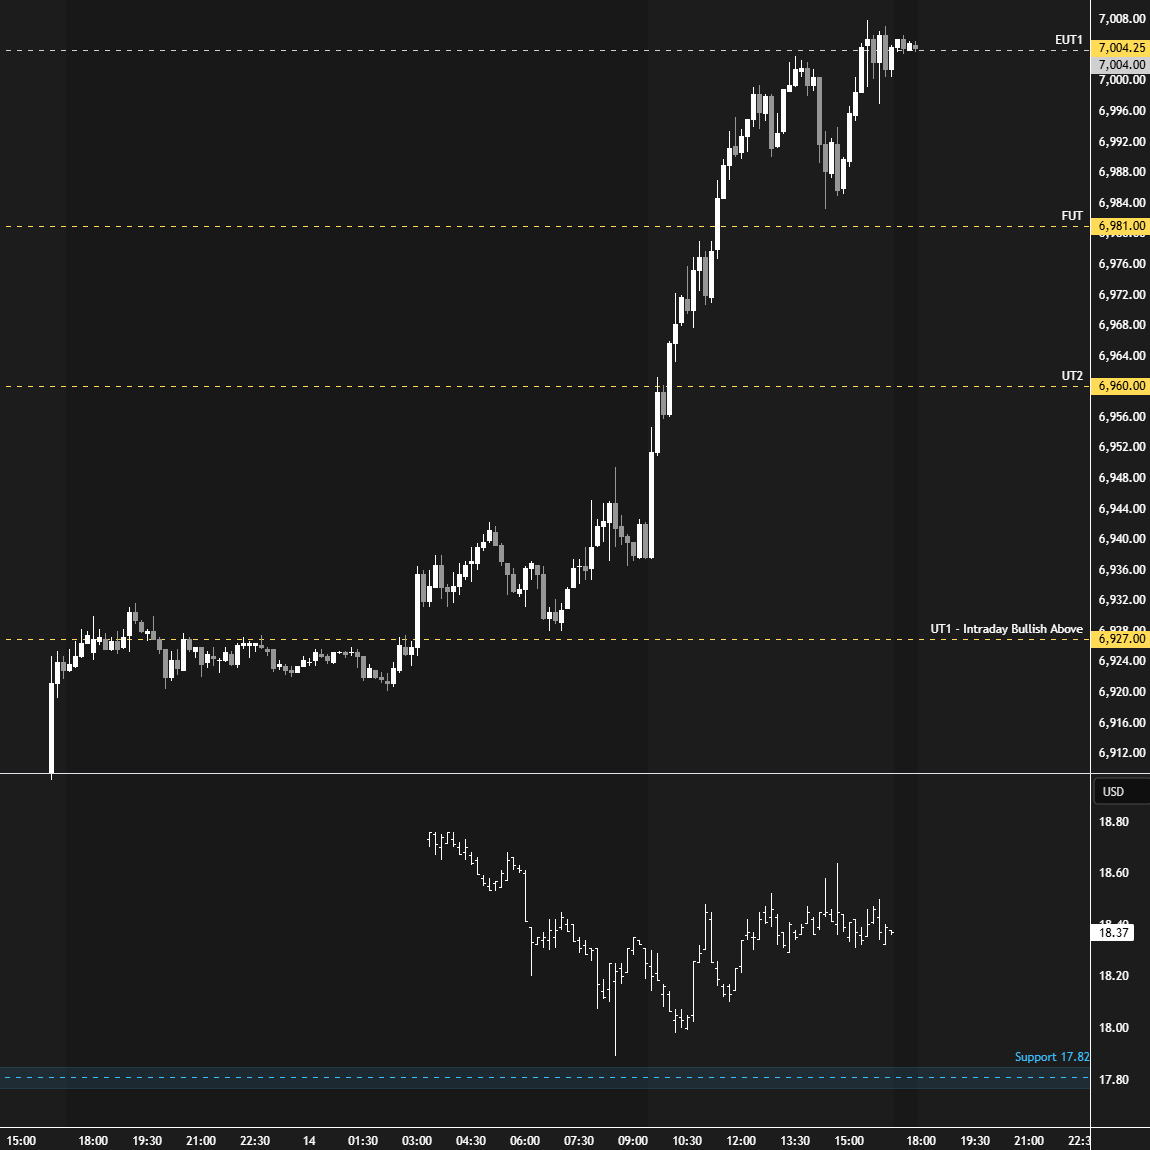
Today’s session didn’t leave much to analyze, as it was fairly straightforward. Buyers reclaimed 6927 overnight, signaling intraday strength, and after a pullback to 6928 during the European session, the auction never looked back. The RTH session opened on a true gap higher, with little to no trade below the opening level. UT2 at 6960 was tagged in the A-period, briefly stalling upside momentum before continuation unfolded in the B-period. The final upside target at 6981 was tagged and exceeded in the D-period, while the VIX notably held above its support level at 17.82, making it tricky to chase further upside. Overall, the session offered little opportunity for RTH traders. The only potential setup was the afternoon pullback in the J and K-period, but that would have meant entering above FUT, which is generally an unfavorable trade location.
Smashlevels Recap
After reclaiming the prior multi-week balance low at 6790 last week and defending it early this week, we are now approaching the balance highs (ATH), which act as a target area according to balance guidelines. The RTH ATH is at 7031, while we also have an untested overnight ATH at 7043 as unfinished business.
The session formed a P-shape (bullish imbalance) after a sustained true gap higher, with single prints in the B and D periods. Intraday strength would be indicated by a reclaim of 7043 (UT1), while weakness would be signaled by a break and hold below 6985 (DT1), today’s afternoon pullback low.
In terms of levels, the Smashlevel is 7005, the spike base. Holding above 7005 signals strength and targets the cluster of levels at 7031, 7035, and 7043 (UT1), with a final upside target at 7070 (FUT) under sustained buying pressure.
On the flip side, failure to hold 7005 would shift focus to the afternoon pullback low at 6985 (DT1). Acceptance below 6985 would signal intraday weakness and target 6961 (DT2), with a final downside target at 6924 (FDT), unfilled gap, under sustained selling pressure.
Visual Representation
Levels of Interest
Going into tomorrow’s session, I’ll closely observe the behavior around 7005.
Holding above 7005 would target 7031-43 / 7070
Break and hold below 7005 would target 6985 / 6961 / 6924
Additionally, pay attention to the following VIX levels: 19.48 and 17.24. These levels can provide confirmation of strength or weakness.
Break and hold above 7070 with VIX below 17.24 would confirm strength.
Break and hold below 6924 with VIX above 19.48 would confirm weakness.
Overall, it's important to exercise caution when trading outside of the highlighted yellow levels. A non-cooperative VIX may suggest possible reversals i.e trade setups.
Sentiment's a strange thing...last time we traded ES at 7000 fundamentals were cautiously optimistic. A few months later and just the glimmer of hope that things are getting less horrible than they have been the last few weeks and here we are again.
This is great stuff. Thank you 🙏🏾