
ES Daily Plan | April 14, 2026
Market Context & Key Levels for the Day Ahead

— For new subscribers
The yellow levels highlighted at the bottom left of the chart are the primary intraday levels I focus on. To avoid impulsive decisions at poor trade locations, I follow a simple but effective rule: exercise caution when initiating trades outside of these yellow levels.
This means I’m cautious about chasing longs above the Final Upside Target (FUT) and shorts below the Final Downside Target (FDT). It’s important to understand that not chasing does not imply initiating a trade in the opposite direction, discipline over impulse.
Be sure to review the Weekly Plan for a broader perspective, key levels, and market expectations for the week ahead.

Contextual Analysis & Plan
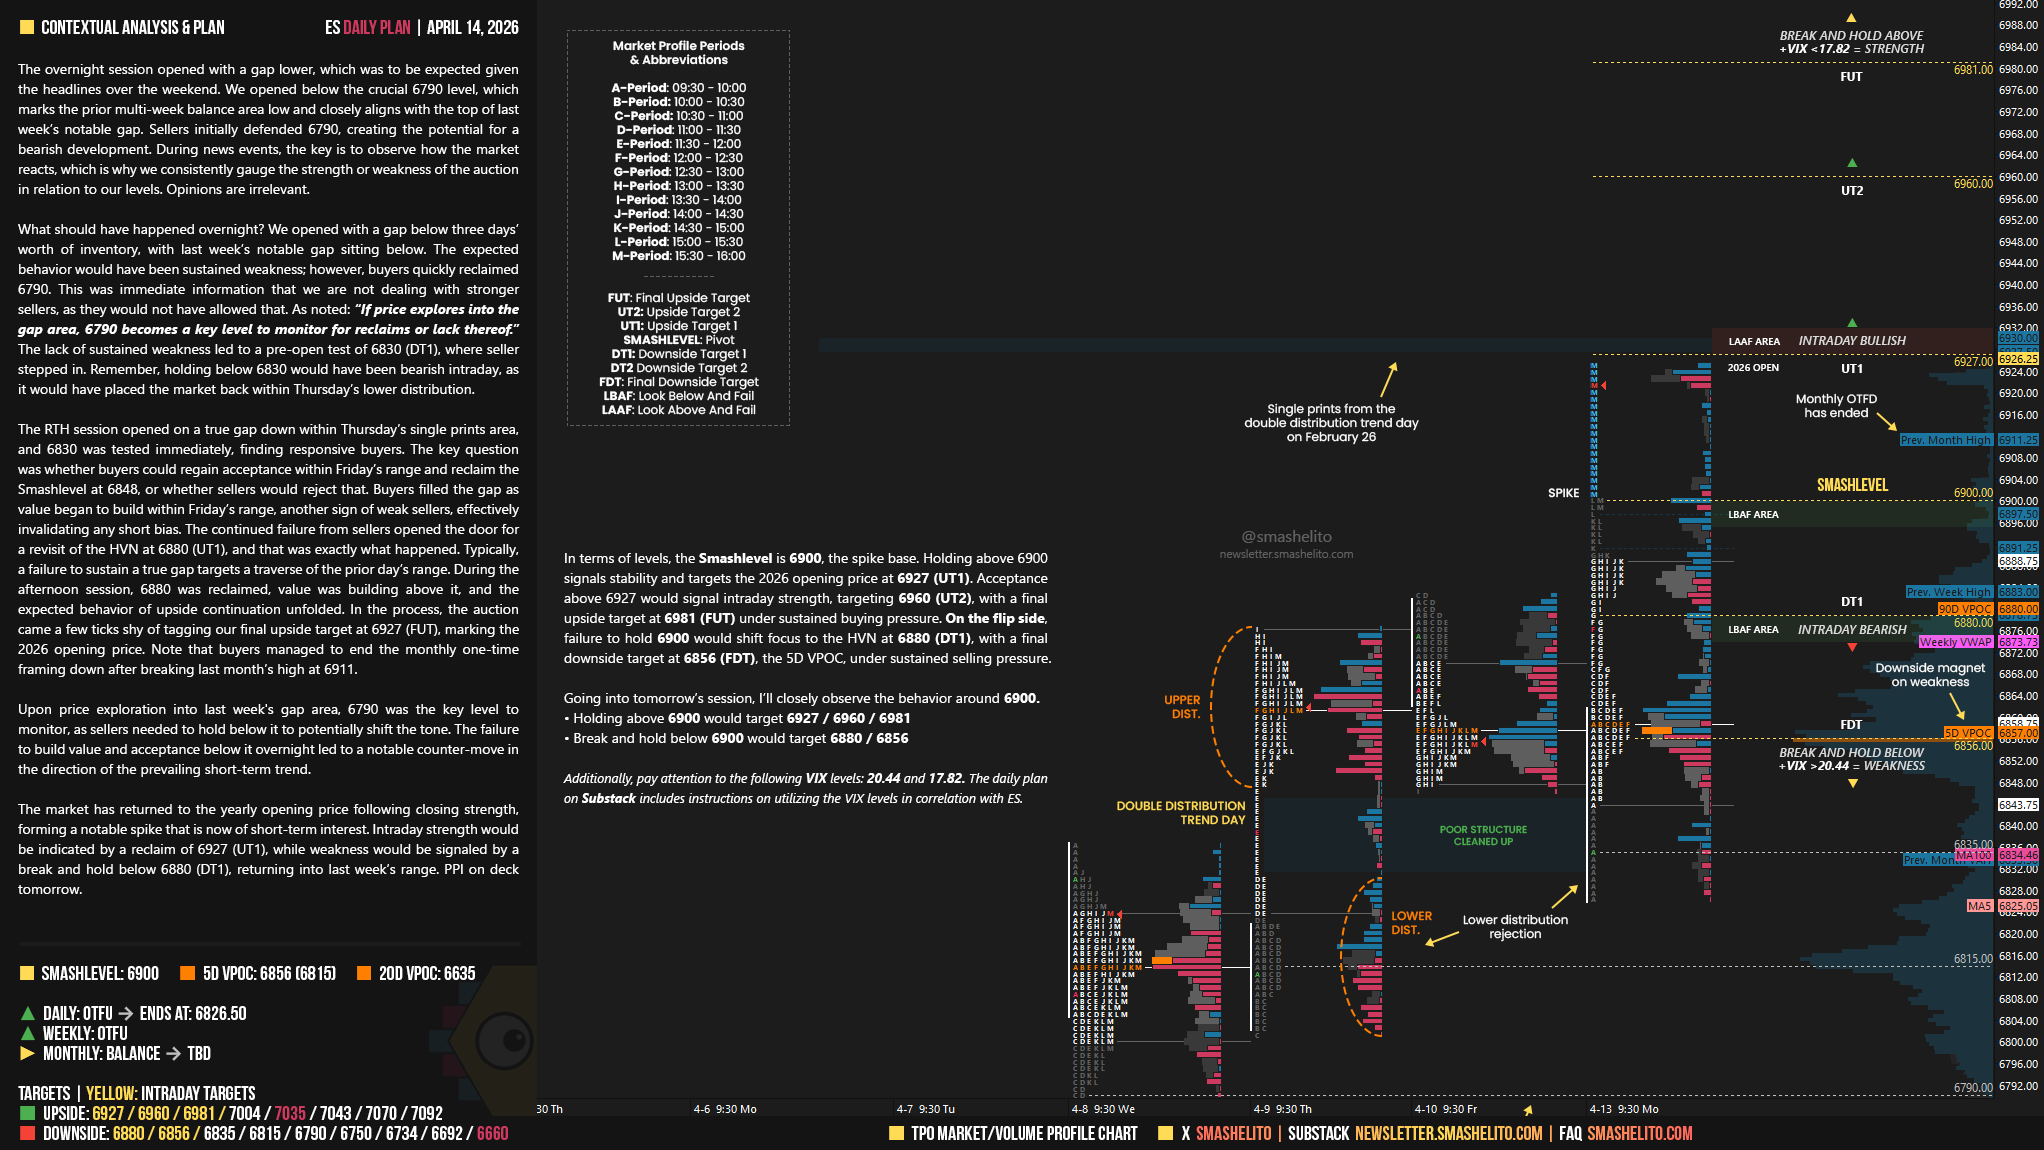
The overnight session opened with a gap lower, which was to be expected given the headlines over the weekend. We opened below the crucial 6790 level, which marks the prior multi-week balance area low and closely aligns with the top of last week’s notable gap. Sellers initially defended 6790, creating the potential for a bearish development. During news events, the key is to observe how the market reacts, which is why we consistently gauge the strength or weakness of the auction in relation to our levels. Opinions are irrelevant.
What should have happened overnight? We opened with a gap below three days’ worth of inventory, with last week’s notable gap sitting below. The expected behavior would have been sustained weakness; however, buyers quickly reclaimed 6790. This was immediate information that we are not dealing with stronger sellers, as they would not have allowed that. As noted: “If price explores into the gap area, 6790 becomes a key level to monitor for reclaims or lack thereof.” The lack of sustained weakness led to a pre-open test of 6830 (DT1), where seller stepped in. Remember, holding below 6830 would have been bearish intraday, as it would have placed the market back within Thursday’s lower distribution.
The RTH session opened on a true gap down within Thursday’s single prints area, and 6830 was tested immediately, finding responsive buyers. The key question was whether buyers could regain acceptance within Friday’s range and reclaim the Smashlevel at 6848, or whether sellers would reject that. Buyers filled the gap as value began to build within Friday’s range, another sign of weak sellers, effectively invalidating any short bias. The continued failure from sellers opened the door for a revisit of the HVN at 6880 (UT1), and that was exactly what happened. Typically, a failure to sustain a true gap targets a traverse of the prior day’s range. During the afternoon session, 6880 was reclaimed, value was building above it, and the expected behavior of upside continuation unfolded. In the process, the auction came a few ticks shy of tagging our final upside target at 6927 (FUT), marking the 2026 opening price. Note that buyers managed to end the monthly one-time framing down after breaking last month’s high at 6911.
Smashlevels Recap

Upon price exploration into last week’s gap area, 6790 was the key level to monitor, as sellers needed to hold below it to potentially shift the tone. The failure to build value and acceptance below it overnight led to a notable counter-move in the direction of the prevailing short-term trend.
The market has returned to the yearly opening price following closing strength, forming a notable spike that is now of short-term interest. Intraday strength would be indicated by a reclaim of 6927 (UT1), while weakness would be signaled by a break and hold below 6880 (DT1), returning into last week’s range. PPI on deck tomorrow.
In terms of levels, the Smashlevel is 6900, the spike base. Holding above 6900 signals stability and targets the 2026 opening price at 6927 (UT1). Acceptance above 6927 would signal intraday strength, targeting 6960 (UT2), with a final upside target at 6981 (FUT) under sustained buying pressure.
On the flip side, failure to hold 6900 would shift focus to the HVN at 6880 (DT1), with a final downside target at 6856 (FDT), the 5D VPOC, under sustained selling pressure.
Visual Representation
Levels of Interest
Going into tomorrow’s session, I’ll closely observe the behavior around 6900.
Holding above 6900 would target 6927 / 6960 / 6981
Break and hold below 6900 would target 6880 / 6856
Additionally, pay attention to the following VIX levels: 20.44 and 17.82. These levels can provide confirmation of strength or weakness.
Break and hold above 6981 with VIX below 17.82 would confirm strength.
Break and hold below 6856 with VIX above 20.44 would confirm weakness.
Overall, it's important to exercise caution when trading outside of the highlighted yellow levels. A non-cooperative VIX may suggest possible reversals i.e trade setups.
Thanks Smash! Great stuff.
Is daily in 3 day balance since we broke fridays low?