
ES Daily Plan | April 13, 2026
Market Context & Key Levels for the Day Ahead

— For new subscribers
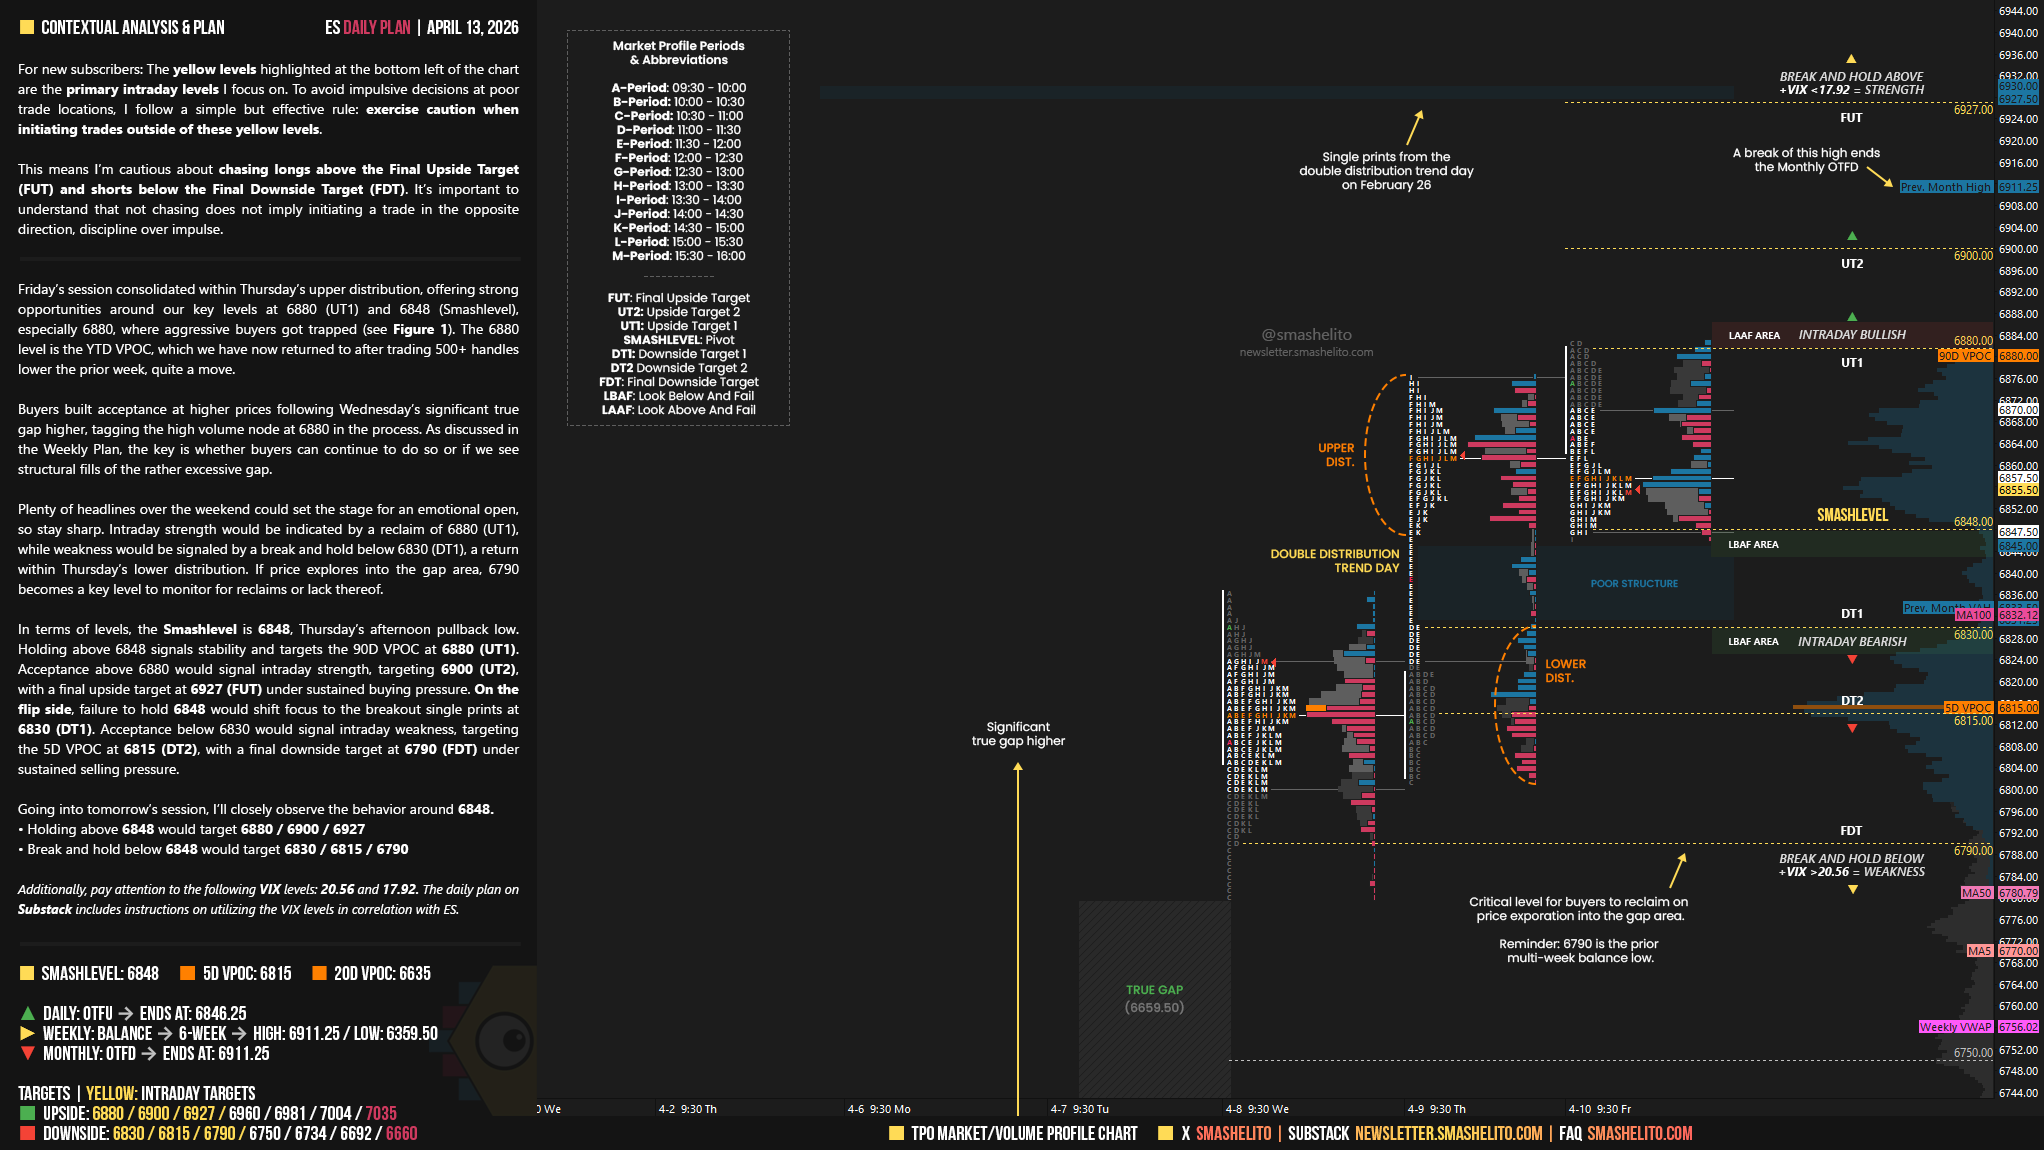
The yellow levels highlighted at the bottom left of the chart are the primary intraday levels I focus on. To avoid impulsive decisions at poor trade locations, I follow a simple but effective rule: exercise caution when initiating trades outside of these yellow levels.
This means I’m cautious about chasing longs above the Final Upside Target (FUT) and shorts below the Final Downside Target (FDT). It’s important to understand that not chasing does not imply initiating a trade in the opposite direction, discipline over impulse.
Be sure to review the Weekly Plan for a broader perspective, key levels, and market expectations for the week ahead.

Contextual Analysis & Plan
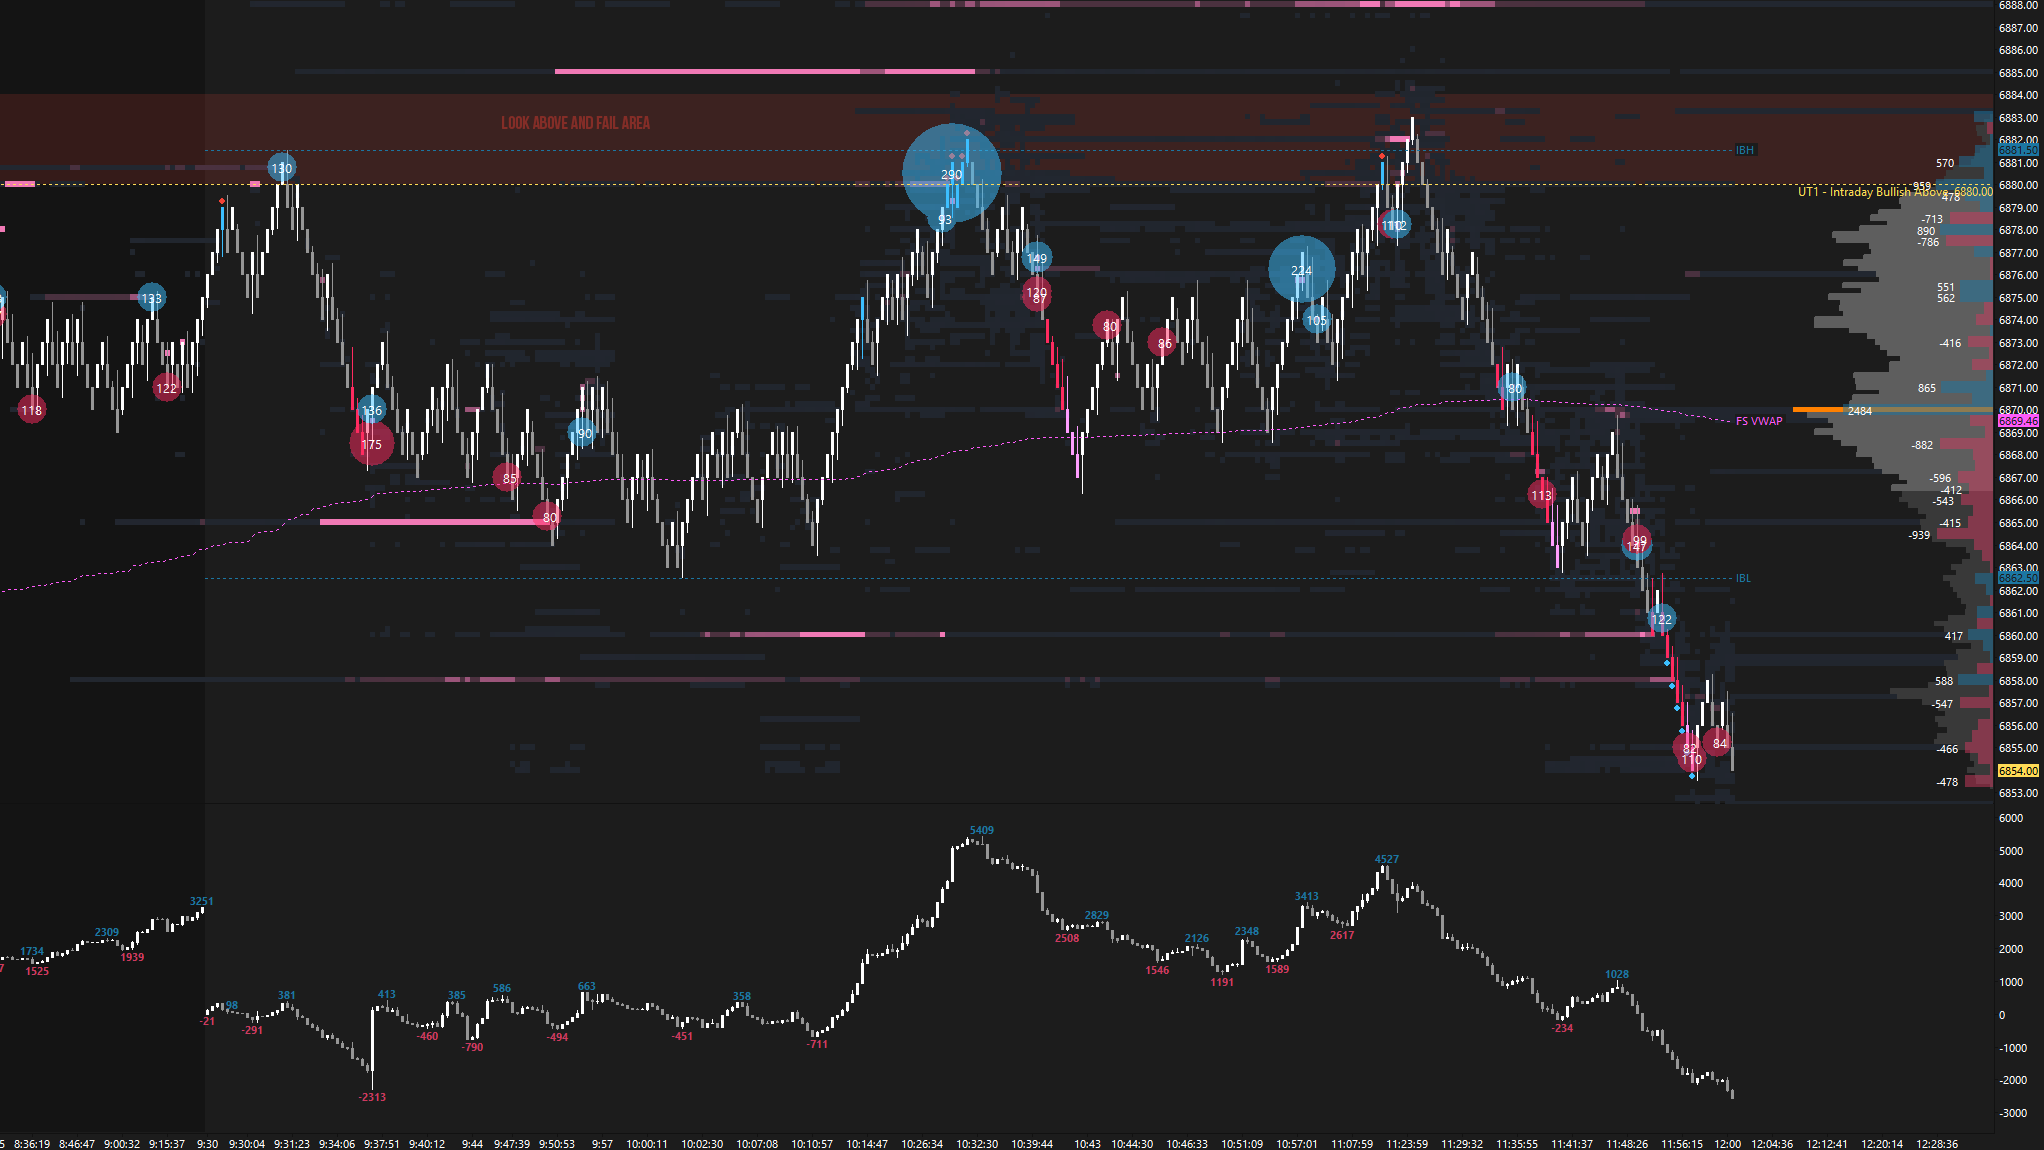
Friday’s session consolidated within Thursday’s upper distribution, offering strong opportunities around our key levels at 6880 (UT1) and 6848 (Smashlevel), especially 6880, where aggressive buyers got trapped (see Figure 1). The 6880 level is the YTD VPOC, which we have now returned to after trading 500+ handles lower the prior week, quite a move.
Smashlevels Recap
Buyers built acceptance at higher prices following Wednesday’s significant true gap higher, tagging the high volume node at 6880 in the process. As discussed in the Weekly Plan, the key is whether buyers can continue to do so or if we see structural fills of the rather excessive gap.
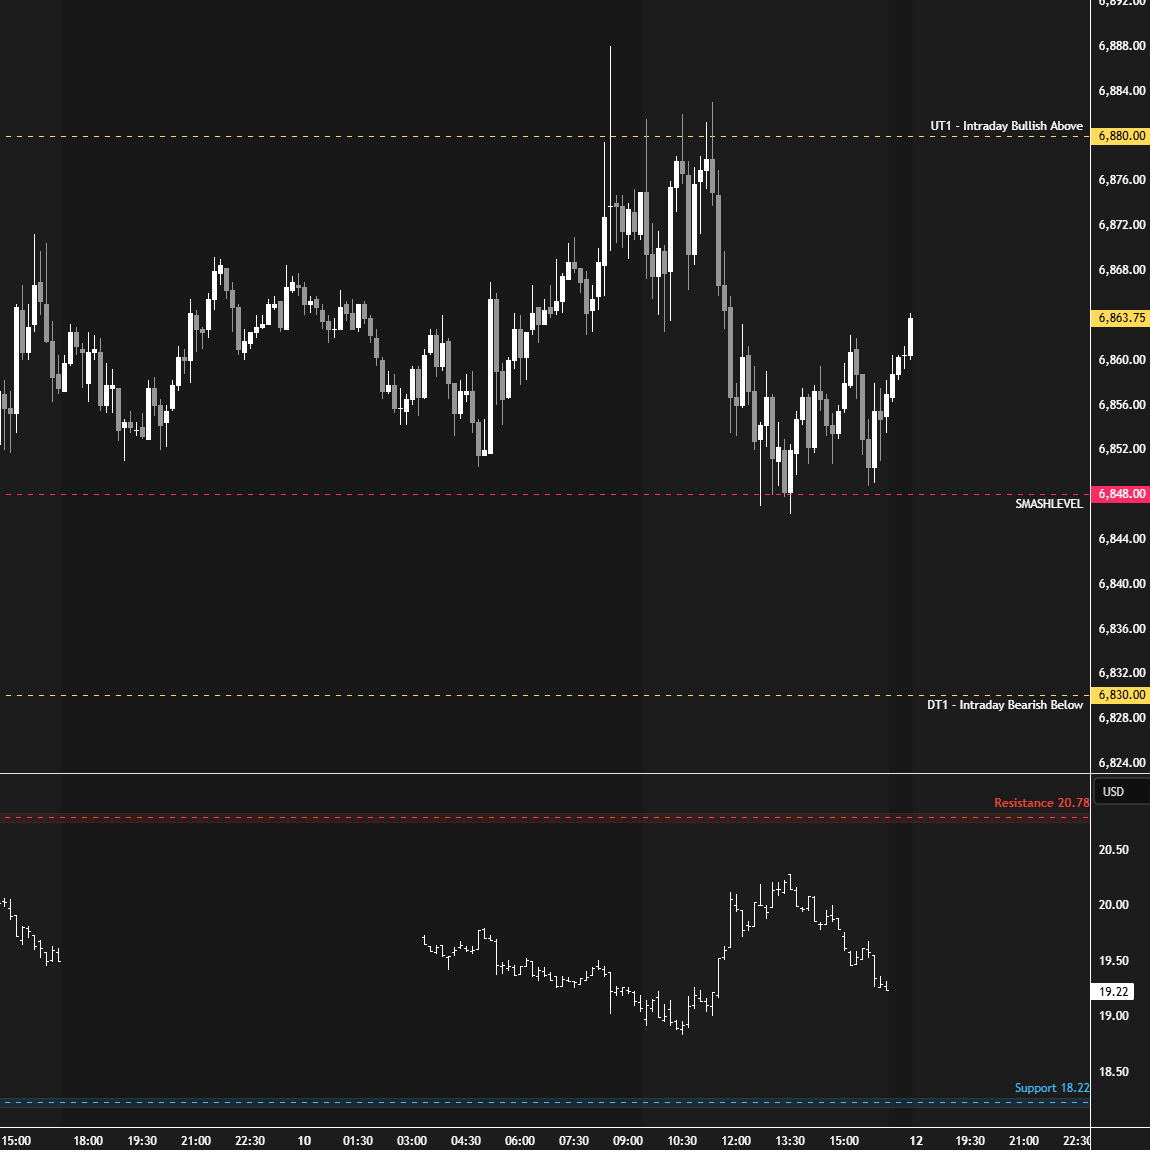
Plenty of headlines over the weekend could set the stage for an emotional open, so stay sharp. Intraday strength would be indicated by a reclaim of 6880 (UT1), while weakness would be signaled by a break and hold below 6830 (DT1), a return within Thursday’s lower distribution.
If price explores into the gap area, 6790 becomes a key level to monitor for reclaims or lack thereof.
In terms of levels, the Smashlevel is 6848, Thursday’s afternoon pullback low. Holding above 6848 signals stability and targets the 90D VPOC at 6880 (UT1). Acceptance above 6880 would signal intraday strength, targeting 6900 (UT2), with a final upside target at 6927 (FUT) under sustained buying pressure.
On the flip side, failure to hold 6848 would shift focus to the breakout single prints at 6830 (DT1). Acceptance below 6830 would signal intraday weakness, targeting the 5D VPOC at 6815 (DT2), with a final downside target at 6790 (FDT) under sustained selling pressure.
Visual Representation
Levels of Interest
Going into tomorrow’s session, I’ll closely observe the behavior around 6848.
Holding above 6848 would target 6880 / 6900 / 6927
Break and hold below 6848 would target 6830 / 6815 / 6790
Additionally, pay attention to the following VIX levels: 20.56 and 17.92. These levels can provide confirmation of strength or weakness.
Break and hold above 6927 with VIX below 17.92 would confirm strength.
Break and hold below 6790 with VIX above 20.56 would confirm weakness.
Overall, it's important to exercise caution when trading outside of the highlighted yellow levels. A non-cooperative VIX may suggest possible reversals i.e trade setups.
Thank you!
Thanks Smash!