
ES Daily Plan | April 10, 2026
Market Context & Key Levels for the Day Ahead

— For new subscribers
The yellow levels highlighted at the bottom left of the chart are the primary intraday levels I focus on. To avoid impulsive decisions at poor trade locations, I follow a simple but effective rule: exercise caution when initiating trades outside of these yellow levels.
This means I’m cautious about chasing longs above the Final Upside Target (FUT) and shorts below the Final Downside Target (FDT). It’s important to understand that not chasing does not imply initiating a trade in the opposite direction, discipline over impulse.
Be sure to review the Weekly Plan for a broader perspective, key levels, and market expectations for the week ahead.

Contextual Analysis & Plan
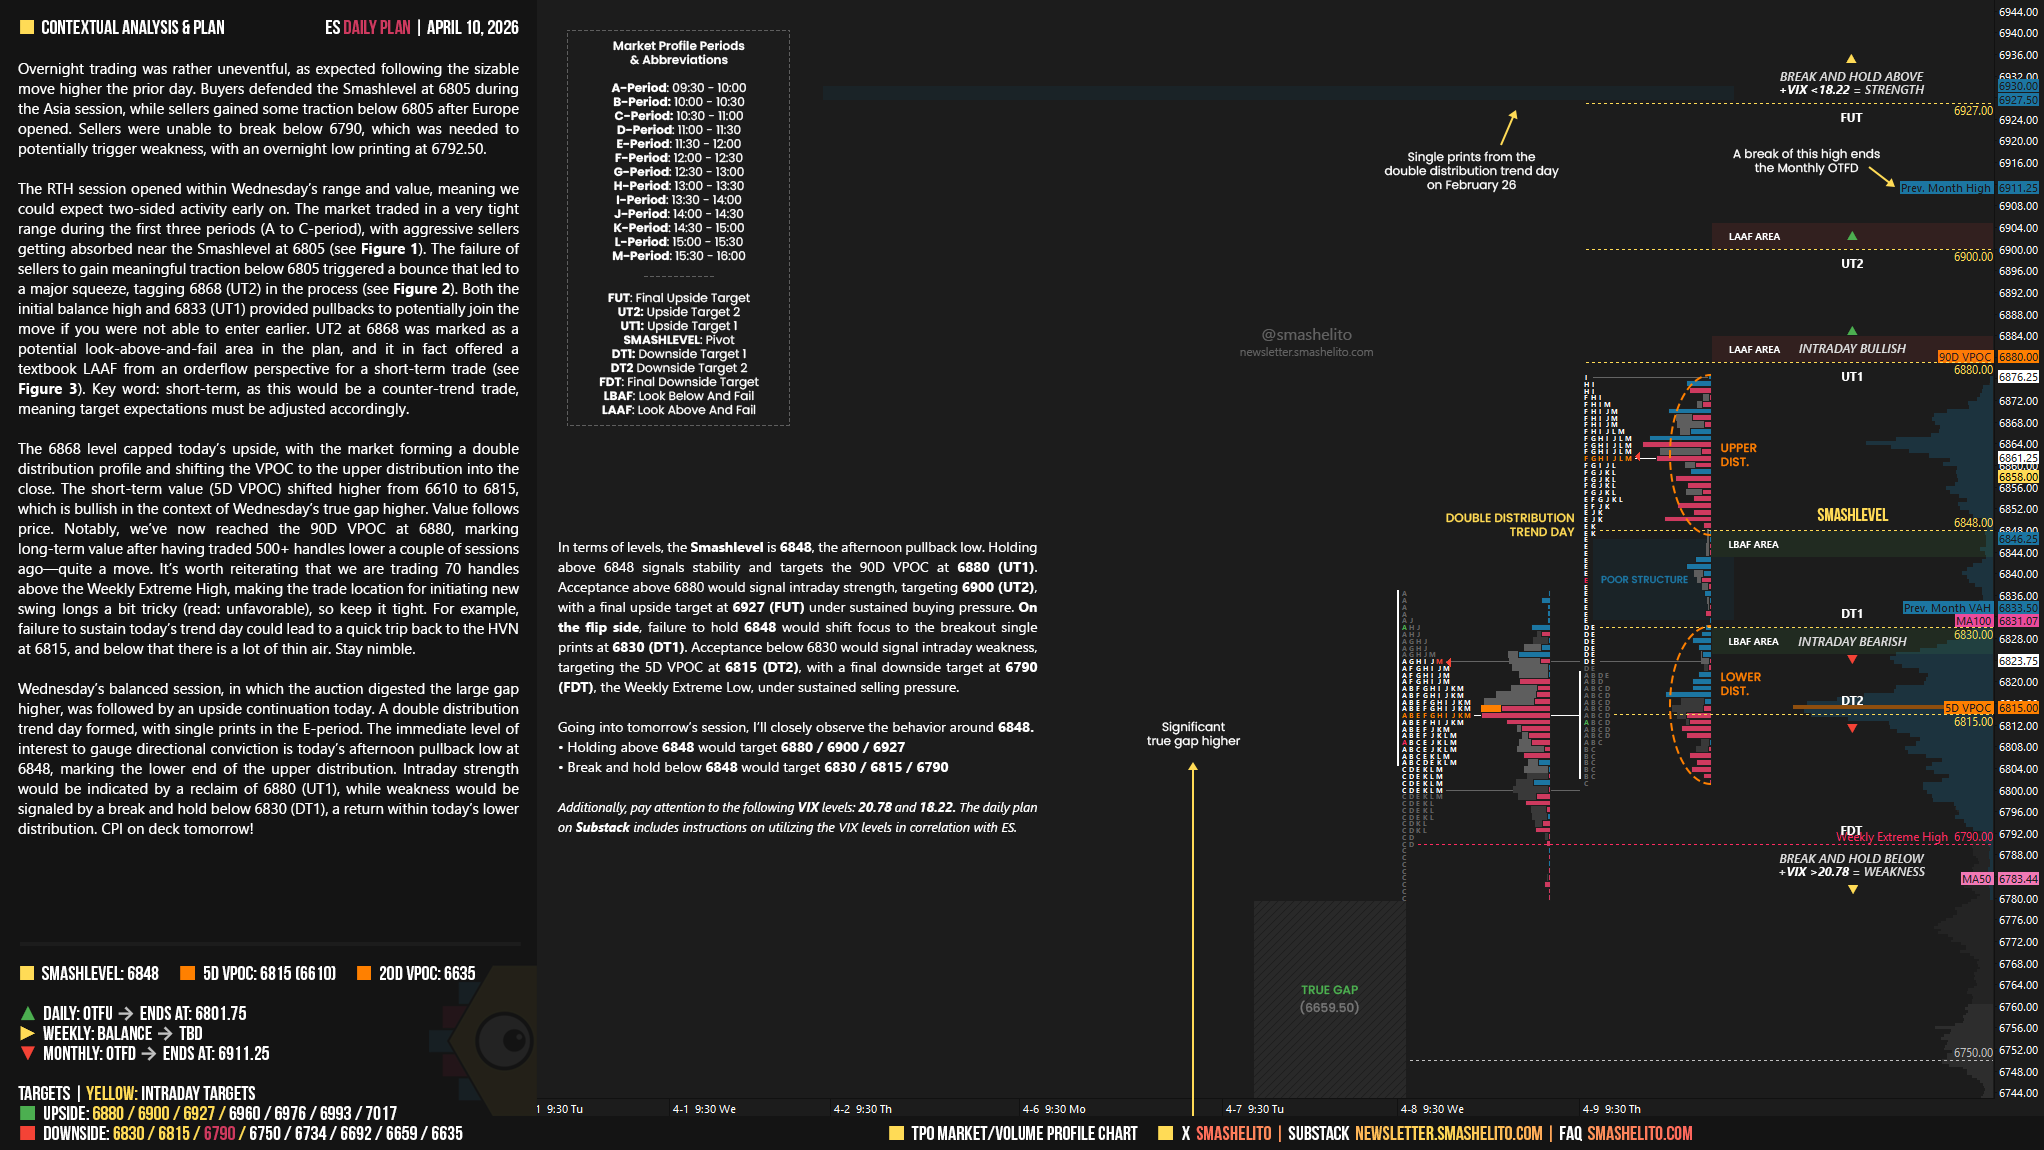
Overnight trading was rather uneventful, as expected following the sizable move higher the prior day. Buyers defended the Smashlevel at 6805 during the Asia session, while sellers gained some traction below 6805 after Europe opened. Sellers were unable to break below 6790, which was needed to potentially trigger weakness, with an overnight low printing at 6792.50.
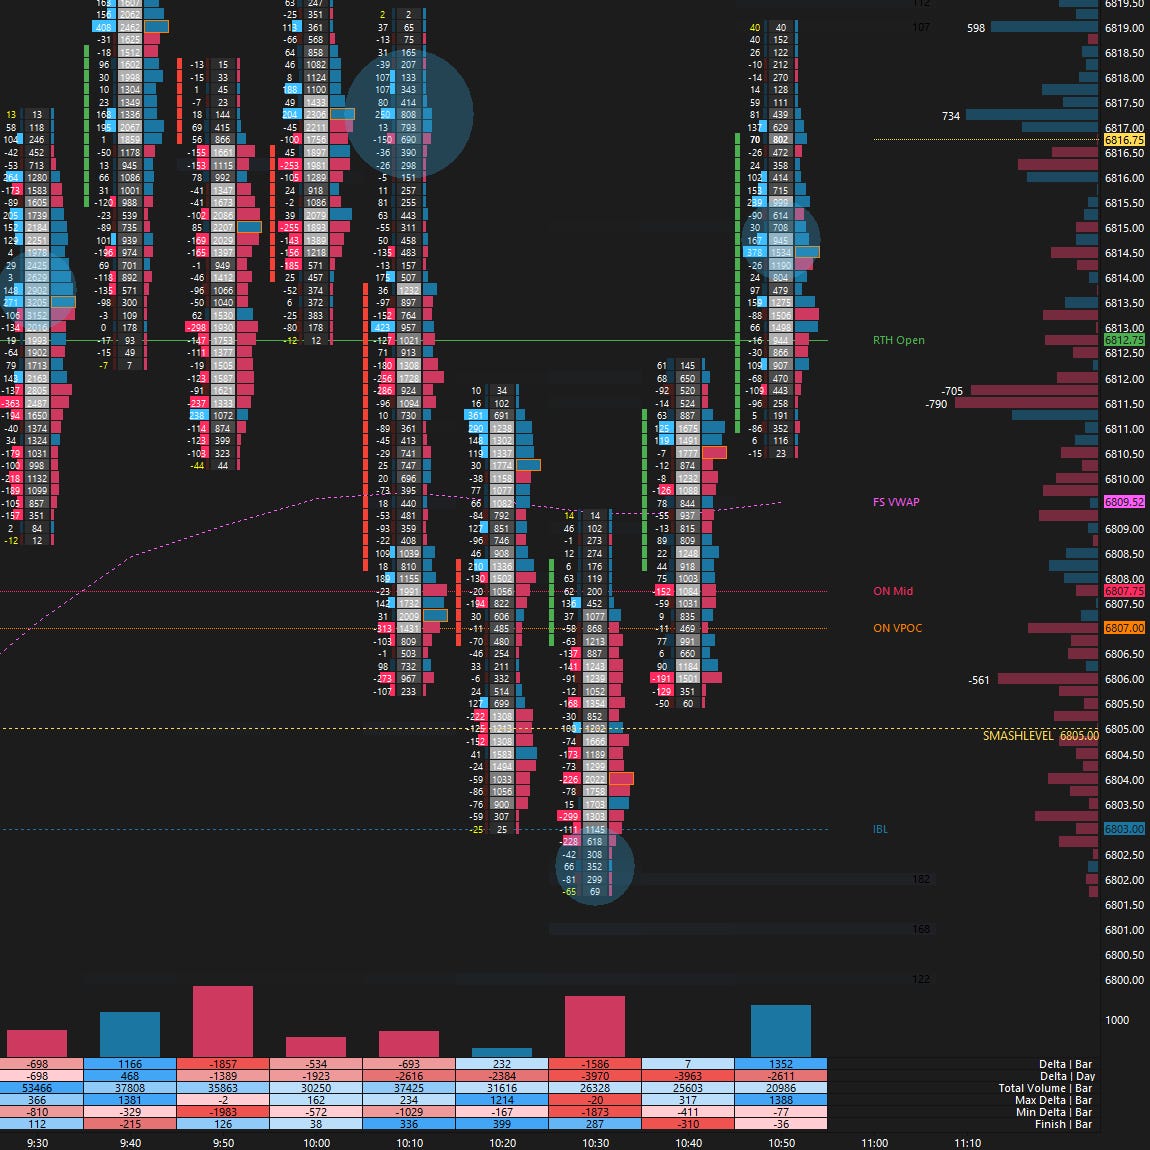
The RTH session opened within Wednesday’s range and value, meaning we could expect two-sided activity early on. The market traded in a very tight range during the first three periods (A to C-period), with aggressive sellers getting absorbed near the Smashlevel at 6805 (see Figure 1).
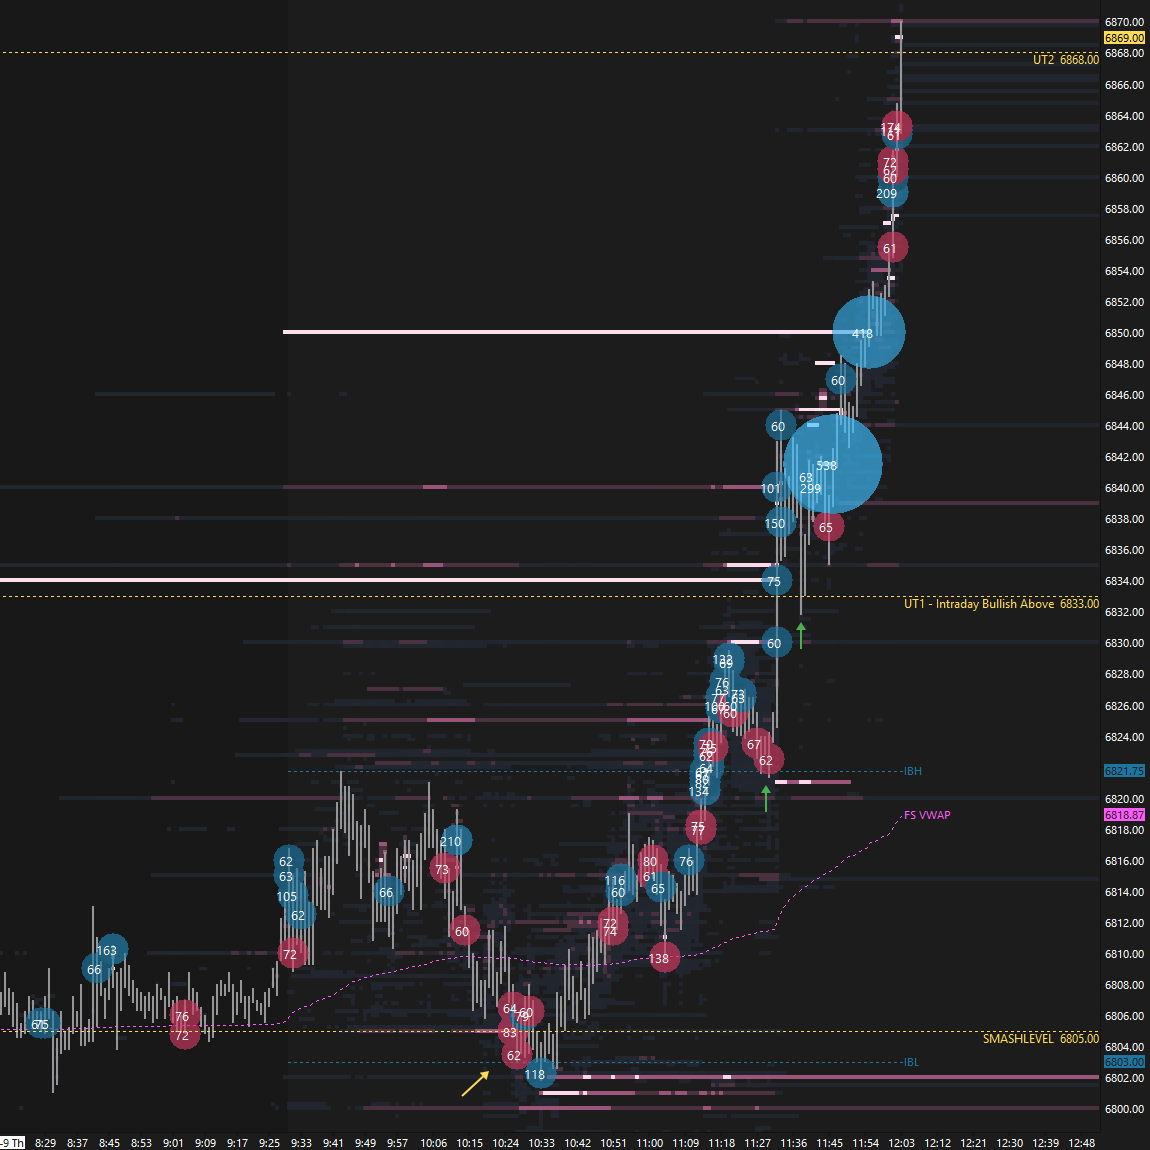
The failure of sellers to gain meaningful traction below 6805 triggered a bounce that led to a major squeeze, tagging 6868 (UT2) in the process (see Figure 2).
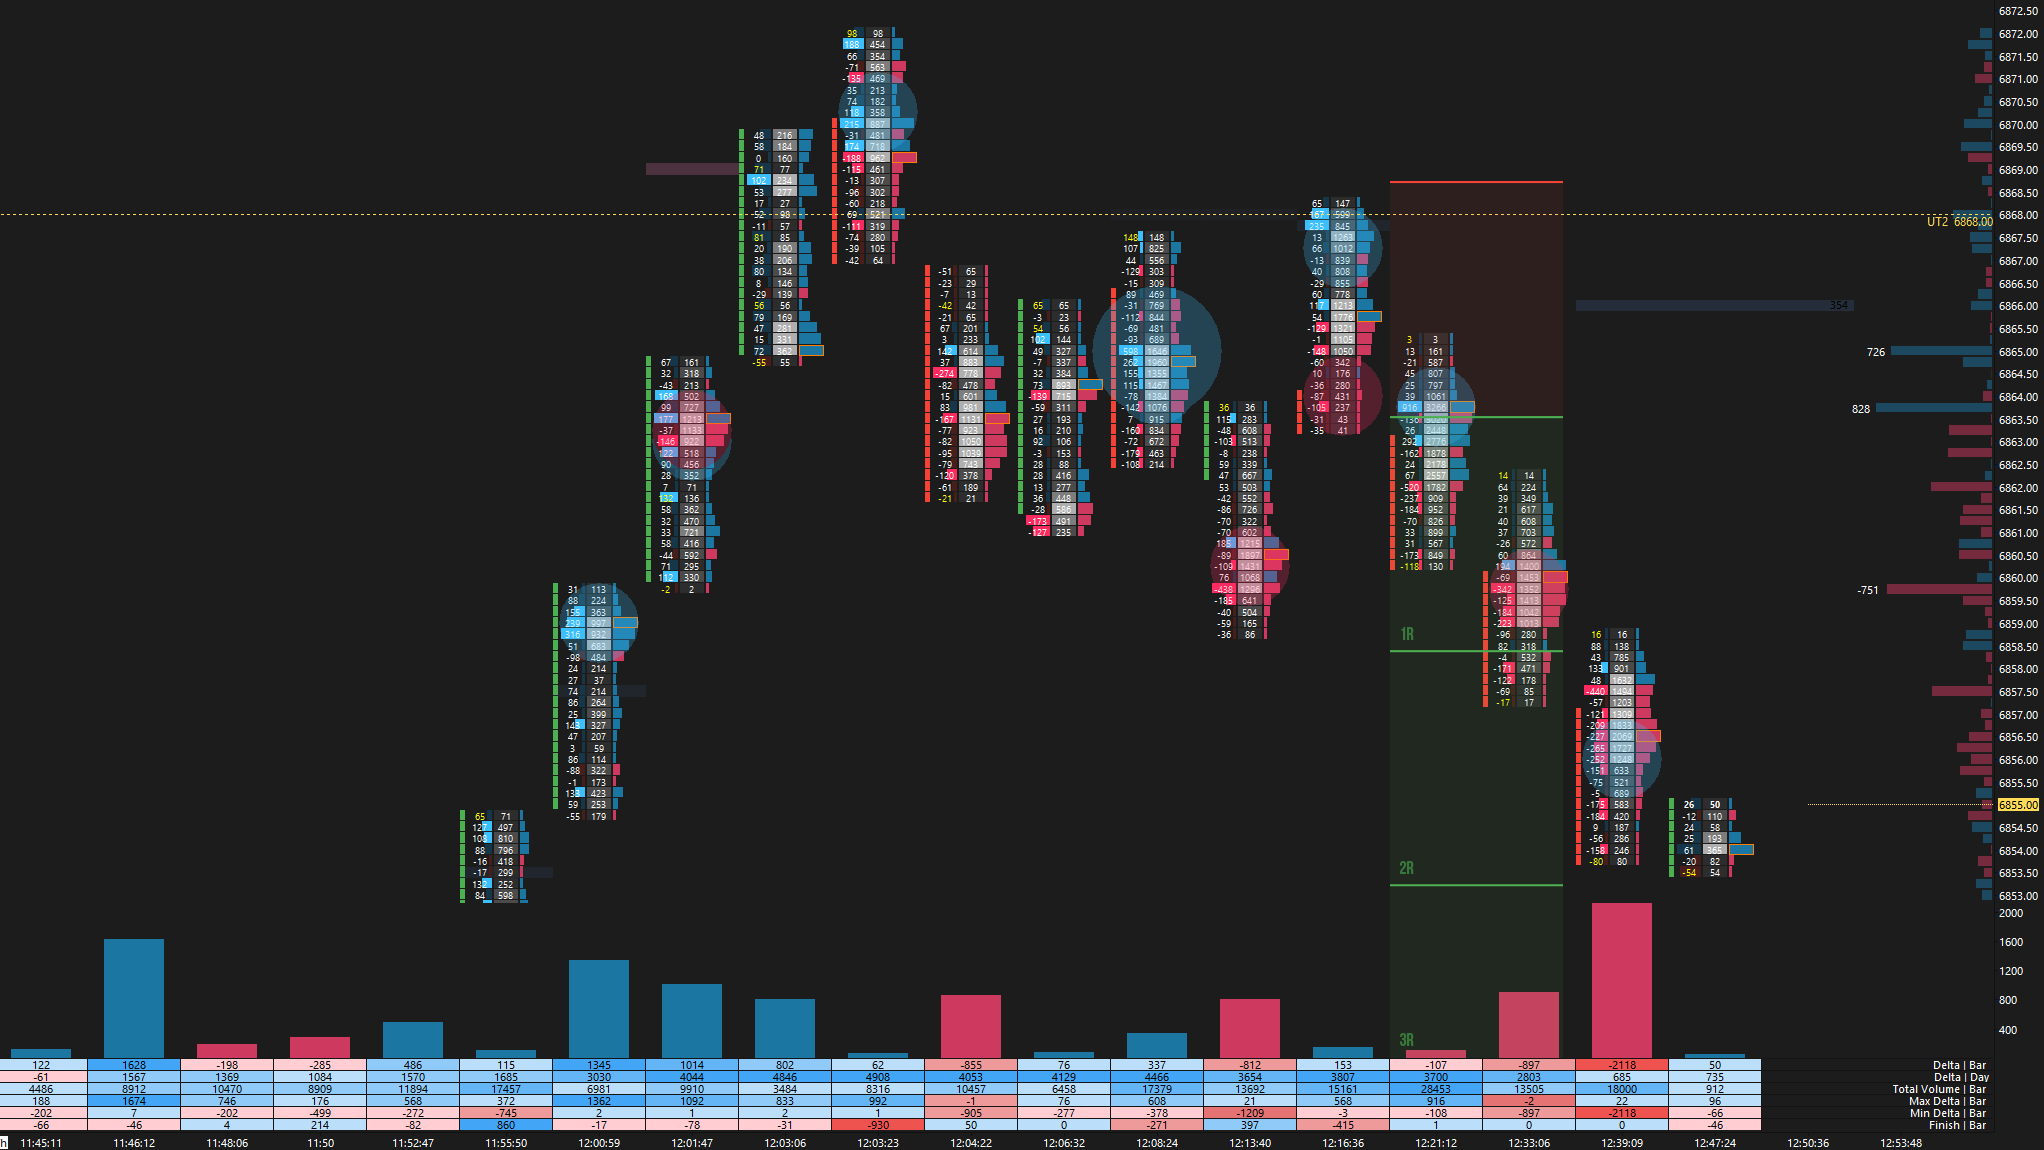
Both the initial balance high and 6833 (UT1) provided pullbacks to potentially join the move if you were not able to enter earlier. UT2 at 6868 was marked as a potential look-above-and-fail area in the plan, and it in fact offered a textbook LAAF from an orderflow perspective for a short-term trade (see Figure 3). Key word: short-term, as this would be a counter-trend trade, meaning target expectations must be adjusted accordingly.
The 6868 level capped today’s upside, with the market forming a double distribution profile and shifting the VPOC to the upper distribution into the close. The short-term value (5D VPOC) shifted higher from 6610 to 6815, which is bullish in the context of Wednesday’s true gap higher. Value follows price. Notably, we’ve now reached the 90D VPOC at 6880, marking long-term value after having traded 500+ handles lower a couple of sessions ago—quite a move. It’s worth reiterating that we are trading 70 handles above the Weekly Extreme High, making the trade location for initiating new swing longs a bit tricky (read: unfavorable), so keep it tight. For example, failure to sustain today’s trend day could lead to a quick trip back to the HVN at 6815, and below that there is a lot of thin air. Stay nimble.
Smashlevels Recap
Wednesday’s balanced session, in which the auction digested the large gap higher, was followed by an upside continuation today. A double distribution trend day formed, with single prints in the E-period.
The immediate level of interest to gauge directional conviction is today’s afternoon pullback low at 6848, marking the lower end of the upper distribution. Intraday strength would be indicated by a reclaim of 6880 (UT1), while weakness would be signaled by a break and hold below 6830 (DT1), a return within today’s lower distribution. CPI on deck tomorrow!
In terms of levels, the Smashlevel is 6848, the afternoon pullback low. Holding above 6848 signals stability and targets the 90D VPOC at 6880 (UT1). Acceptance above 6880 would signal intraday strength, targeting 6900 (UT2), with a final upside target at 6927 (FUT) under sustained buying pressure.
On the flip side, failure to hold 6848 would shift focus to the breakout single prints at 6830 (DT1). Acceptance below 6830 would signal intraday weakness, targeting the 5D VPOC at 6815 (DT2), with a final downside target at 6790 (FDT), the Weekly Extreme Low, under sustained selling pressure.
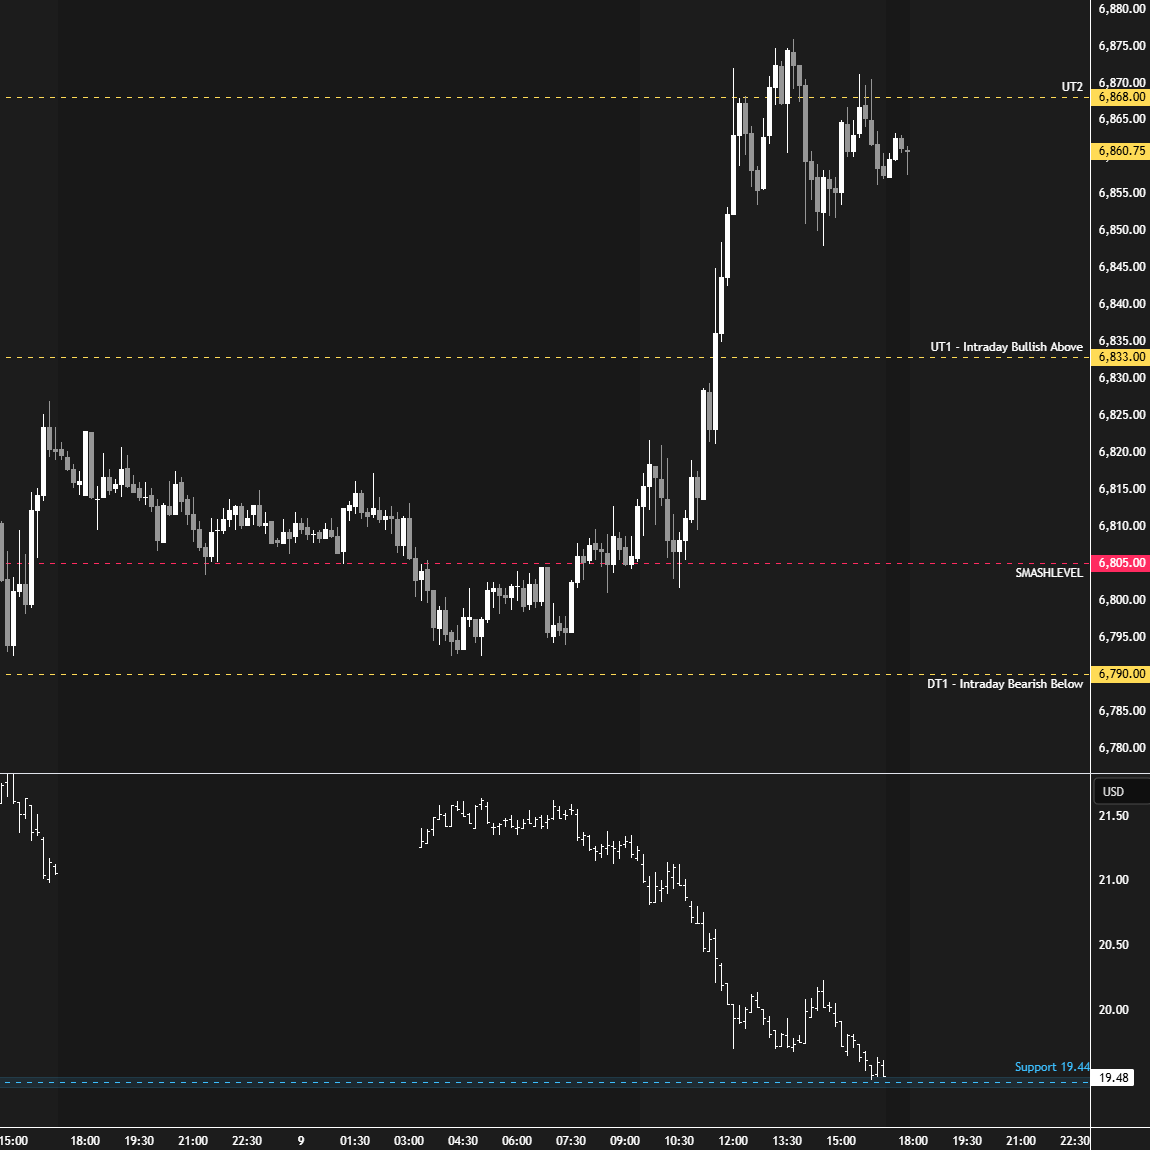
Visual Representation
Levels of Interest
Going into tomorrow’s session, I’ll closely observe the behavior around 6848.
Holding above 6848 would target 6880 / 6900 / 6927
Break and hold below 6848 would target 6830 / 6815 / 6790
Additionally, pay attention to the following VIX levels: 20.78 and 18.22. These levels can provide confirmation of strength or weakness.
Break and hold above 6927 with VIX below 18.22 would confirm strength.
Break and hold below 6790 with VIX above 20.78 would confirm weakness.
Overall, it's important to exercise caution when trading outside of the highlighted yellow levels. A non-cooperative VIX may suggest possible reversals i.e trade setups.
Still can’t believe your newsletter is free. Your work is incredible, Smash!
Just found this channel and this is a fantastic write-up. Thank you for your time!