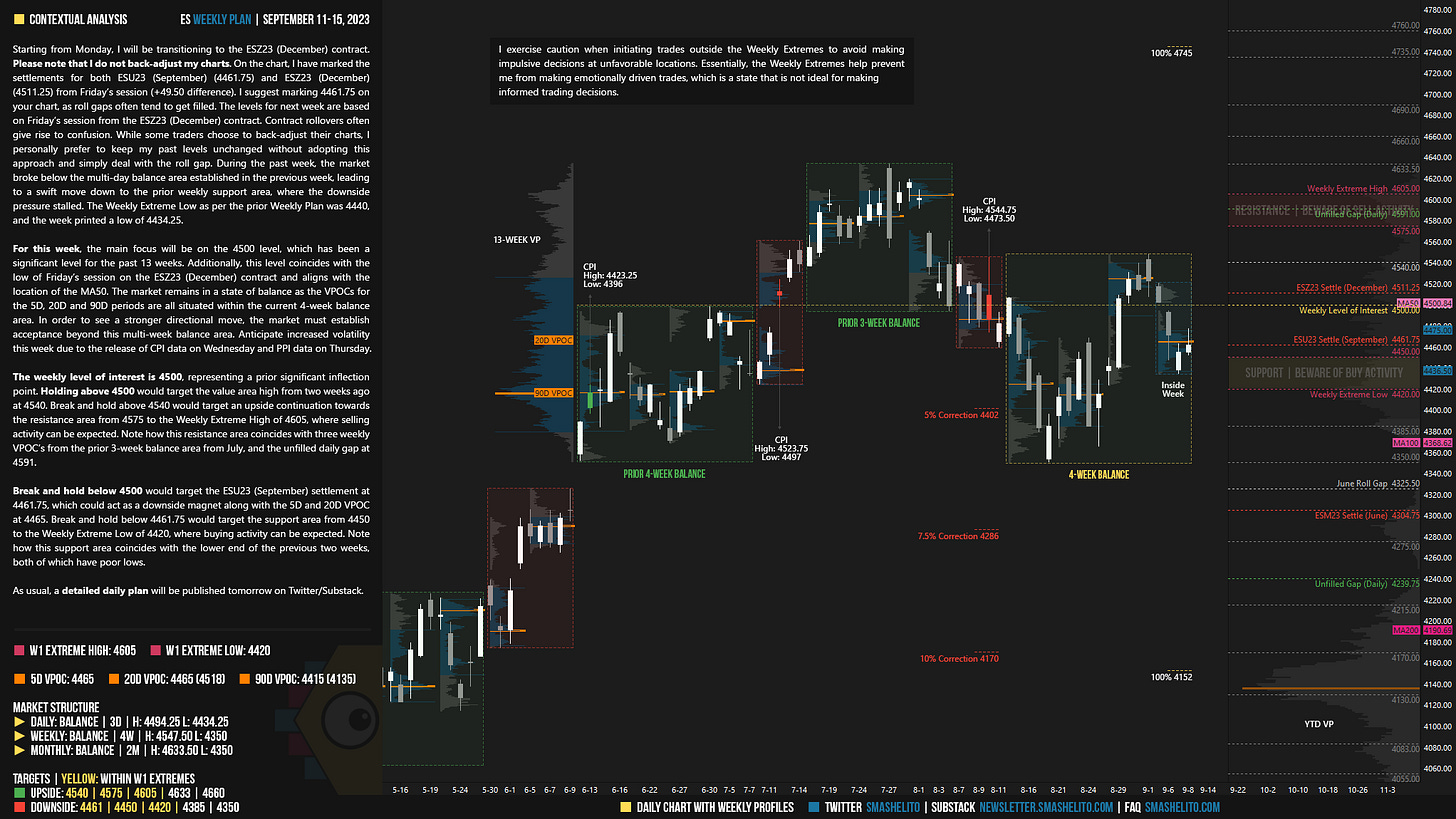
ES Weekly Plan | September 11-15, 2023
Below are my expectations for the week ahead.
🟨 Daily: BALANCE | 3D | H: 4494.25 L: 4434.25
🟨 Weekly: BALANCE | 4W | H: 4547.50 L: 4350
🟨 Monthly: BALANCE | 2M | H: 4633.50 L: 4350
Weekly Extreme High: 4605
Weekly Extreme Low: 4420
As usual, a detailed daily plan will be published tomorrow.
Starting from Monday, I will be transitioning to the ESZ23 (December) contract. Please note that I do not back-adjust my charts. On the chart, I have marked the settlements for both ESU23 (September) (4461.75) and ESZ23 (December) (4511.25) from Friday’s session (+49.50 difference). I suggest marking 4461.75 on your chart, as roll gaps often tend to get filled. The levels for next week are based on Friday’s session from the ESZ23 (December) contract. Contract rollovers often give rise to confusion. While some traders choose to back-adjust their charts, I personally prefer to keep my past levels unchanged without adopting this approach and simply deal with the roll gap. During the past week, the market broke below the multi-day balance area established in the previous week, leading to a swift move down to the prior weekly support area, where the downside pressure stalled. The Weekly Extreme Low as per the prior Weekly Plan was 4440, and the week printed a low of 4434.25.

For this week, the main focus will be on the 4500 level, which has been a significant level for the past 13 weeks. Additionally, this level coincides with the low of Friday’s session on the ESZ23 (December) contract and aligns with the location of the MA50. The market remains in a state of balance as the VPOCs for the 5D, 20D and 90D periods are all situated within the current 4-week balance area. In order to see a stronger directional move, the market must establish acceptance beyond this multi-week balance area. Anticipate increased volatility this week due to the release of CPI data on Wednesday and PPI data on Thursday.
The weekly level of interest is 4500, representing a prior significant inflection point. Holding above 4500 would target the value area high from two weeks ago at 4540. Break and hold above 4540 would target an upside continuation towards the resistance area from 4575 to the Weekly Extreme High of 4605, where selling activity can be expected. Note how this resistance area coincides with three weekly VPOC’s from the prior 3-week balance area from July, and the unfilled daily gap at 4591.
Break and hold below 4500 would target the ESU23 (September) settlement at 4461.75, which could act as a downside magnet along with the 5D and 20D VPOC at 4465. Break and hold below 4461.75 would target the support area from 4450 to the Weekly Extreme Low of 4420, where buying activity can be expected. Note how this support area coincides with the lower end of the previous two weeks, both of which have poor lows.
🟩 Upside: 4540 | 4575 | 4605 | 4633 | 4660
🟥 Downside: 4461 | 4450 | 4420 | 4385 | 4350
Economic Calendar
Disclaimer: Futures and options trading involves a high level of risk, with the potential for substantial losses. The information provided in this newsletter is for informational purposes only and is not intended to be a trade recommendation. It is the responsibility of the reader to make their own investment decisions and they should seek the advice of a qualified securities professional before making any investments. The owners/authors of this newsletter are not certified as registered financial professionals or investment advisers.


Thanks Smash. I've been trying to figure out how people see the market in balance across multiple time-frames and you give a description of this in the "For this week" section. Think I'm finally starting to wrap my head around it.
Thank you, buddy—a great job, as always.