ES Weekly Plan | October 14-18, 2024
My expectations for the upcoming week.
Visual Representation
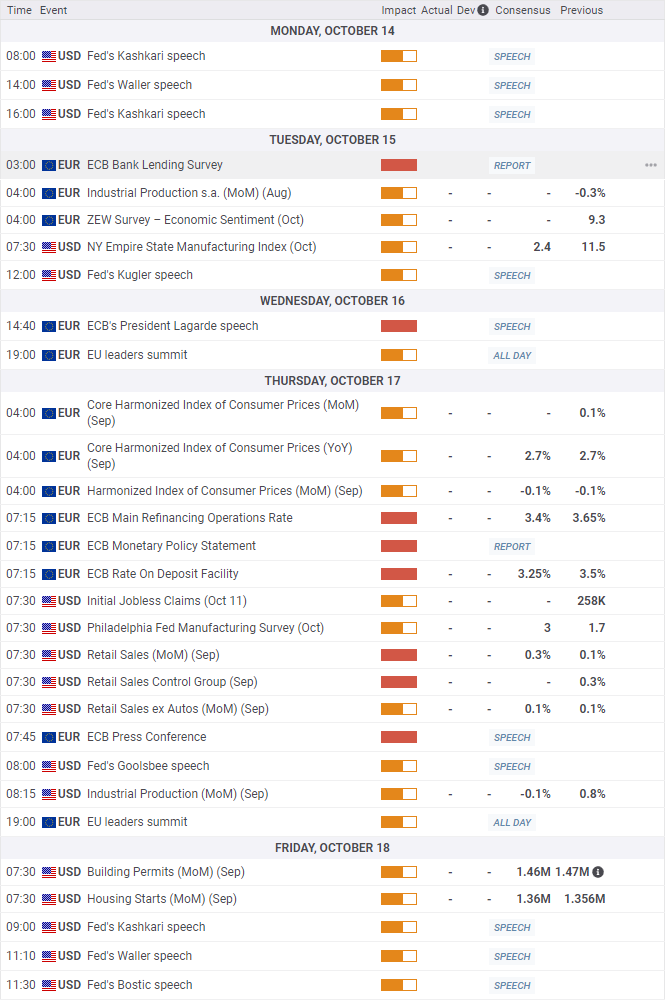
Economic Calendar
Market Structure
🟩 DAILY: OTFU | ENDS: 5823.25
🟩 WEEKLY: OTFU | ENDS: 5734.25
🟩 MONTHLY: OTFU | ENDS: 5410.25
Contextual Analysis
The previous week started with notable weakness, as Monday’s session formed a double distribution trend day to the downside, tagging the initial target at 5738. The subsequent overnight session tested the 2-week balance low following a quick flush, marking the turning point for the strength that unfolded throughout the rest of the week. By Wednesday’s session, the opposite side of the balance area was reached and exceeded, signaling a breakout. However, Thursday’s session formed an inside day, which was not the strongest response from a market that had just broken out of a 14-day balance area. The general guideline is that the longer a consolidation phase lasts, the more significant the subsequent breakout tends to be, making Thursday’s lack of continuation a point of concern. However, as noted in Friday’s daily plan, buyers managed to shift the 5D VPOC higher from 5783 to 5830, which was a bullish development. On Friday, the market saw a continuation higher following a successful inside day breakout, notably shifting the 5D VPOC higher again from 5830 to 5860.

For this week, the main focus will be on whether buyers can sustain the directional move away from the prior 2-week balance area following Wednesday’s breakout and Friday’s continuation higher. The market is one-time framing up across all time frames, indicating that buyers are firmly in control of the auction. As we monitor for continuation or lack thereof, the strongest market response would involve building value above 5827, further confirming the breakout and targeting the marked upside extensions. Conversely, acceptance back within the 2-week balance area would open the door for potential weakness, as a failed breakout scenario could come into play.
The weekly Smashlevel (Pivot) is 5827, representing the prior 2-week balance high. Holding above 5827 signals strength and targets the 50% and 100% range extensions at 5878 and 5930, respectively. Acceptance above 5930 would then target the resistance area from 5970 to the Weekly Extreme High of 6000, where selling activity can be expected.
Break and hold below 5827 signals a failed breakout and targets the 20D VPOC (medium-term value) at 5785, which acts as a downside magnet in the absence of initiating buyers. Acceptance below 5785 signals weakness, targeting the support area from 5730 to the Weekly Extreme Low of 5700, where buying activity can be expected. Note how this support area coincides with the lower end of the prior 2-week balance area and the prior ATH at 5721.25, making it a crucial area for buyers to defend.
Levels of Interest
In the upcoming week, I will closely observe the behavior around 5827.
Holding above 5827 would target 5878 / 5930 / 5970 / 6000* / 6030
Break and hold below 5827 would target 5785 / 5730 / 5700* / 5665 / 5629
*Weekly Extremes. I exercise caution when initiating trades outside the Weekly Extremes to avoid making impulsive decisions at unfavorable locations. Essentially, the Weekly Extremes serve as a safeguard against emotionally-driven trades, a state that is less than ideal for making well-informed trading decisions.
As usual, a detailed daily plan will be published tomorrow. In the meantime, enjoy the rest of your weekend!


Thanks! HAGW Smash!
Many thanks