ES Weekly Plan | November 25-29, 2024
My expectations for the upcoming week.
Visual Representation
Economic Calendar
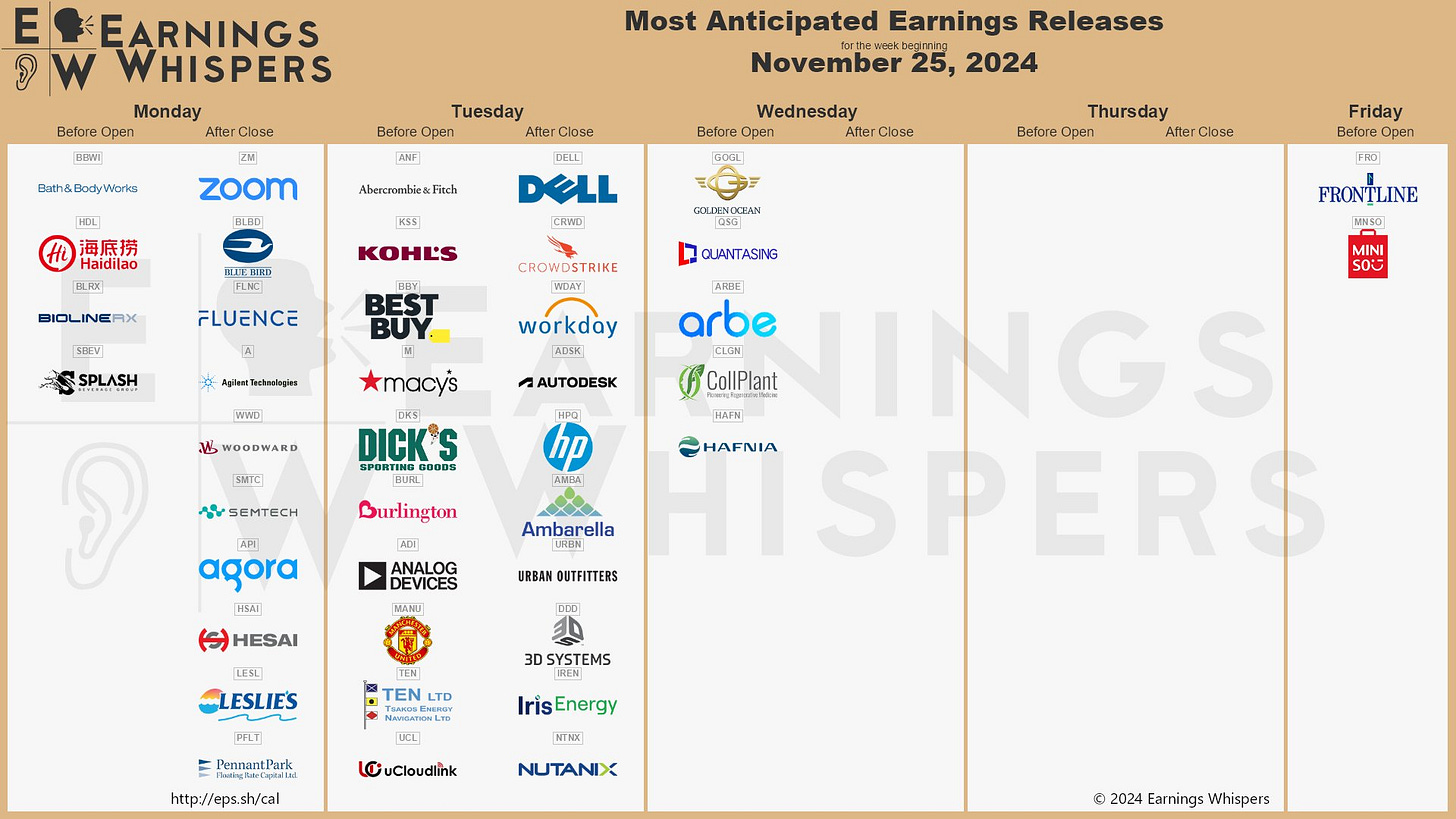
Earnings Calendar
Market Structure
🟩 DAILY: OTFU | ENDS: 5962.75
🟩 WEEKLY: OTFU | ENDS: 5876.25
🟩 MONTHLY: OTFU | ENDS: 5724
Contextual Analysis
During the previous week, the main focus was on the prior week’s double distribution profile, with particular attention given to its lower distribution, marked by Friday’s range. The market saw responsive two-sided activity within Friday’s range from Monday through Wednesday, with Tuesday’s session breaking Friday’s low by two ticks. I will continue to interpret the weekly as one-time framing up, given that the break was only by two ticks. It’s notable how sellers continue to struggle to gain downside traction, forming a weak low while attempting to end the weekly OTFU this week and the monthly OTFU two weeks ago. Every short period of weakness has been primarily driven by weak longs getting out, rather than the involvement of stronger sellers. This will change at some point, preferably after a well-auctioned high has been formed. Thursday’s session was very tricky, as the market attempted a breakout that failed early on but succeeded after a second attempt. When breakouts lack continuation, it generally triggers a counter-move to the opposite side of the balance, which didn’t happen, highlighting the weak state of the sellers. Friday closed within the upper balance.

For this shortened holiday week, the main focus will be on the upper and lower balance areas highlighted on the chart. The key question is whether buyers can sustain Thursday’s breakout from the lower balance area. A strong market would continue Friday’s behavior by accepting back into the upper balance area, setting the stage for a traverse toward all-time highs, where there is unfinished business. Conversely, the weakest response would involve a return to the lower balance area, opening the door for a retest of its weak lower extreme.
The weekly Smashlevel is 5970, representing both the lower end of the upper balance and the lower end of last week’s upper distribution. Holding above 5970 signals strength, targeting the weekly NVPOC at 6015 and the RTH ATH at 6045.25, effectively completing a full traverse of the upper balance. Acceptance above 6045.25 would then target the resistance area from 6070 to the Weekly Extreme High of 6095, cleaning up the ON ATH in the process, where selling activity can be expected. Additionally, the Monthly Extreme High, also situated at 6095, provides an extra layer of confluence to this resistance area.
Break and hold below 5970 would target the upper end of the lower balance at 5947. Acceptance below 5947 signals weakness, targeting the support area from 5905 to the Weekly Extreme Low of 5880, where buying activity can be expected. For a potential shift in the bigger picture, sellers would need to break and hold below this support area.
Levels of Interest
In the upcoming week, I will closely observe the behavior around 5970.
Holding above 5970 would target 6015 / 6045 / 6070 / 6095* / 6120
Break and hold below 5970 would target 5947 / 5905 / 5880* / 5855 / 5813
*Weekly Extremes. I exercise caution when initiating trades outside the Weekly Extremes to avoid making impulsive decisions at unfavorable locations. Essentially, the Weekly Extremes serve as a safeguard against emotionally-driven trades, a state that is less than ideal for making well-informed trading decisions.
As usual, a detailed daily plan will be published tomorrow. In the meantime, enjoy the rest of your weekend!


Thank you! You've taught me so much about how to look at ES
Thank you, buddy! Let's see if we can continue with the Santa rally.