ES Weekly Plan | May 22-26, 2023
Below are my expectations for the week ahead.
🟩 Daily: OTFU | Ends: 4191.50
🟩 Weekly: OTFU | Ends: 4122.50
🟩 Monthly: OTFU
Weekly Extreme High: 4300
Weekly Extreme Low: 4110
As usual, a detailed daily plan will be published tomorrow.
The previous week started off in a quiet fashion, with Monday and Tuesday's sessions staying within the range of the previous week's inside week. However, Wednesday brought a noteworthy shift as the market experienced a double distribution trend day to the upside, effectively breaking out from the multi-day balance area. Thursday and Friday saw an upside continuation, leading to a test of the prior weekly resistance area, which was met with selling activity. It’s worth noting that the weekly gap at 4220.75 has finally been filled, and Friday’s high was 1 tick short of reaching the highlighted 100% range extension at 4226.

For this week, the main focus will be on whether buyers can spend time and volume at these higher prices to primarily migrate the short-term value (5-day VPOC) up from 4138, following last week’s directional move away from the established value. During the previous six weeks, market participants have unanimously agreed on the value, with responsive activity being the main theme. Currently, we are witnessing one-time framing up across all time frames, indicating a shift towards initiative activity. In the previous Weekly Plan, we discussed this potential shift and emphasized the importance of adjusting your trading strategy accordingly. The market is currently breaking out of a substantial consolidation area, indicating that many traders are on the wrong side of the market. It is advised not to counter this move unless there is a definite failure observed. Sellers primary objective is to end the daily one-time framing up.
The weekly level of interest is 4208.50, which represents the high of the prior 4-month balance area and it served as the resistance for Friday's lower distribution. It’s worth noting that after breaking this level on Thursday, we closed below it on Friday. Break and hold above 4208.50 would target the prior Weekly Extreme High of 4235. Break and hold above 4235 would target the resistance area from 4265 to the Weekly Extreme High 4300, where selling activity can be expected. In the event of further strength, the 100% range extension from the recent multi-week balance is at 4320 and the August high of 4327.50.
Holding below 4208 would target 4170, which represents a high volume node (HVN) observed during the previous week. Break and hold below 4170 would target the support area from 4145 to the Weekly Extreme Low 4110, where buying activity can be expected. Note how this area coincides with the short, medium and long-term value at 4138, which will serve as a downside magnet in the absence of an upside follow-through. For any significant change to occur in the bigger picture, the sellers would need to break and hold below the Weekly Extreme Low, with a weekly close below it being preferred.
🟩 Upside: 4235 | 4265 | 4300 | 4327 | 4360
🟥 Downside: 4170 | 4145 | 4110 | 4083 | 4055
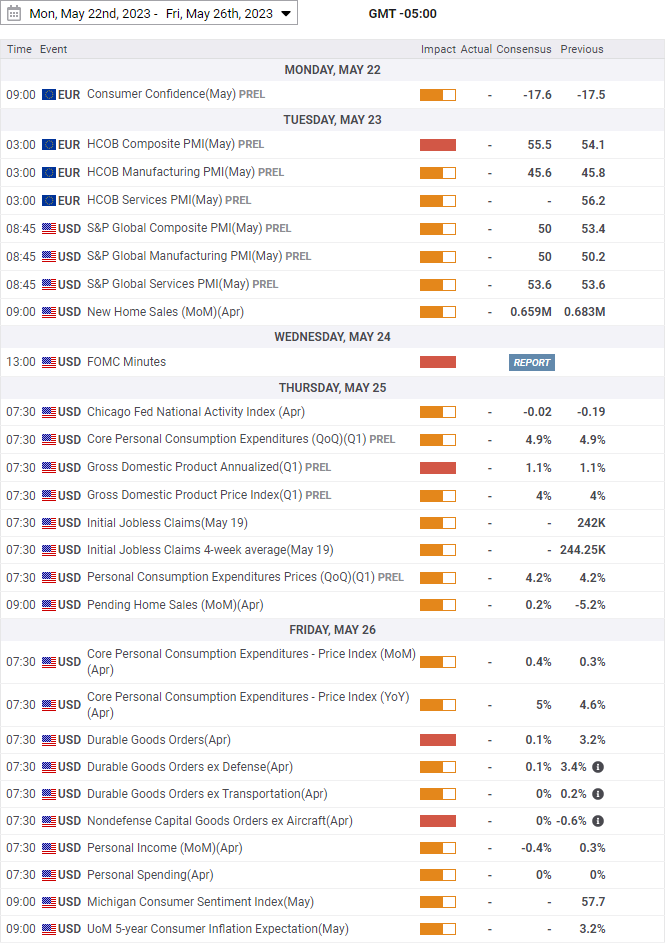
Economic Calendar
Disclaimer: Futures and options trading involves a high level of risk, with the potential for substantial losses. The information provided in this newsletter is for informational purposes only and is not intended to be a trade recommendation. It is the responsibility of the reader to make their own investment decisions and they should seek the advice of a qualified securities professional before making any investments. The owners/authors of this newsletter are not certified as registered financial professionals or investment advisers.


Smash, it's always a pleasure to read your writeups. Logical and Elegant. One question for you: why is Friday's low of 4191.50 a Poor Low? I see a Poor Low at 4193.00 (G and J lows). Thanks.
Your Daily plans are great, but honestly it’s your Weekly plans that are so extremely helpful, both from an educational standpoint and framework for the dailies.