ES Weekly Plan | June 19-23, 2023
Below are my expectations for the week ahead.
🟩 Daily: OTFU | Ends: 4451
🟩 Weekly: OTFU | Ends: 4351.25
🟩 Monthly: OTFU | Ends: 4062.25
Weekly Extreme High: 4540
Weekly Extreme Low: 4370
As usual, a detailed daily plan will be published tomorrow.
I transitioned to the ESU23 (September) contract on Monday of the previous week. Since I do not back-adjust my charts, there is a noticeable gap on my chart where the ESM23 (June) settlement is marked at 4304.75. The previous weekly resistance area (4430-4395) was reached already on Tuesday following a true gap up that remained unfilled. On Wednesday, the market tested the prior Weekly Extreme High of 4430 (HOD: 4439.50) and subsequently experienced a drop of 50 handles, filling Tuesday’s gap in the process. In Thursday’s daily plan, I highlighted the potential for a squeeze if the buyers could successfully establish acceptance above 4430. This was primarily due to the market's consolidation within the weekly resistance area, where there were no indications of significant selling pressure. On Thursday, the market exploded to the upside, which was followed up on Friday with a higher high. However, some weakness emerged towards the close.
For this week, the main focus will be on whether the buyers can sustain the directional move away from the multi-week balance area from April and May. The market is one-time framing up across all time frames, and the primary objective for sellers is to put an end to the daily one-time framing up. It is important to mention that we are currently trading above the Monthly Extreme High (June) of 4410, while all value references, including the 5D, 20D, and 90D VPOC, as well as the Monthly VWAP at 4337, are positioned below. This indicates that chasing an immediate upside continuation may not be the most favorable approach, making the resistance area interesting from a selling perspective. However, as long as the weekly support area remains intact, immediate pullbacks offer an attractive opportunity. As I’ve mentioned the recent Weekly Plans, for any significant change to occur in the bigger picture, the sellers would need to break and hold below the Weekly Extreme Low, with a weekly close below it being preferred.
The weekly level of interest is 4475, which represents the high volume node (HVN) from Thursday and Friday’s session. As the buyers aim to regain control of this immediate resistance for an upside continuation, will sellers put up a defense? Break and hold above 4475 would target the resistance area from 4510 to the Weekly Extreme High 4540, where selling activity can be expected. In the event of further strength, I will observe the levels of 4580 and 4620.
Holding below 4475 would target 4447, which represents the afternoon pullback low from Thursday’s multi-distribution trend day, coinciding with the halfback and the low volume node (LVN). Break and hold below 4447 would target the Monthly Extreme High (June) of 4410, along with the support area from 4400 to the Weekly Extreme Low 4370, where buying activity can be expected. In the event of further weakness, I will observe the August high of 4327.50 and the ESM23 (June) settlement at 4304.75.
🟩 Upside: 4510 | 4540| 4580 | 4620
🟥 Downside: 4445| 4400 | 4370 | 4327 | 4305
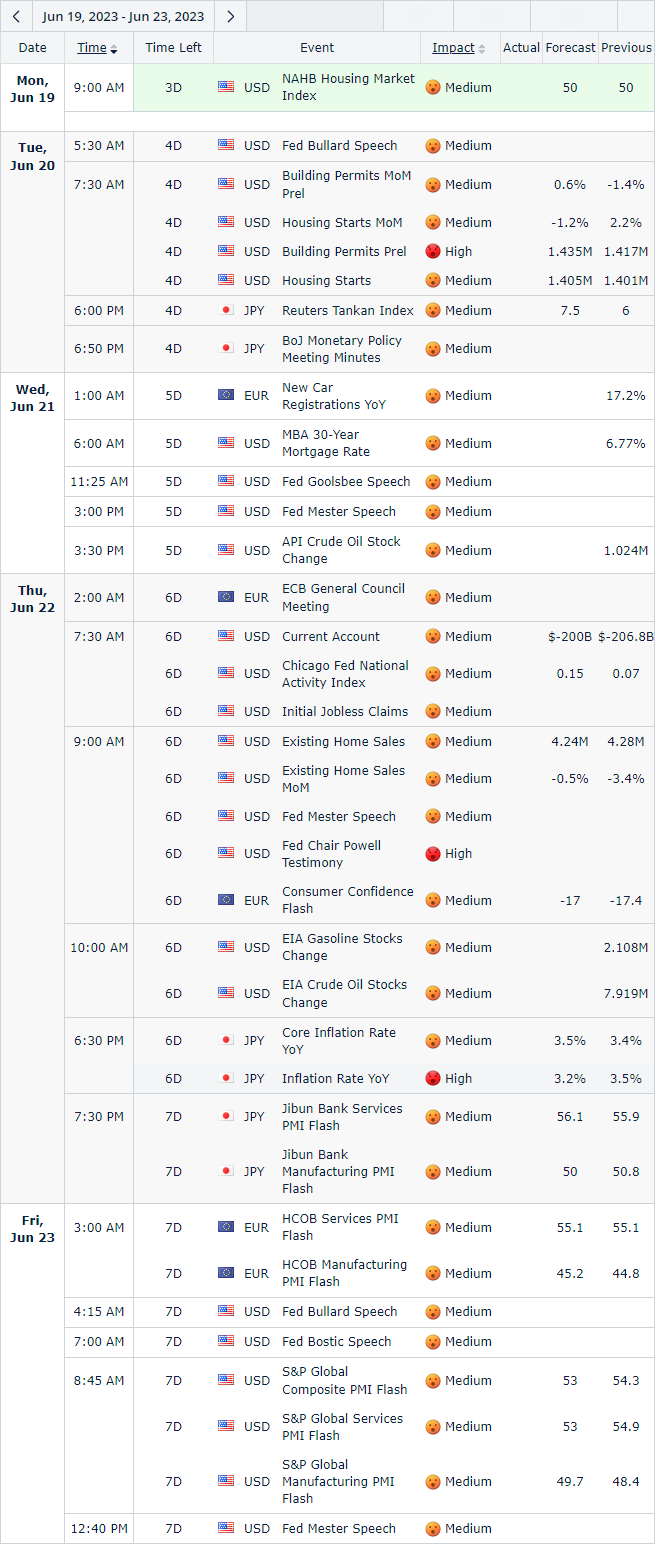
Economic Calendar
Disclaimer: Futures and options trading involves a high level of risk, with the potential for substantial losses. The information provided in this newsletter is for informational purposes only and is not intended to be a trade recommendation. It is the responsibility of the reader to make their own investment decisions and they should seek the advice of a qualified securities professional before making any investments. The owners/authors of this newsletter are not certified as registered financial professionals or investment advisers.


Thanks for the great analysis!
What order type do you use for smash when you are actually trading (Limit vs market)?