ES Weekly Plan | February 6-10, 2023
🟨 Daily: Balance | 2 Day | H: 4208.50 L: 4135
🟩 Weekly: OTFU | Ends: 4029.50
🟩 Monthly: OTFU
Weekly Extreme High: 4255
Weekly Extreme Low: 4040
As usual, a detailed daily plan will be published tomorrow.
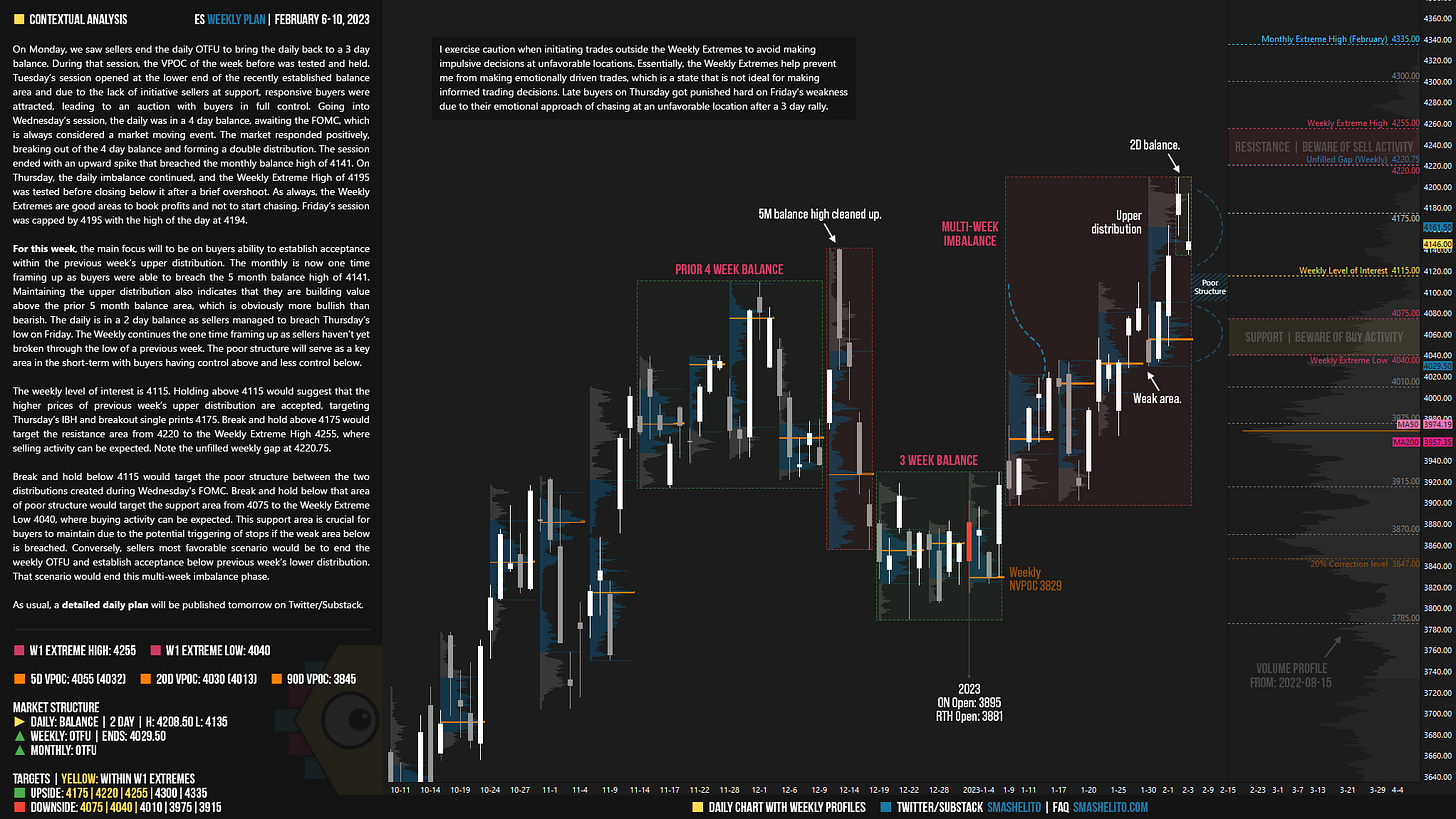
On Monday, we saw sellers end the daily OTFU to bring the daily back to a 3 day balance. During that session, the VPOC of the week before was tested and held. Tuesday’s session opened at the lower end of the recently established balance area and due to the lack of initiative sellers at support, responsive buyers were attracted, leading to an auction with buyers in full control. Going into Wednesday’s session, the daily was in a 4 day balance, awaiting the FOMC, which is always considered a market moving event. The market responded positively, breaking out of the 4 day balance and forming a double distribution. The session ended with an upward spike that breached the monthly balance high of 4141. On Thursday, the daily imbalance continued, and the Weekly Extreme High of 4195 was tested before closing below it after a brief overshoot. As always, the Weekly Extremes are good areas to book profits and not to start chasing. Friday’s session was capped by 4195 with the high of the day at 4194.
I exercise caution when initiating trades outside the Weekly Extremes to avoid making impulsive decisions at unfavorable locations. Essentially, the Weekly Extremes help prevent me from making emotionally driven trades, which is a state that is not ideal for making informed trading decisions. Late buyers on Thursday got punished hard on Friday's weakness due to their emotional approach of chasing at an unfavorable location after a 3 day rally.
For this week, the main focus will to be on buyers ability to establish acceptance within the previous week’s upper distribution. The monthly is now one time framing up as buyers were able to breach the 5 month balance high of 4141. Maintaining the upper distribution also indicates that they are building value above the prior 5 month balance area, which is obviously more bullish than bearish. The daily is in a 2 day balance as sellers managed to breach Thursday’s low on Friday. The Weekly continues the one time framing up as sellers haven’t yet broken through the low of a previous week. The poor structure will serve as a key area in the short-term with buyers having control above and less control below.
The weekly level of interest is 4115. Holding above 4115 would suggest that the higher prices of previous week’s upper distribution are accepted, targeting Thursday’s IBH and breakout single prints 4175. Break and hold above 4175 would target the resistance area from 4220 to the Weekly Extreme High 4255, where selling activity can be expected. Note the unfilled weekly gap at 4220.75.
Break and hold below 4115 would target the poor structure between the two distributions created during Wednesday's FOMC. Break and hold below that area of poor structure would target the support area from 4075 to the Weekly Extreme Low 4040, where buying activity can be expected. This support area is crucial for buyers to maintain due to the potential triggering of stops if the weak area below is breached. Conversely, sellers most favorable scenario would be to end the weekly OTFU and establish acceptance below previous week’s lower distribution. That scenario would end this multi-week imbalance phase.
🟩 Upside: 4175 | 4220 | 4255 | 4300 | 4335
🟥 Downside: 4075 | 4040 | 4010 | 3975 | 3915
Economic Calendar
Disclaimer: Futures and options trading involves a high level of risk, with the potential for substantial losses. The information provided in this newsletter is for informational purposes only and is not intended to be a trade recommendation. It is the responsibility of the reader to make their own investment decisions and they should seek the advice of a qualified securities professional before making any investments. The owners/authors of this newsletter are not certified as registered financial professionals or investment advisers.
Twitter: @smashelito | FAQ: smashelito.com


Hi Smash, hope you are back in good health!
Can you help me understand what a correction level is (such as the 20% correction level), how it is calculated, and what it is measured against (the significance of it)? Is it more related to volume profile, market profile, or something else? Many thanks!
Quality analysis as usual Smash. Good to see you back. Thank you.