
ES Weekly Plan | February 23-27, 2026
Recap, Market Context & Key Levels for the Week Ahead

Welcome to this week’s plan. Inside, you’ll find a quick review of last week’s price action, key economic events, market structure, context for the week ahead, and the levels I’ll be focusing on. Let’s get prepared.
Contents
Last Week in Review
Economic & Earnings Calendar
Market Structure
Contextual Analysis & Plan
Key Levels of Interest
Last Week in Review
Last week’s plan:

Last week, the sellers attempted a multi-week balance breakdown on Tuesday, an attempt that failed to generate meaningful downside follow-through and triggered a counter-move. Heading into Wednesday’s session, we noted the potential for a short-covering rally if buyers could reclaim the key 6890 level, a scenario that ultimately played out. The poor structure from Thursday’s notable double distribution trend day on February 12 was partially filled in the process. This double distribution continues to be important, as the market currently trades within the poor structure separating the distributions.
After Wednesday’s short-covering rally, the market saw a pullback on Thursday, building value within Tuesday’s range, which provided an opening for sellers to trigger another wave of weakness. However, failed selling efforts were the theme of the week, with Friday’s session forming another P-shaped profile following a rally that returned within Wednesday’s value area.
The key question is whether a test of the balance highs comes next, as often happens after failed breakdowns, or if sellers have other plans. Generally, as long as the market stays between Thursday’s double distributions formed on February 12 (6960–6890), we should remain nimble, while acceptance outside this range, either above 6960 or below 6890, would open the door for a potential test of the multi-week balance extremes.
Last Week’s Levels in Review
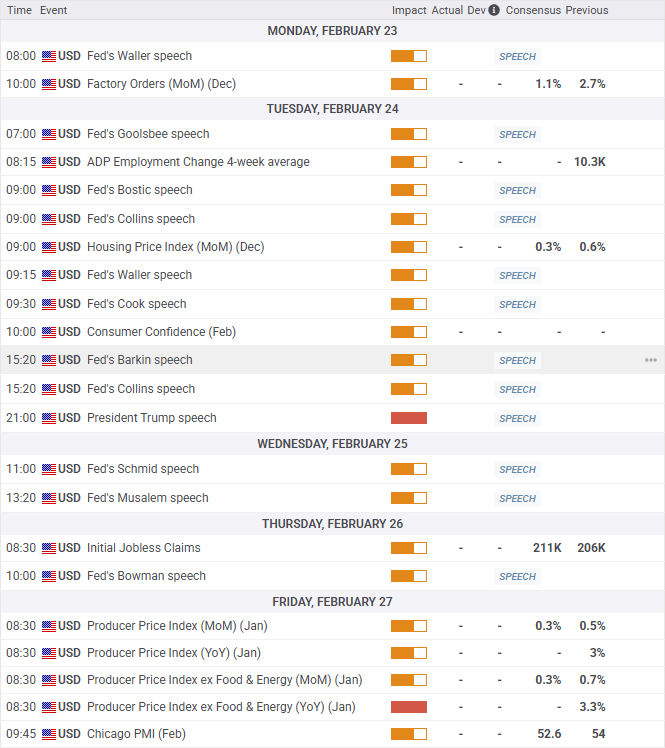
Economic & Earnings Calendar
Central Standard Time
Earnings Whispers

Market Structure
🟨 Daily: BALANCE → 3-day → High: 6931.50 / Low: 6847.25
🟨 Weekly: BALANCE → 9-week → High: 7031 / Low: 6801.50
🟨 Monthly: BALANCE → TBD
Balance: A market condition where price consolidates within a defined range, reflecting indecision as the market awaits more market-generated information. We apply balance guidelines—favoring fade trades at range extremes (highs/lows) and preparing for breakout setups if balance resolves.
One-Time Framing Up (OTFU): A market condition where each subsequent bar forms a higher low, signaling a strong upward trend.
One-Time Framing Down (OTFD): A market condition where each subsequent bar forms a lower high, signaling a strong downward trend.
Contextual Analysis & Plan
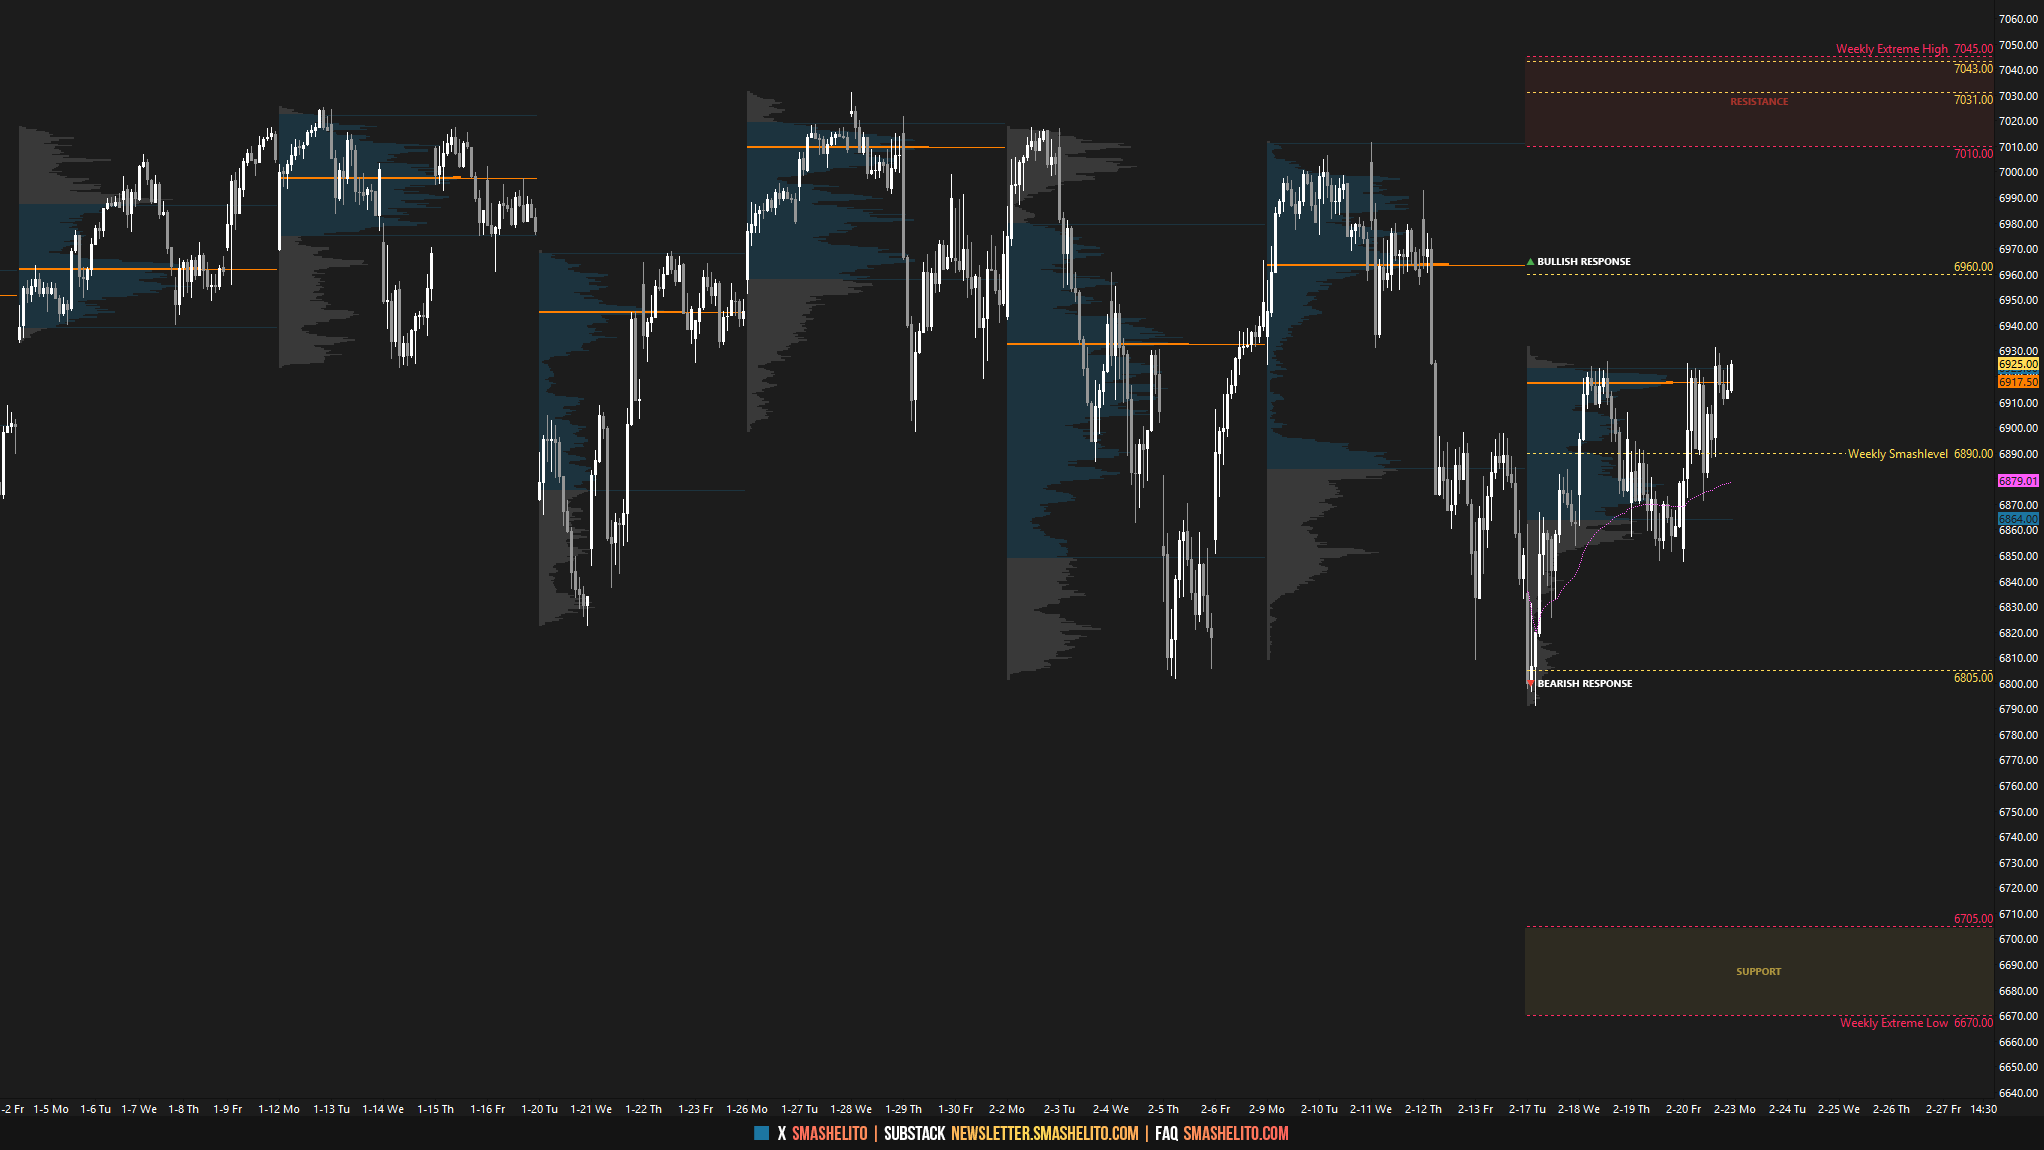
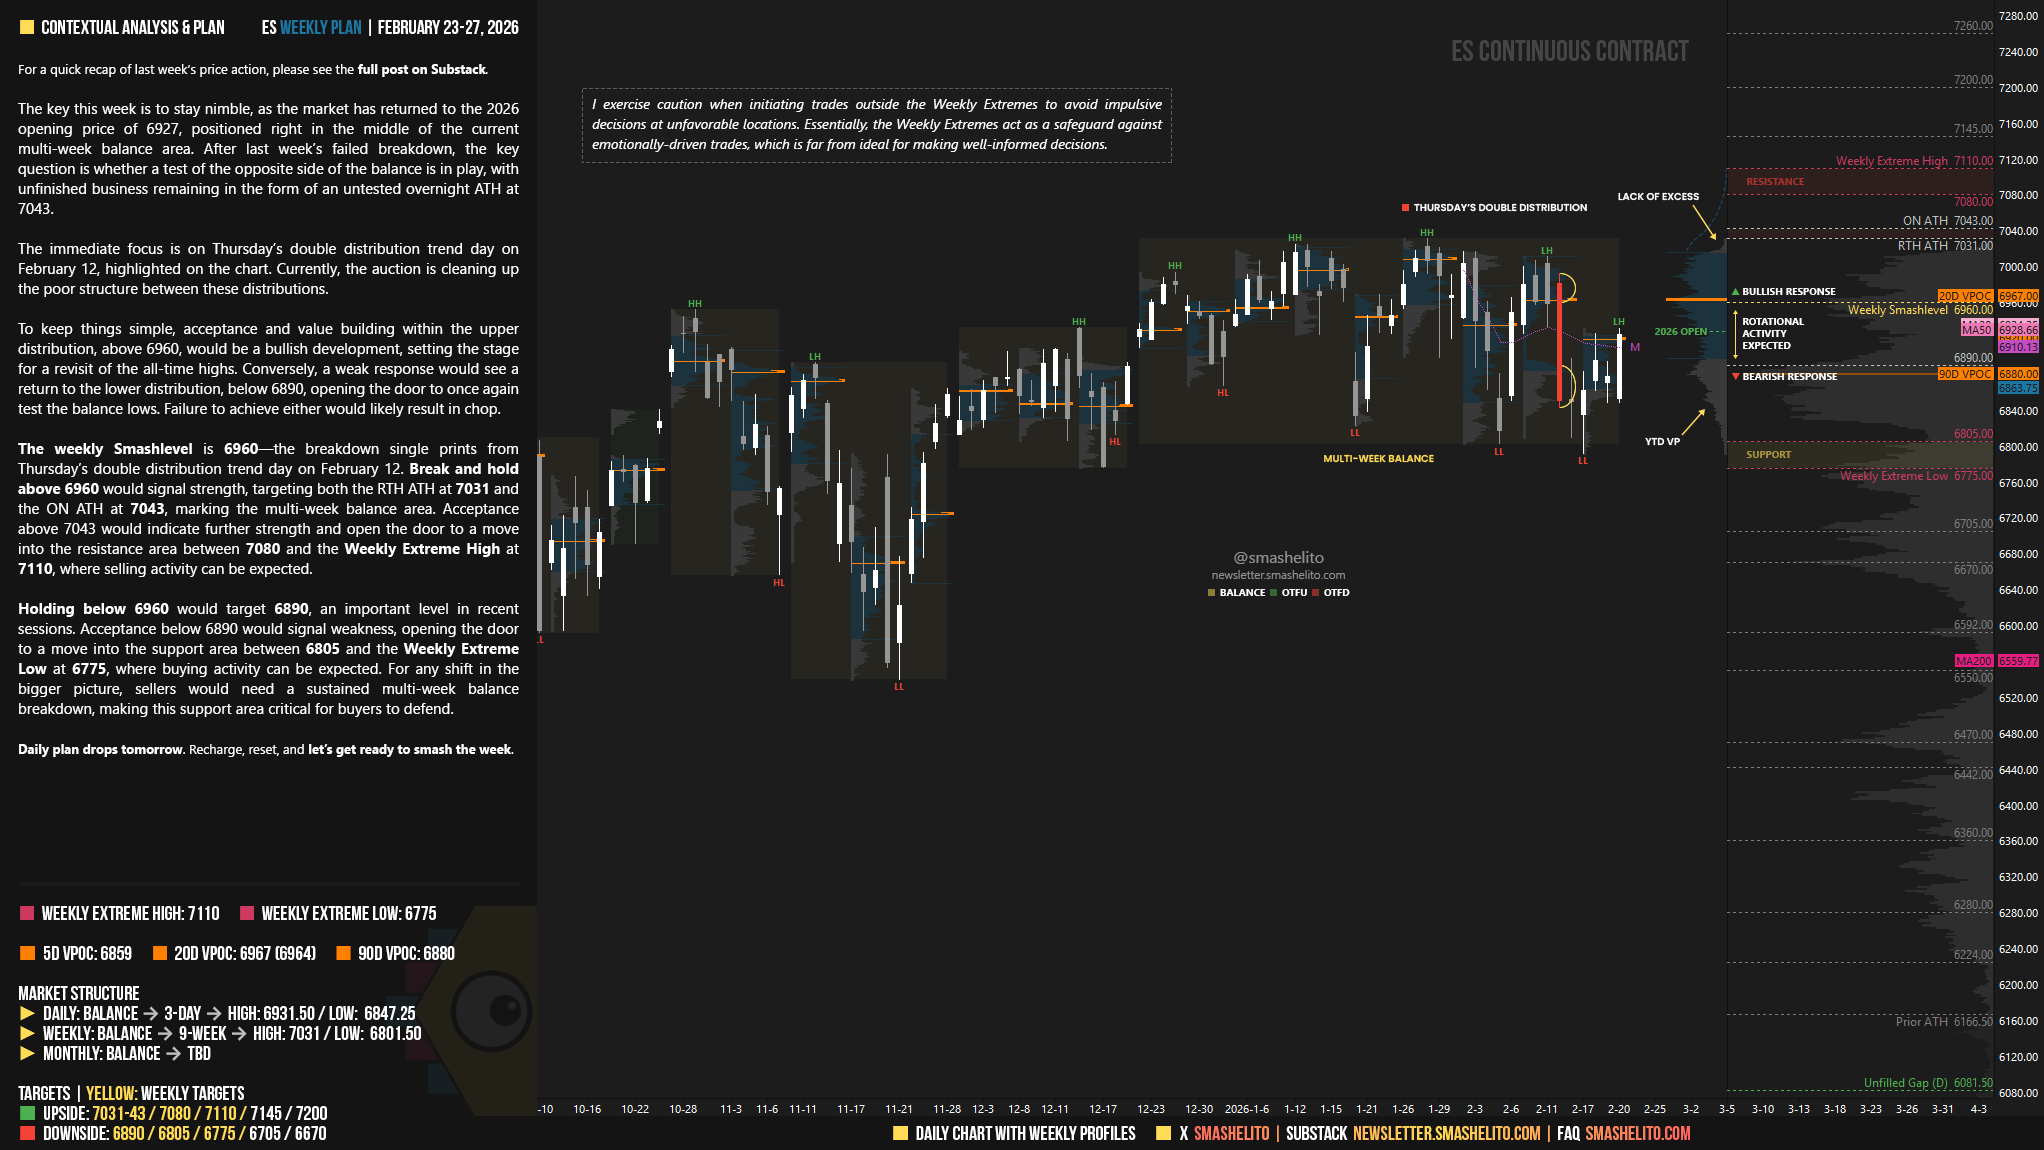
The key this week is to stay nimble, as the market has returned to the 2026 opening price of 6927, positioned right in the middle of the current multi-week balance area. After last week’s failed breakdown, the key question is whether a test of the opposite side of the balance is in play, with unfinished business remaining in the form of an untested overnight ATH at 7043.
The immediate focus is on Thursday’s double distribution trend day on February 12, highlighted on the chart. Currently, the auction is cleaning up the poor structure between these distributions.
To keep things simple, acceptance and value building within the upper distribution, above 6960, would be a bullish development, setting the stage for a revisit of the all-time highs. Conversely, a weak response would see a return to the lower distribution, below 6890, opening the door to once again test the balance lows. Failure to achieve either would likely result in chop.
The weekly Smashlevel is 6960—the breakdown single prints from Thursday’s double distribution trend day on February 12. Break and hold above 6960 would signal strength, targeting both the RTH ATH at 7031 and the ON ATH at 7043, marking the multi-week balance area. Acceptance above 7043 would indicate further strength and open the door to a move into the resistance area between 7080 and the Weekly Extreme High at 7110, where selling activity can be expected.
Holding below 6960 would target 6890, an important level in recent sessions. Acceptance below 6890 would signal weakness, opening the door to a move into the support area between 6805 and the Weekly Extreme Low at 6775, where buying activity can be expected. For any shift in the bigger picture, sellers would need a sustained multi-week balance breakdown, making this support area critical for buyers to defend.
Key Levels of Interest
In the upcoming week, I will closely observe the behavior around 6960.
Break and hold above 6960 would target 7031-43 / 7080 / 7110* / 7145 / 7200
Holding below 6960 would target 6890 / 6805 / 6775* / 6705 / 6670
*Weekly Extremes (defined by proprietary models). I exercise caution when initiating trades outside the Weekly Extremes to avoid impulsive decisions at unfavorable locations. Essentially, the Weekly Extremes act as a safeguard against emotionally-driven trades, which is far from ideal for making well-informed decisions.
Daily plan drops tomorrow. Recharge, reset, and let’s get ready to smash the week.
Hi Smash, appreciate all the analysis. Do you ever discuss how you trade these levels? Do you just take quick base hit trades or do you hold for larger moves level to level?
Thank smash 💥
You never late ⏰