
ES Weekly Plan | Dec 29 - Jan 2, 2026
Recap, Market Context & Key Levels for the Week Ahead

Welcome to this week’s plan. Inside, you’ll find a quick review of last week’s price action, key economic events, market structure, context for the week ahead, and the levels I’ll be focusing on. Let’s get prepared.
Contents
Last Week in Review & Bonus Chart
Economic & Earnings Calendar
Market Structure
Contextual Analysis & Plan
Key Levels of Interest
Last Week in Review & Bonus Chart
Last week’s plan:

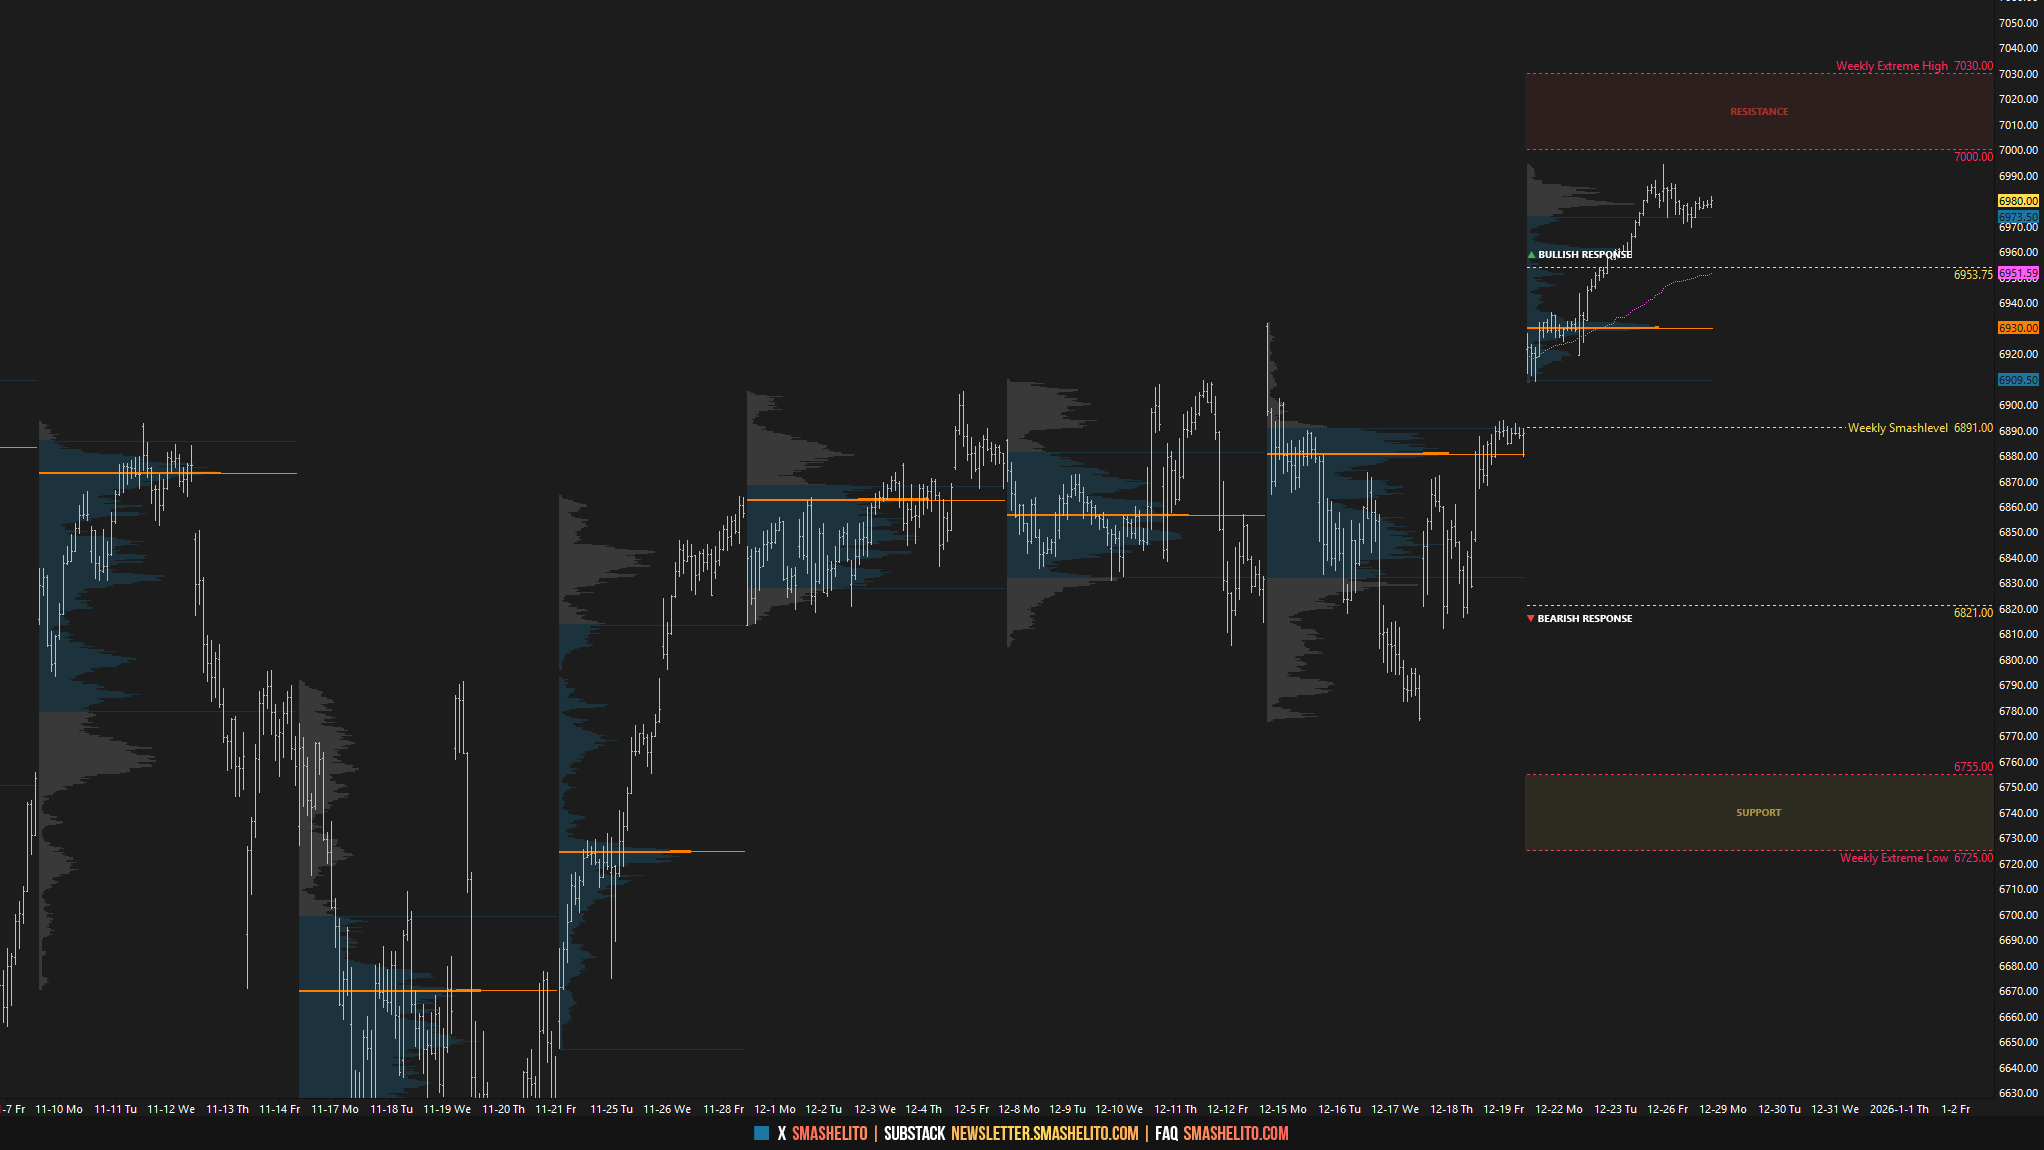
Coming into last week, the key focus was on whether buyers could sustain upside momentum following Friday’s (December 19th) short-covering rally, which formed a P-shaped profile. With the session closing back within Monday’s range and above the weekly value area, early-week value development was crucial to gauge the market’s next move.
Monday’s session kicked off with a true gap up, which remained unfilled, and the market essentially never looked back. This bullish development opened the door to revisit the unfinished business at the overnight all-time high (ATH) at 6953.75—a scenario that ultimately played out during Tuesday’s session.
As a result, both the weekly and monthly timeframes had shifted into one-time framing up mode. The auction continued to grind higher during Wednesday’s shortened session and on Friday. Friday’s session formed an excess high, which will be important to monitor in the short term. The conditions are fairly straightforward: the key will be to monitor whether the market can build value above the prior RTH ATH at 6952. Failure to do so opens the door to fill Monday’s gap at 6893.75, a level where critical decisions are likely to be made.
Price Action vs. Weekly Levels
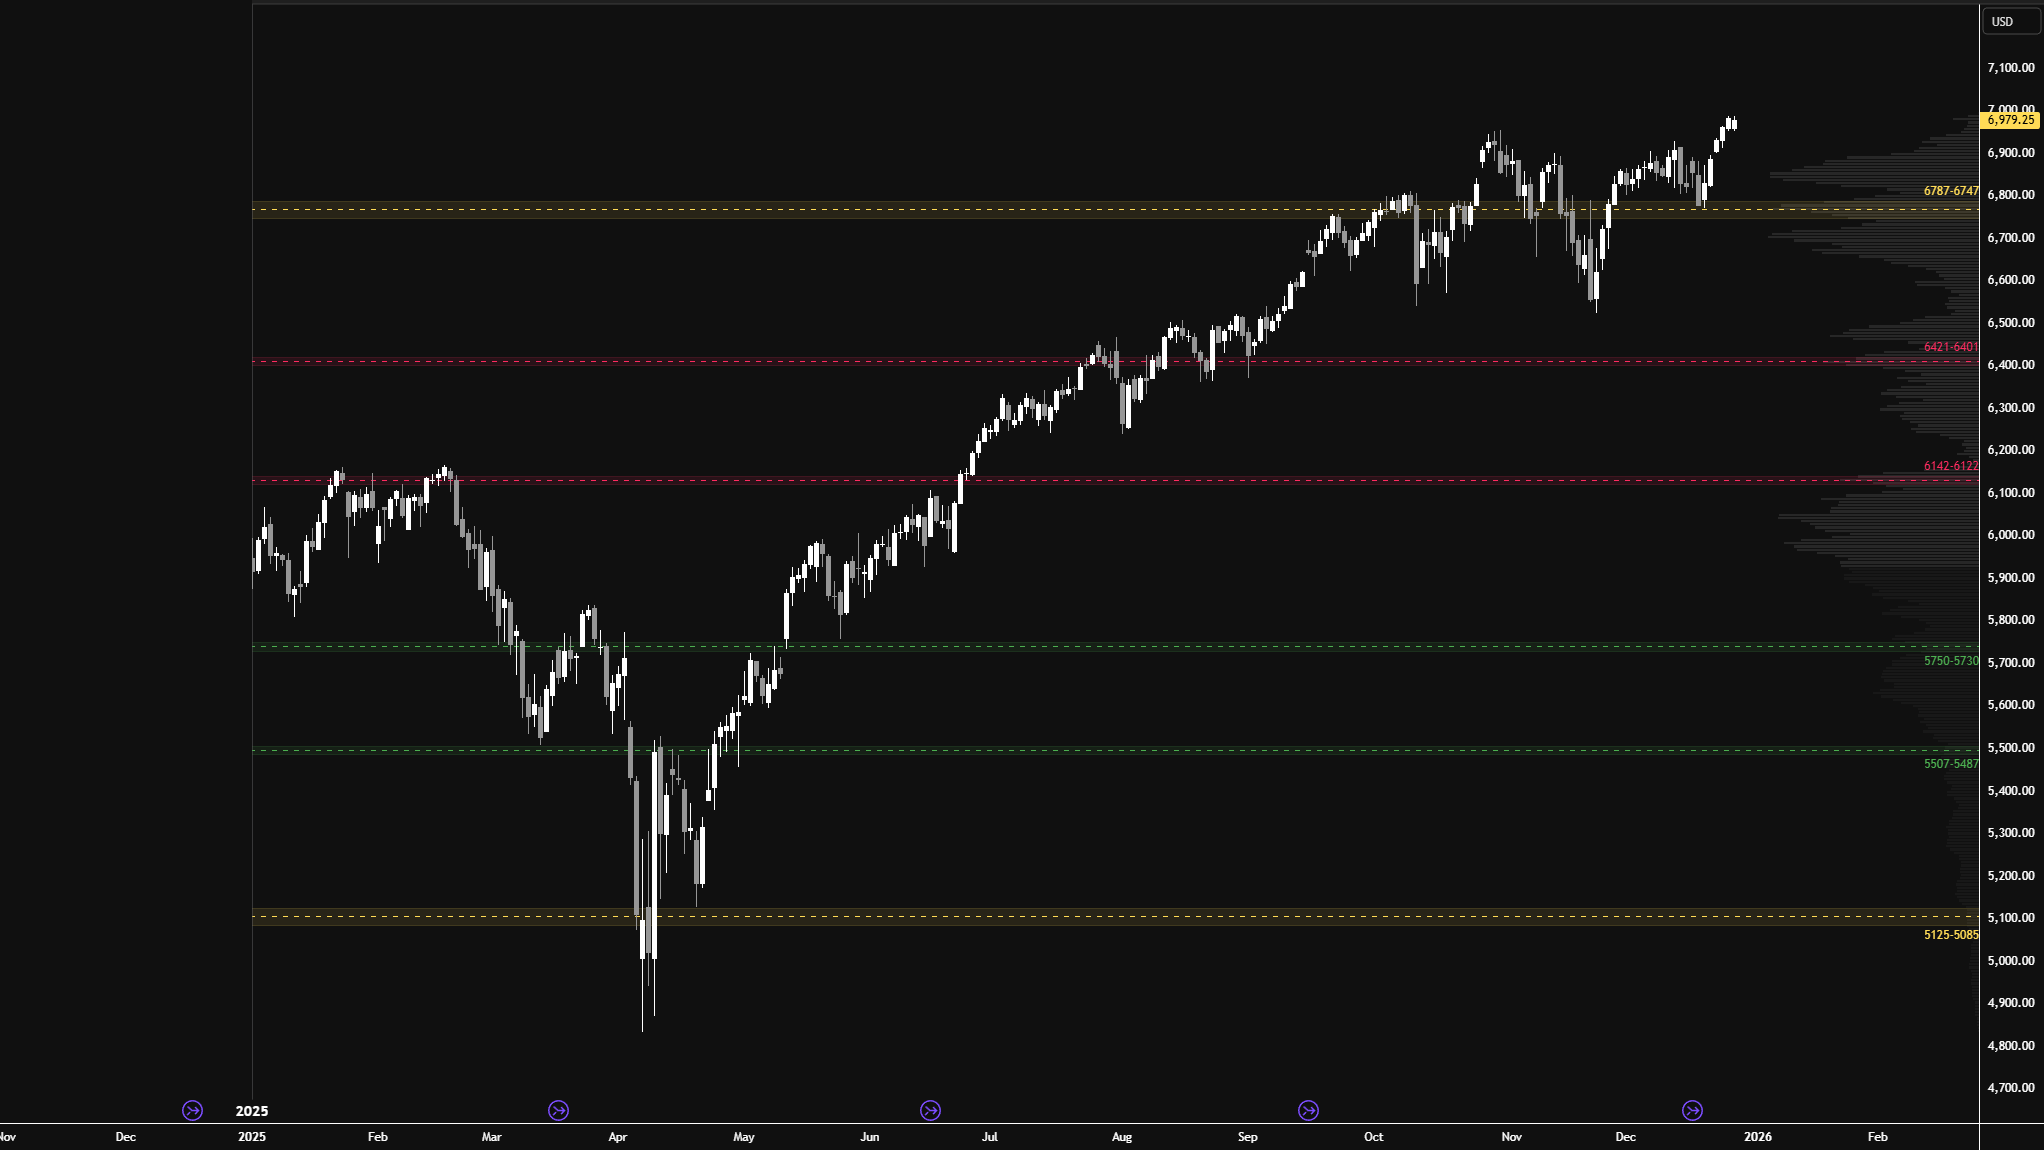
As we reach the final week of 2025, we can conclude that the auction has remarkably respected the levels from the HTF chart my good friend created at the start of the year. While this chart was intended for 2025, it wasn’t shared until July/August here in the newsletter, and even since then, it has hopefully provided value.
This segment will most likely return sometime next year, providing continued guidance on key HTF levels and market behavior.
Higher Time Frame Levels
Economic & Earnings Calendar
Central Standard Time

Market Structure
🟩 Daily: OTFU → Ends at: 6969
🟩 Weekly: OTFU → Ends at: 6908.50
🟩 Monthly: OTFU → Ends at: 6775.50
Balance: A market condition where price consolidates within a defined range, reflecting indecision as the market awaits more market-generated information. We apply balance guidelines—favoring fade trades at range extremes (highs/lows) and preparing for breakout setups if balance resolves.
One-Time Framing Up (OTFU): A market condition where each subsequent bar forms a higher low, signaling a strong upward trend.
One-Time Framing Down (OTFD): A market condition where each subsequent bar forms a lower high, signaling a strong downward trend.
Contextual Analysis & Plan
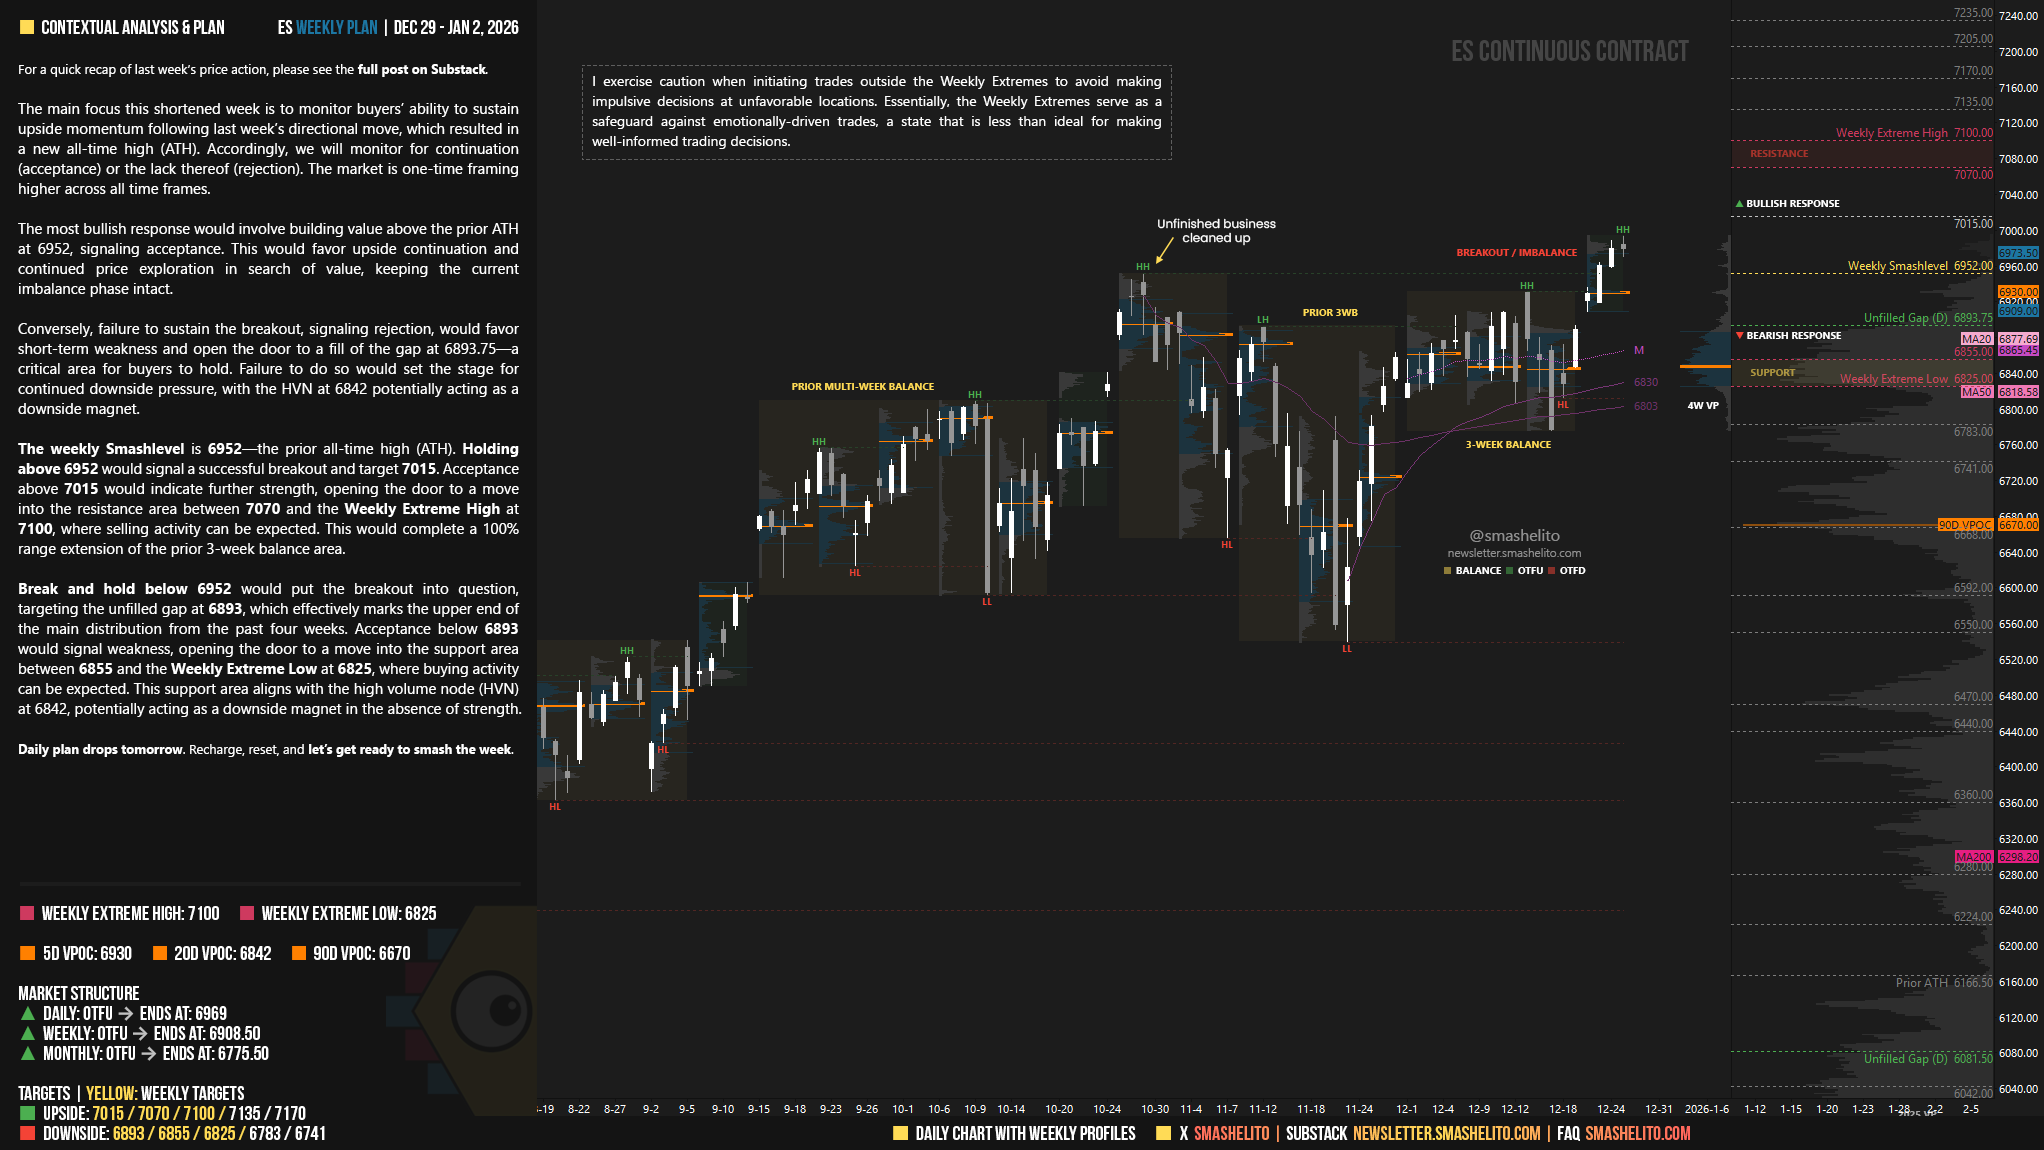
The main focus this shortened week is to monitor buyers’ ability to sustain upside momentum following last week’s directional move, which resulted in a new all-time high (ATH). Accordingly, we will monitor for continuation (acceptance) or the lack thereof (rejection). The market is one-time framing higher across all time frames.
The most bullish response would involve building value above the prior ATH at 6952, signaling acceptance. This would favor upside continuation and continued price exploration in search of value, keeping the current imbalance phase intact.
Conversely, failure to sustain the breakout, signaling rejection, would favor short-term weakness and open the door to a fill of the gap at 6893.75—a critical area for buyers to hold. Failure to do so would set the stage for continued downside pressure, with the HVN at 6842 potentially acting as a downside magnet.
The weekly Smashlevel is 6952—the prior all-time high (ATH). Holding above 6952 would signal a successful breakout and target 7015. Acceptance above 7015 would indicate further strength, opening the door to a move into the resistance area between 7070 and the Weekly Extreme High at 7100, where selling activity can be expected. This would complete a 100% range extension of the prior 3-week balance area.
Break and hold below 6952 would put the breakout into question, targeting the unfilled gap at 6893, which effectively marks the upper end of the main distribution from the past four weeks. Acceptance below 6893 would signal weakness, opening the door to a move into the support area between 6855 and the Weekly Extreme Low at 6825, where buying activity can be expected. This support area aligns with the high volume node (HVN) at 6842, potentially acting as a downside magnet in the absence of strength.
Key Levels of Interest
In the upcoming week, I will closely observe the behavior around 6952.
Holding above 6952 would target 7015 / 7070 / 7100* / 7135 / 7170
Break and hold below 6952 would target 6893 / 6855 / 6825* / 6783 / 6741
*Weekly Extremes. I exercise caution when initiating trades outside the Weekly Extremes to avoid making impulsive decisions at unfavorable locations. Essentially, the Weekly Extremes serve as a safeguard against emotionally-driven trades, a state that is less than ideal for making well-informed trading decisions.
Daily plan drops tomorrow. Recharge, reset, and let’s get ready to smash the week.
Thank you Smash! The consistency and quality of your newsletter are truly unmatched. I really appreciate all the effort you put in.
It's a pleasure to have met you this year. I'm very grateful to life for providing me with such a high-quality education. I'm enjoying this last weekly plan as much as the first one I read.
Have a wonderful end to the year and many blessings in the new year. I am deeply grateful for everything you do; it's incredible. Thank you!