ES Weekly Plan | August 19-23, 2024
My expectations for the upcoming week.
Visual Representation
Economic Calendar
Market Structure
🟩 DAILY: OTFU | ENDS: 5547.50
🟨 WEEKLY: BALANCE | 3W | H: 5600.75 L: 5146
🟨 MONTHLY: BALANCE | TBD
Contextual Analysis
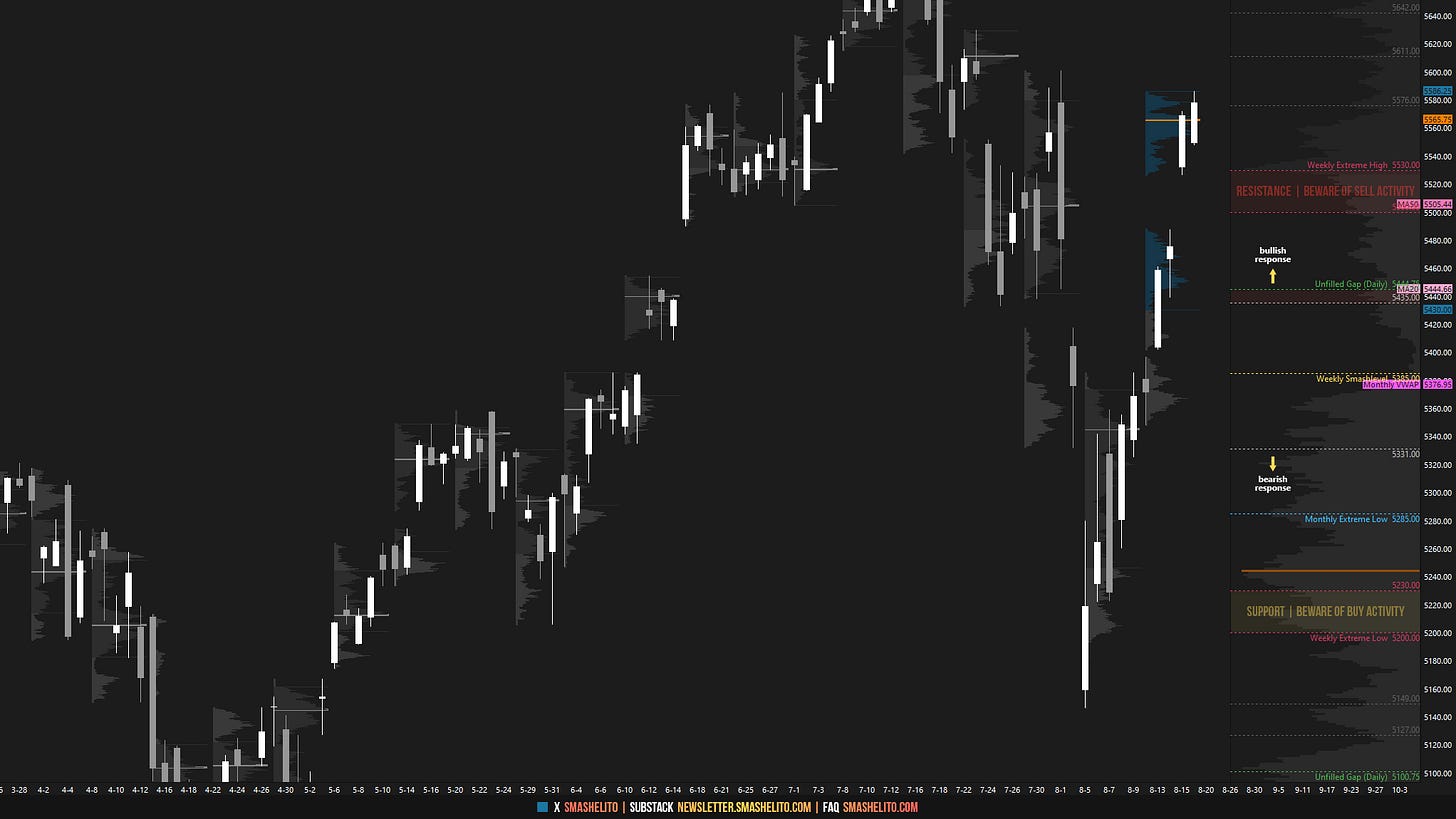
During the previous week, the market saw an impressive directional move that not only met and exceeded all weekly upside targets but also largely retraced the weakness observed in the first three sessions of August. On Tuesday, the market gapped higher, filled the gap at 5444.75, and closed within the upper distribution established three weeks ago—a scenario highlighted as the "strongest response" in the previous weekly plan. On Wednesday, buyers stepped in at the lower end of this upper distribution, maintaining the bullish scenario. Thursday saw the formation of a second true gap up, with the Weekly Extreme High of 5530 serving as support. Holding outside the Weekly Extremes indicates exceptionally strong momentum; however, as is well-known, I rarely chase such moves. Friday saw a continuation, and shifted the 5D VPOC to 5565.

For this week, the main focus will be on the previous week’s triple distribution profile, established after Tuesday’s and Thursday’s true gaps higher, both of which remain unfilled. Particular attention will be on the upper distribution, where Friday’s session closed and the weekly VPOC is located (5565). The strongest response from the market would involve maintaining within the upper distribution, favoring an upside continuation. Failure to do so would target a test of the middle distribution, effectively filling the gap at 5487.75—a key level to monitor for buying activity. Acceptance within the middle distribution could signal weakness and potentially open the door to the unfilled gap at 5396.75. Obviously, acceptance within the lower distribution would represent the weakest response, effectively negating the directional move observed last week.
The weekly Smashlevel (Pivot) is 5572, representing a LVN (low volume node) within the upper distribution. Holding above 5572 would target the 3-week balance high and the weekly NVPOC at 5601 and 5611, respectively. Acceptance above 5611 signals strength, targeting 5643 and the resistance area from 5675 to the Weekly Extreme High of 5700, where selling activity can be expected. Note how this resistance area coincides with both the unfilled gap at 5690.25 and the weekly NVPOC at 5700. The ATH (all-time high) is located at 5721.25.
Break and hold below 5572 would target the HVN (high volume node) at 5530, located at the lower end of the upper distribution. Acceptance below 5530 would target technical fills toward the unfilled gap at 5487.75 and the support area from 5480 to the Weekly Extreme Low of 5455, where buying activity can be expected. Note how this support area coincides with both the anchored VWAP from the ATH and the weekly VWAP, along with the medium-term value (20D VPOC), making it a crucial area for buyers to defend. Acceptance within the middle distribution signals weakness, opening the door to the unfilled gap at 5396.75.
Levels of Interest
In the upcoming week, I will closely observe the behavior around 5572.
Holding above 5572 would target 5611 / 5643 / 5675 / 5700* / 5721 / 5750
Break and hold below 5572 would target 5530 / 5480 / 5455* / 5432 / 5396 / 5387
*Weekly Extremes. I exercise caution when initiating trades outside the Weekly Extremes to avoid making impulsive decisions at unfavorable locations. Essentially, the Weekly Extremes serve as a safeguard against emotionally-driven trades, a state that is less than ideal for making well-informed trading decisions.
As usual, a detailed daily plan will be published tomorrow. In the meantime, enjoy the rest of your weekend!


Hey Smash.
Lately, Ive noticed an increase of price levels for both directions. Would you credit that to the added volatility in the markets?
Thanks
Thank you! HAGW!