ES Weekly Plan | April 24-28, 2023
Below are my expectations for the week ahead.
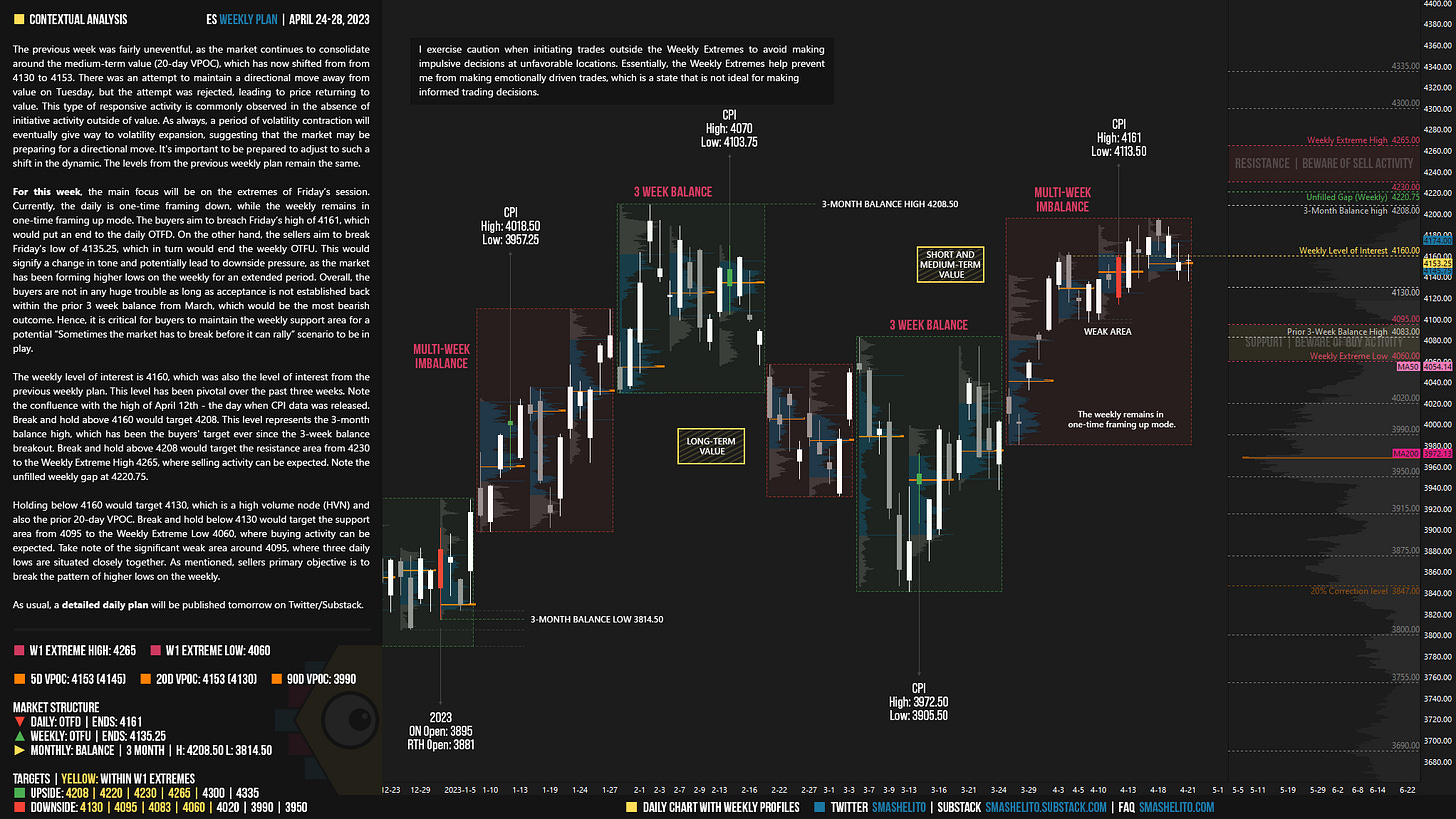
🟥 Daily: OTFD | Ends: 4161
🟩 Weekly: OTFU | Ends: 4135.25
🟨 Monthly: BALANCE | 3 Month | H: 4208.50 L: 3814.50
Weekly Extreme High: 4265
Weekly Extreme Low: 4060
As usual, a detailed daily plan will be published tomorrow.
The previous week was fairly uneventful, as the market continues to consolidate around the medium-term value (20-day VPOC), which has now shifted from 4130 to 4153. There was an attempt to maintain a directional move away from value on Tuesday, but the attempt was rejected, leading to price returning to value. This type of responsive activity is commonly observed in the absence of initiative activity outside of value. As always, a period of volatility contraction will eventually give way to volatility expansion, suggesting that the market may be preparing for a directional move. It's important to be prepared to adjust to such a shift in the dynamic. The levels from the previous weekly plan remain the same.
For this week, the main focus will be on the extremes of Friday’s session. Currently, the daily is one-time framing down, while the weekly remains in one-time framing up mode. The buyers aim to breach Friday’s high of 4161, which would put an end to the daily OTFD. On the other hand, the sellers aim to break Friday’s low of 4135.25, which in turn would end the weekly OTFU. This would signify a change in tone and potentially lead to downside pressure, as the market has been forming higher lows on the weekly for an extended period. Overall, the buyers are not in any huge trouble as long as acceptance is not established back within the prior 3 week balance from March, which would be the most bearish outcome. Hence, it is critical for buyers to maintain the weekly support area for a potential “Sometimes the market has to break before it can rally” scenario to be in play.
The weekly level of interest is 4160, which was also the level of interest from the previous weekly plan. This level has been pivotal over the past three weeks. Note the confluence with the high of April 12th - the day when CPI data was released. Break and hold above 4160 would target 4208. This level represents the 3-month balance high, which has been the buyers' target ever since the 3-week balance breakout. Break and hold above 4208 would target the resistance area from 4230 to the Weekly Extreme High 4265, where selling activity can be expected. Note the unfilled weekly gap at 4220.75.
Holding below 4160 would target 4130, which is a high volume node (HVN) and also the prior 20-day VPOC. Break and hold below 4130 would target the support area from 4095 to the Weekly Extreme Low 4060, where buying activity can be expected. Take note of the significant weak area around 4095, where three daily lows are situated closely together. As mentioned, sellers primary objective is to break the pattern of higher lows on the weekly.
🟩 Upside: 4208 | 4220 | 4230 | 4265 | 4300 | 4335
🟥 Downside: 4130 | 4095 | 4083 | 4060 | 4020 | 3990 | 3950
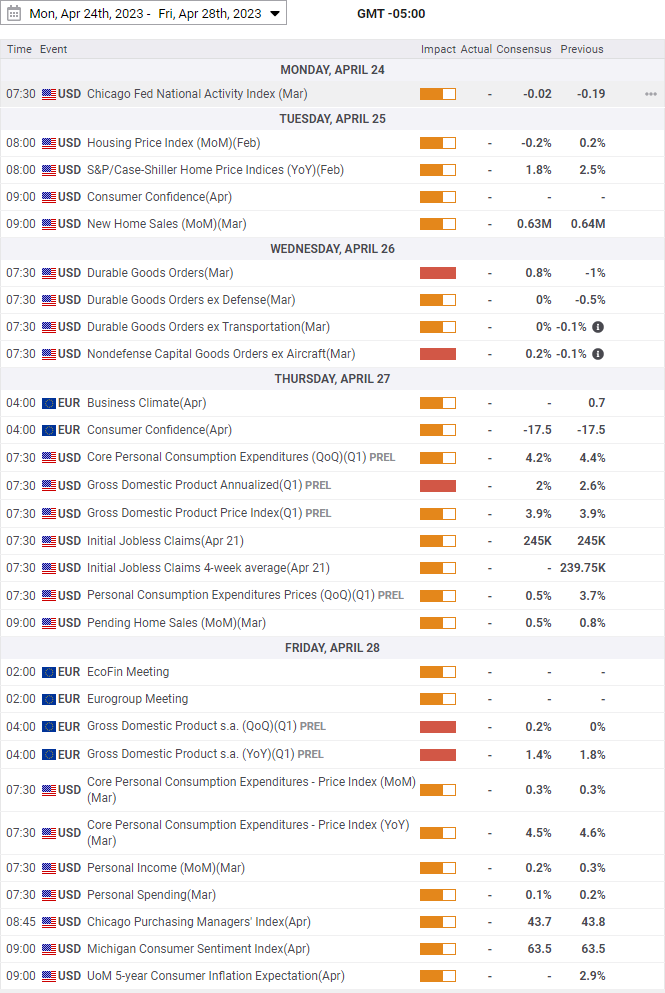
Economic Calendar
Disclaimer: Futures and options trading involves a high level of risk, with the potential for substantial losses. The information provided in this newsletter is for informational purposes only and is not intended to be a trade recommendation. It is the responsibility of the reader to make their own investment decisions and they should seek the advice of a qualified securities professional before making any investments. The owners/authors of this newsletter are not certified as registered financial professionals or investment advisers.


I utilize ichimoku on 1hour chart for levels and they often match your levels. Just an interesting observation I wanted to share. 🎈