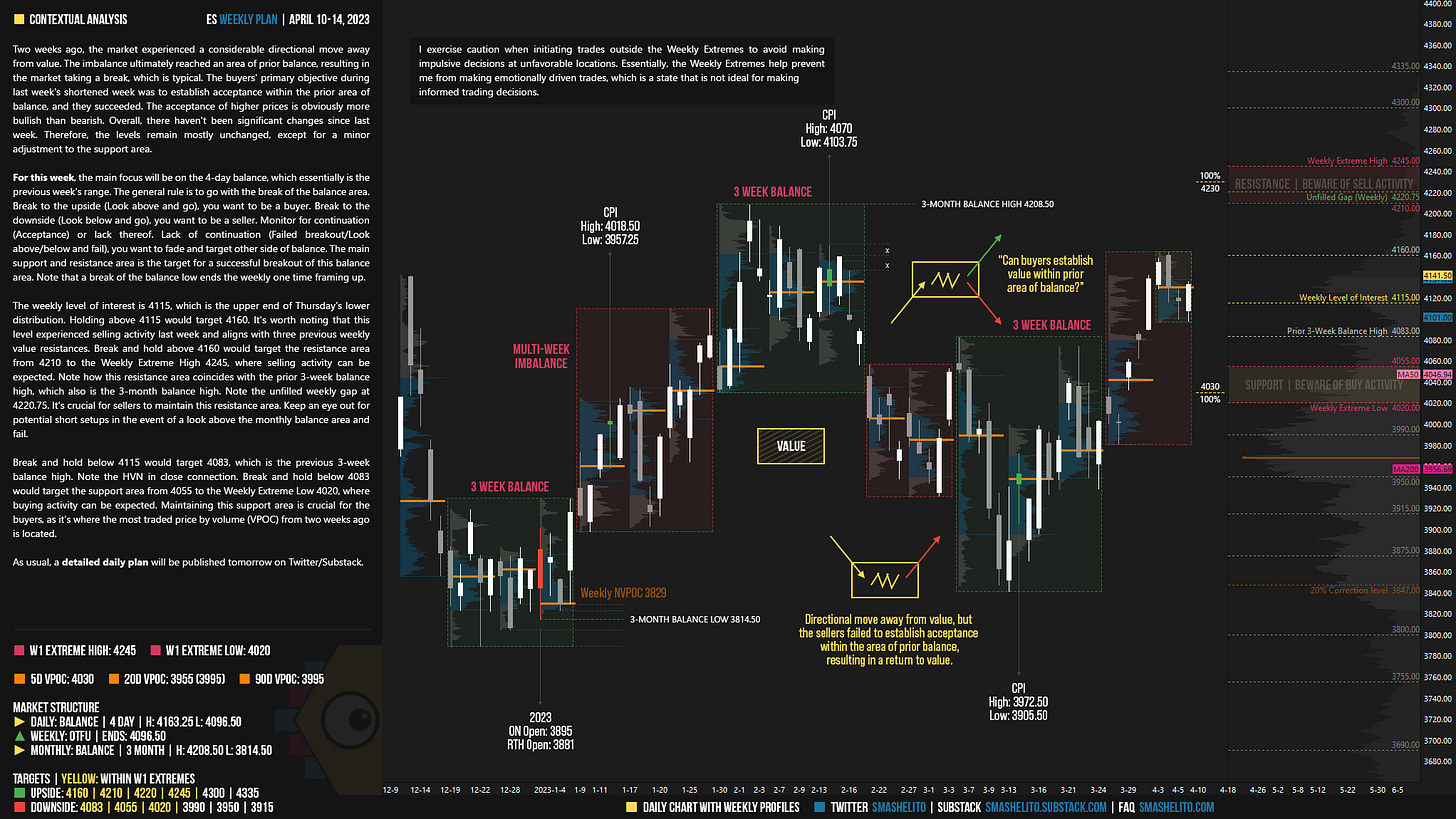
ES Weekly Plan | April 10-14, 2023
Below are my expectations for the week ahead.
🟨 Daily: BALANCE | 4 Day | H: 4163.25 L: 4096.50
🟩 Weekly: OTFU | Ends: 4096.50
🟨 Monthly: BALANCE | 3 Month | H: 4208.50 L: 3814.50
Weekly Extreme High: 4245
Weekly Extreme Low: 4020
As usual, a detailed daily plan will be published tomorrow.
Two weeks ago, the market experienced a considerable directional move away from value. The imbalance ultimately reached an area of prior balance, resulting in the market taking a break, which is typical. The buyers' primary objective during last week's shortened week was to establish acceptance within the prior area of balance, and they succeeded. The acceptance of higher prices is obviously more bullish than bearish. Overall, there haven't been significant changes since last week. Therefore, the levels remain mostly unchanged, except for a minor adjustment to the support area.
For this week, the main focus will be on the 4-day balance, which essentially is the previous week’s range. The general rule is to go with the break of the balance area. Break to the upside (Look above and go), you want to be a buyer. Break to the downside (Look below and go), you want to be a seller. Monitor for continuation (Acceptance) or lack thereof. Lack of continuation (Failed breakout/Look above/below and fail), you want to fade and target other side of balance. The main support and resistance area is the target for a successful breakout of this balance area. Note that a break of the balance low ends the weekly one time framing up.
The weekly level of interest is 4115, which is the upper end of Thursday’s lower distribution. Holding above 4115 would target 4160. It's worth noting that this level experienced selling activity last week and aligns with three previous weekly value resistances. Break and hold above 4160 would target the resistance area from 4210 to the Weekly Extreme High 4245, where selling activity can be expected. Note how this resistance area coincides with the prior 3-week balance high, which also is the 3-month balance high. Note the unfilled weekly gap at 4220.75. It’s crucial for sellers to maintain this resistance area. Keep an eye out for potential short setups in the event of a look above the monthly balance area and fail.
Break and hold below 4115 would target 4083, which is the previous 3-week balance high. Note the HVN in close connection. Break and hold below 4083 would target the support area from 4055 to the Weekly Extreme Low 4020, where buying activity can be expected. Maintaining this support area is crucial for the buyers, as it's where the most traded price by volume (VPOC) from two weeks ago is located.
🟩 Upside: 4160 | 4210 | 4220 | 4245 | 4300 | 4335
🟥 Downside: 4083 | 4055 | 4020 | 3990 | 3950 | 3915
Economic Calendar
Disclaimer: Futures and options trading involves a high level of risk, with the potential for substantial losses. The information provided in this newsletter is for informational purposes only and is not intended to be a trade recommendation. It is the responsibility of the reader to make their own investment decisions and they should seek the advice of a qualified securities professional before making any investments. The owners/authors of this newsletter are not certified as registered financial professionals or investment advisers.


I'm curious about how to define balance. If the OTFD on 4/5 ended, does that mean 4/5 through 4/6 count as 2 days, or should I include 4/3 and 4/4?
how do u compute the VIX range? just by percentages off the levels??