

— For new subscribers
The yellow levels highlighted at the bottom left of the chart are the primary intraday levels I focus on. To avoid impulsive decisions at poor trade locations, I follow a simple but effective rule: exercise caution when initiating trades outside of these yellow levels.
This means I’m cautious about chasing longs above the Final Upside Target (FUT) and shorts below the Final Downside Target (FDT). It’s important to understand that not chasing does not imply initiating a trade in the opposite direction. Discipline over impulse.
Be sure to review the Weekly Plan for a broader perspective, key levels, and market expectations for the week ahead.

Contextual Analysis & Plan
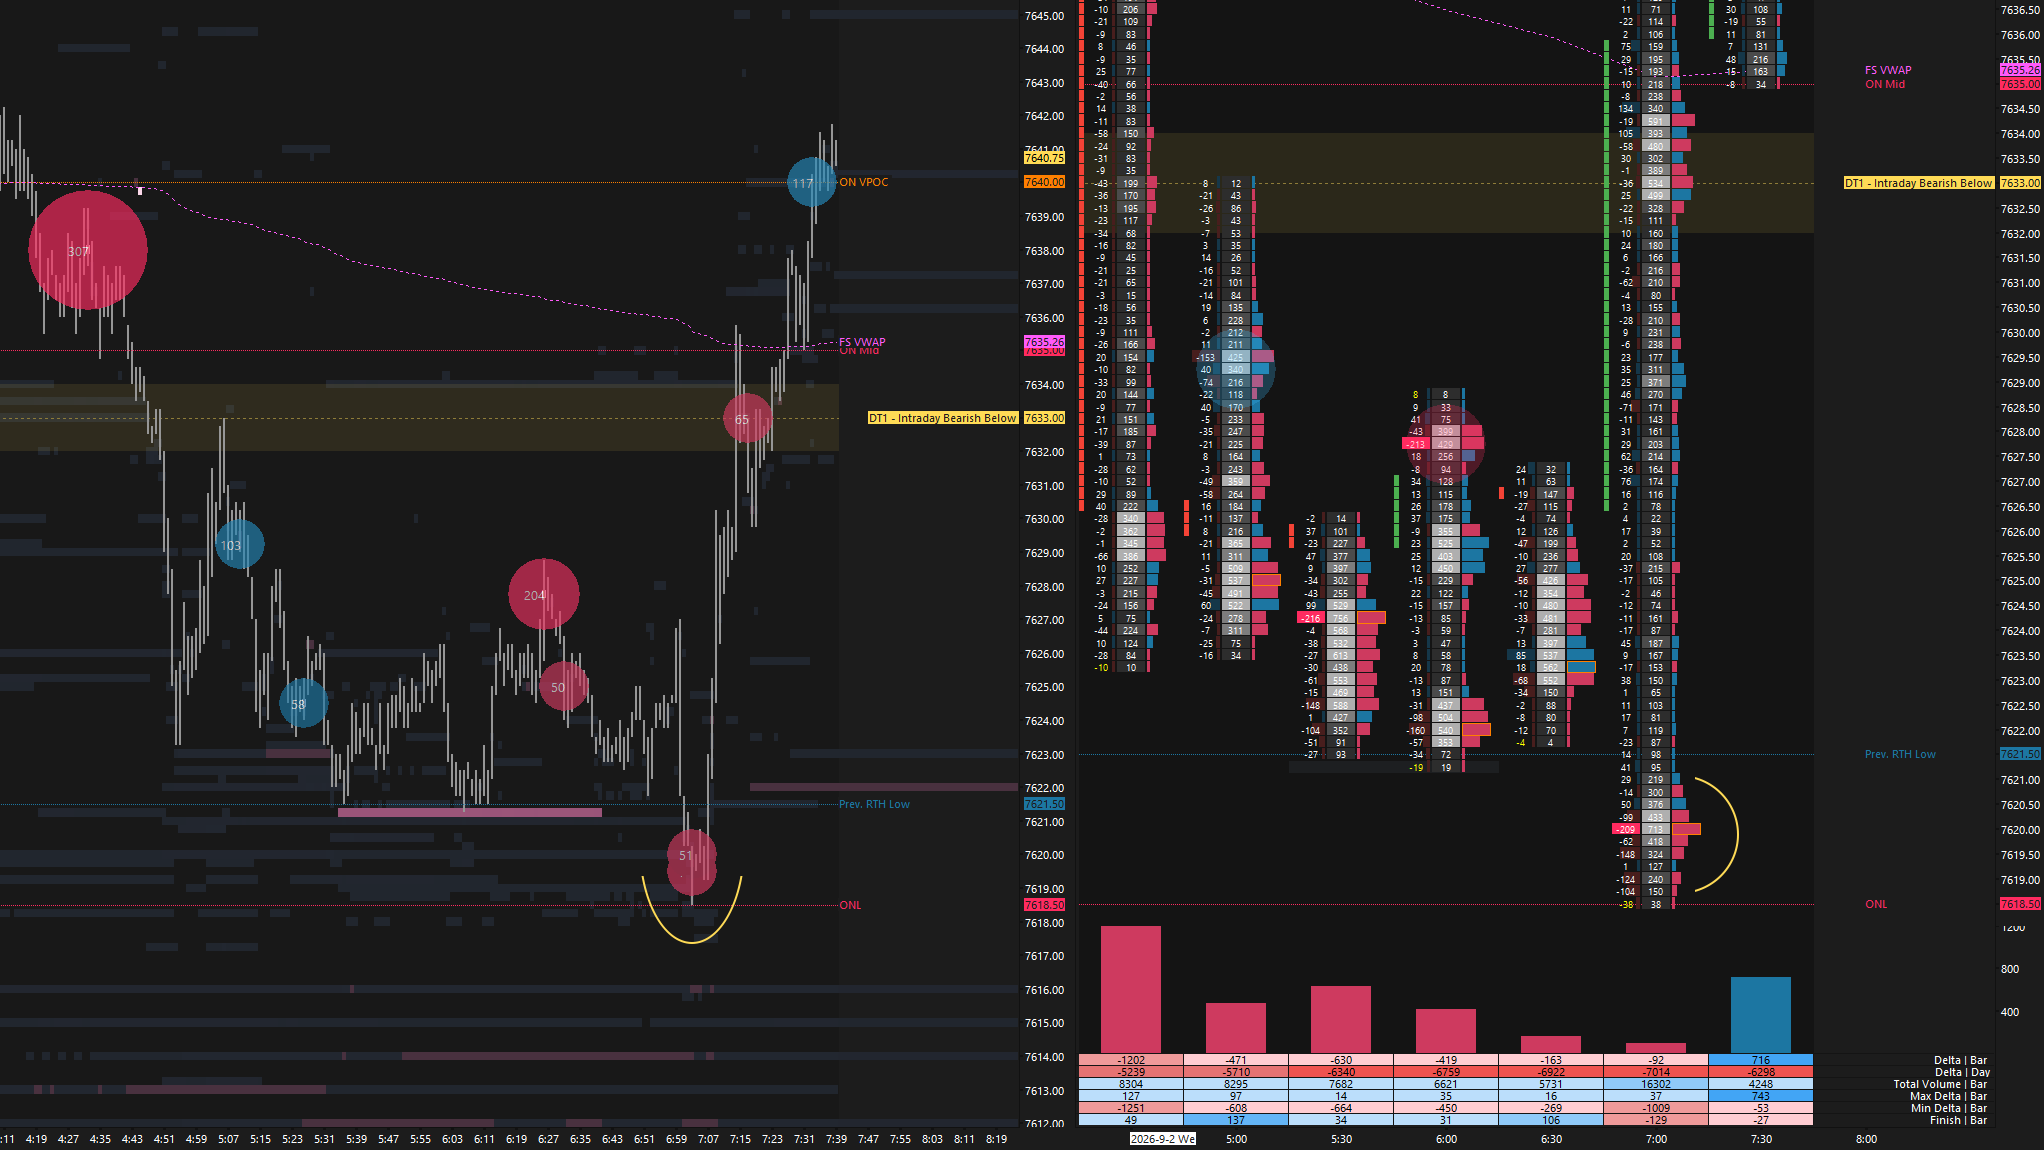
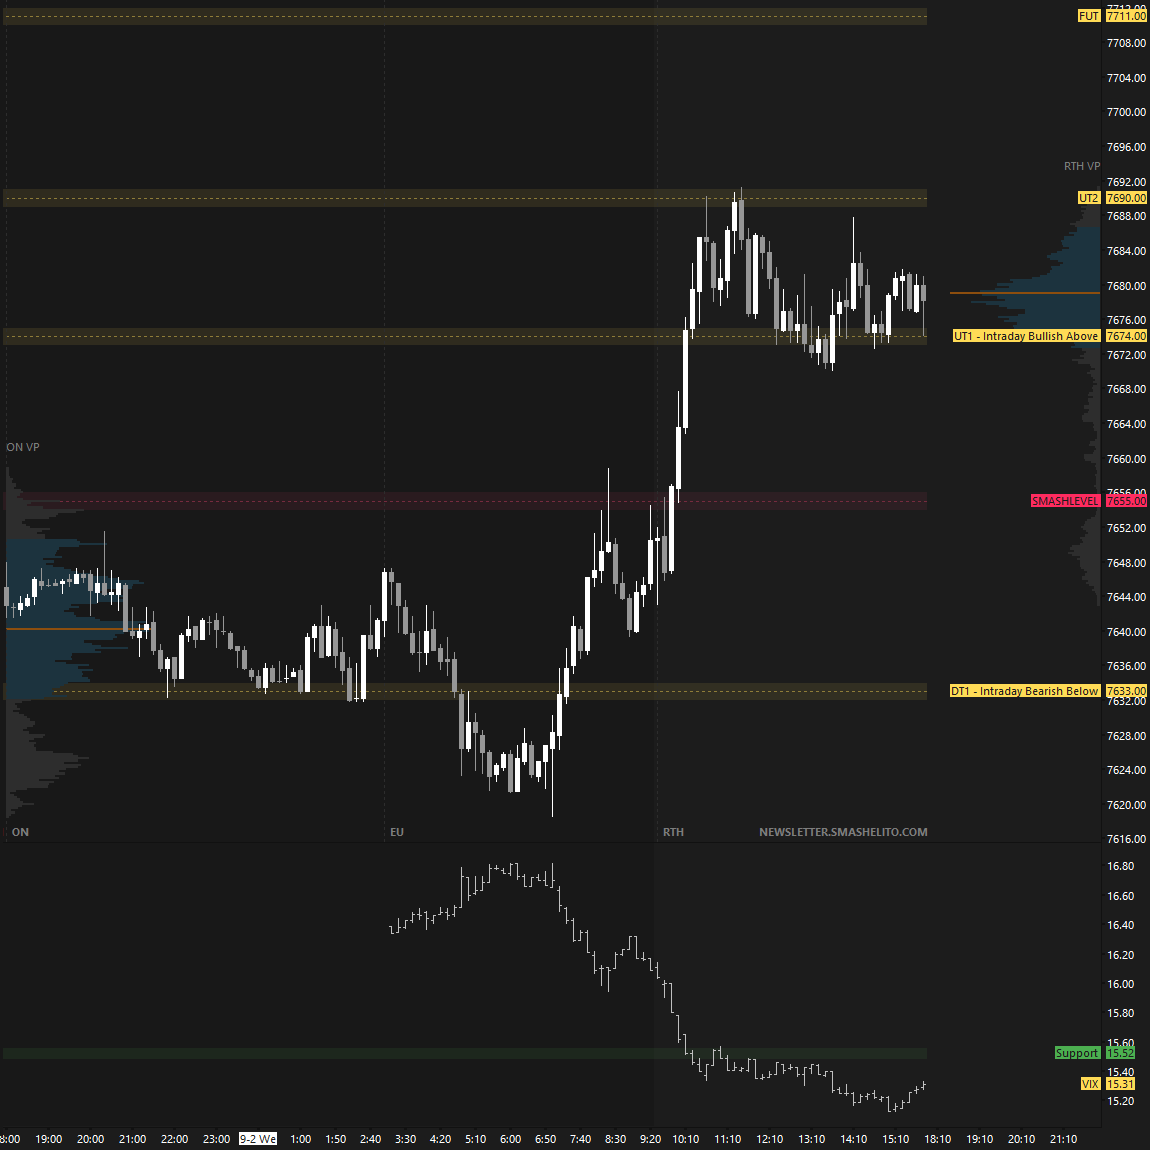
Tuesday’s excess base at 7633 (DT1) was tested multiple times during Asia, finding responsive buyers, but the bounces lacked meaningful follow-through. During the European session, sellers managed to take out 7633, opening the door to further downside. However, a Look Below and Fail of Tuesday’s low triggered a notable reversal (see Figure 1).
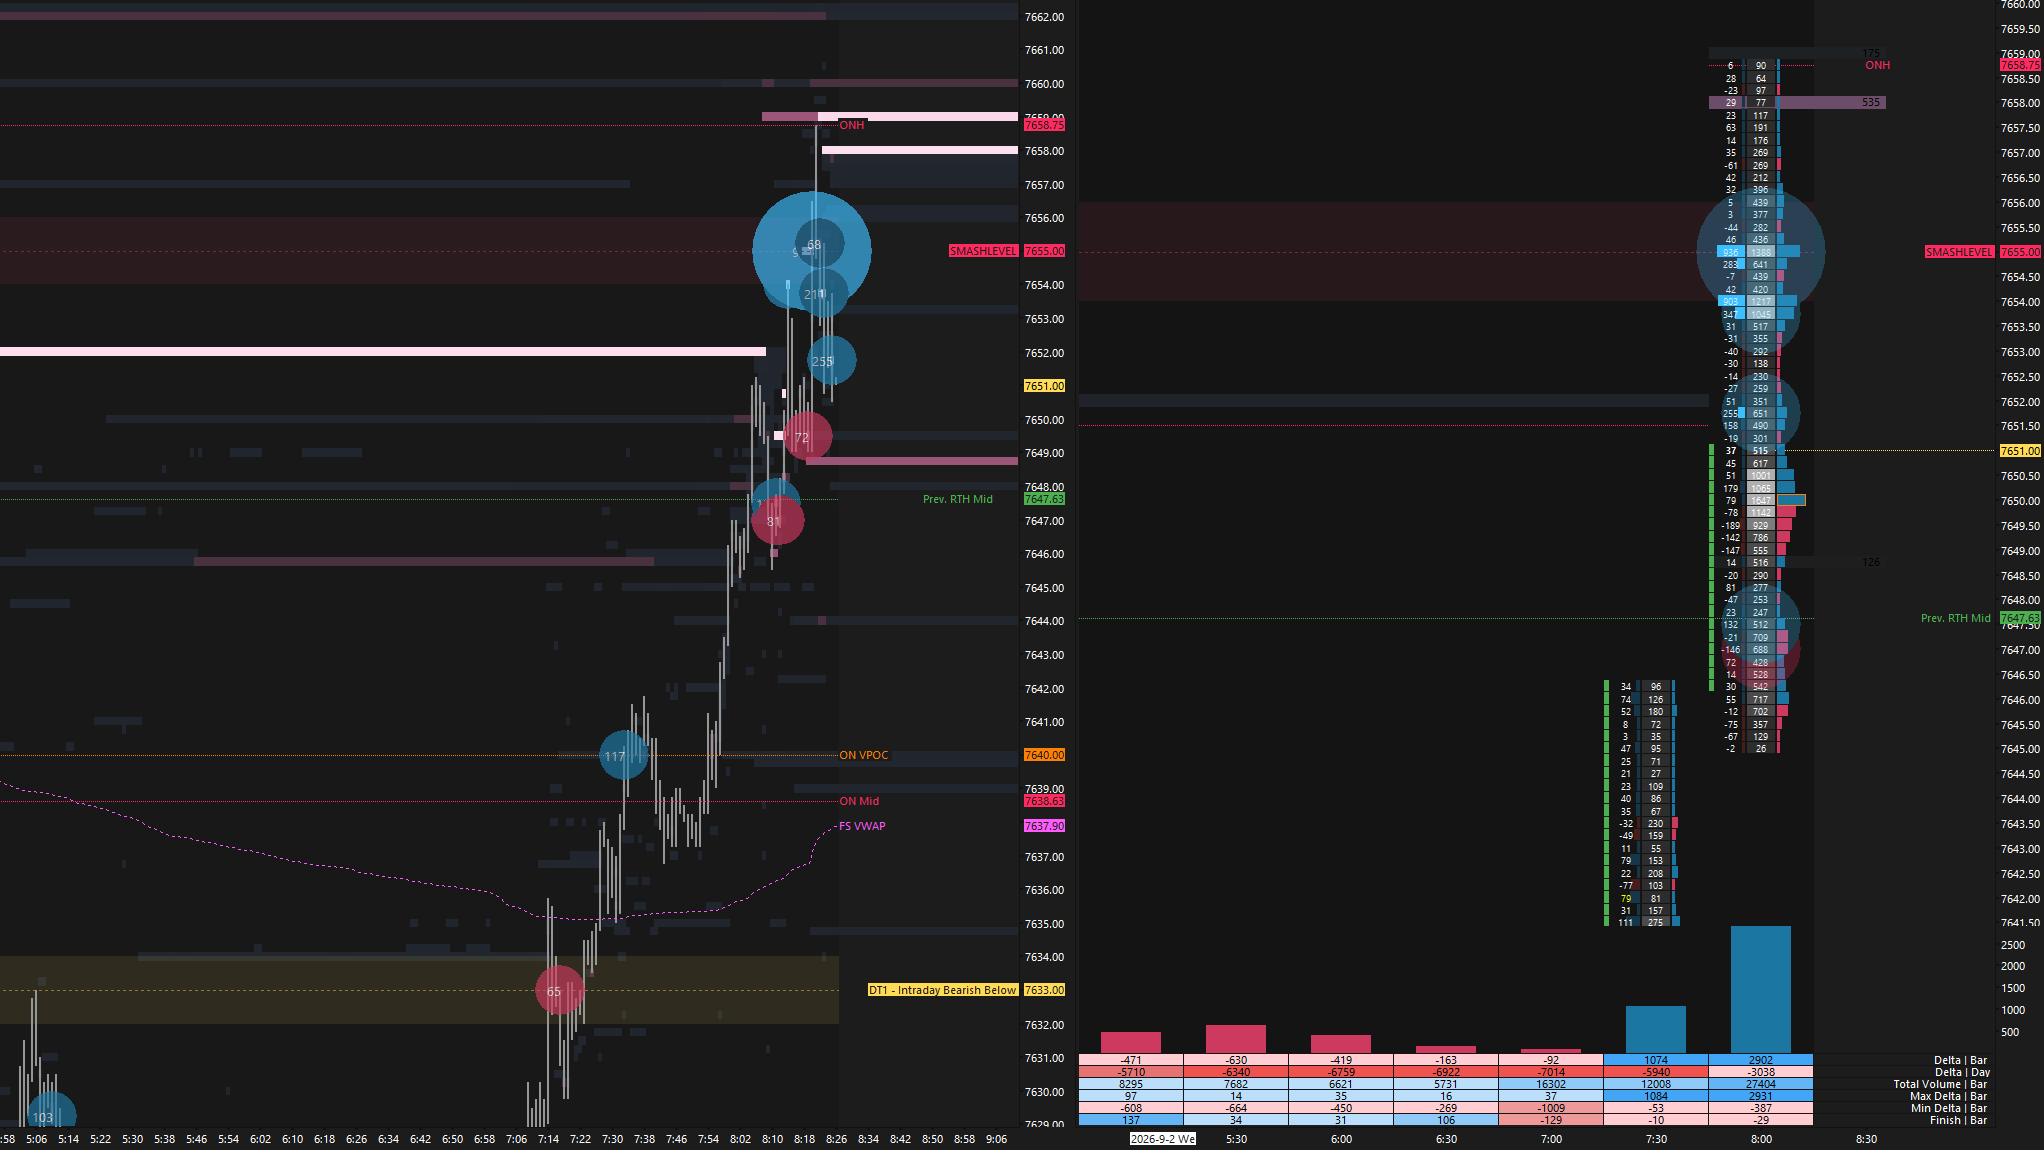
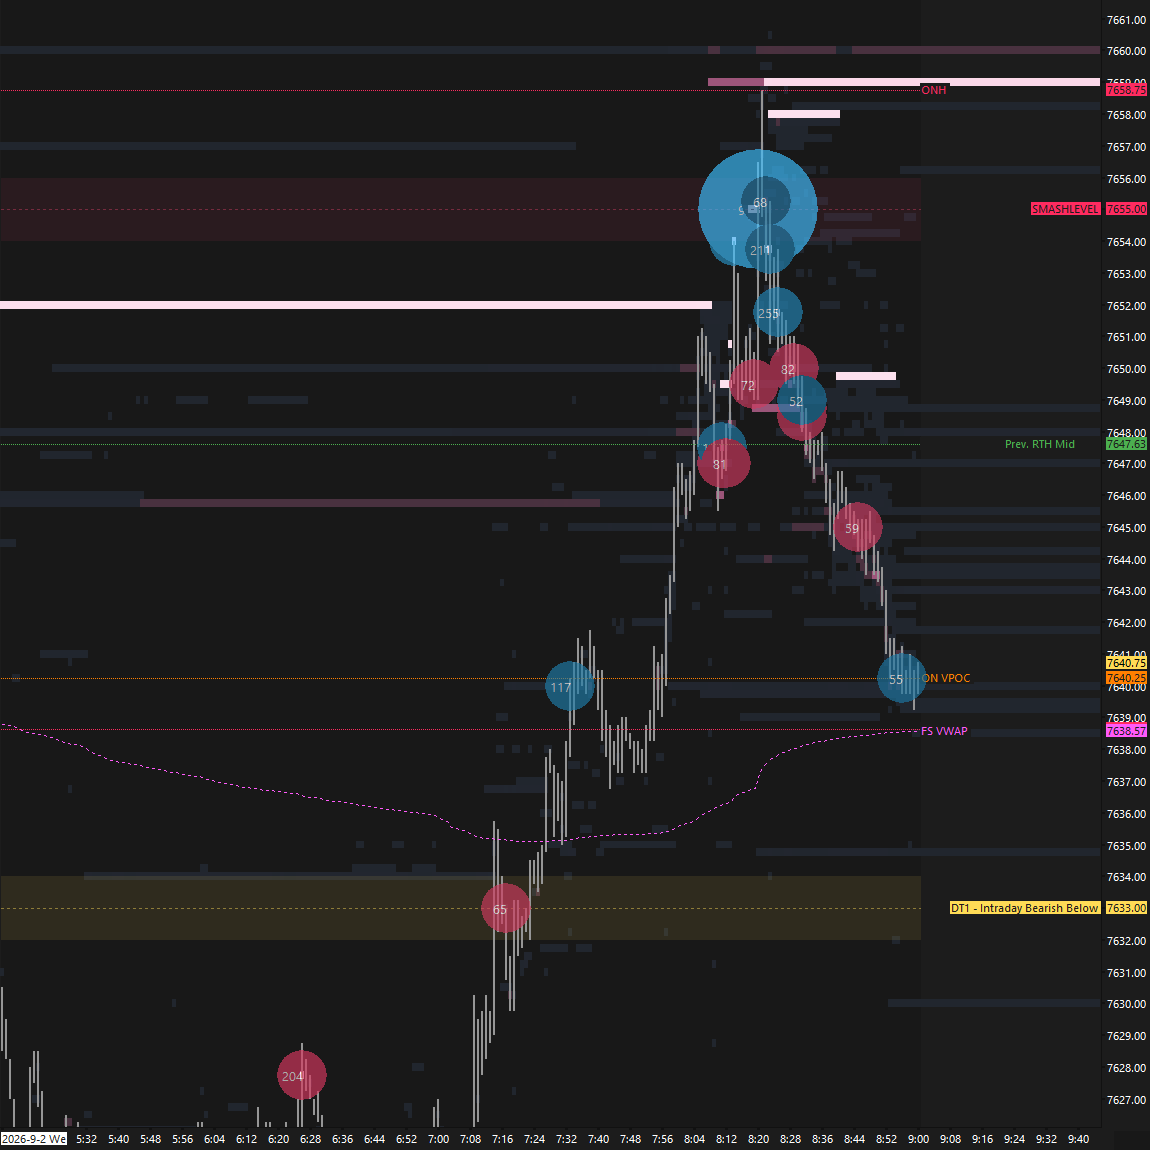
The rotation higher quickly saw a test of 7655 (Smashlevel), where heavy activity was observed before another reversal unfolded (see Figure 2 & 3). Notable order flow activity around a pre-identified level confirms that the area was not only important to us but to other market participants as well.
The RTH session opened right between 7655 and the prior ATH at 7648, with the A-period consolidating around the opening level. Change took place in the B-period, when buyers reclaimed 7655, signaling strength and keeping the broader bullish structure intact. Traction above 7655 triggered short-covering, reflected in the formation of single prints. In the process, Tuesday’s bear gap at 7674 (UT1) was filled, and the auction completed a rotation back to the high volume node at 7690 (UT2), between which the rest of the session consolidated.
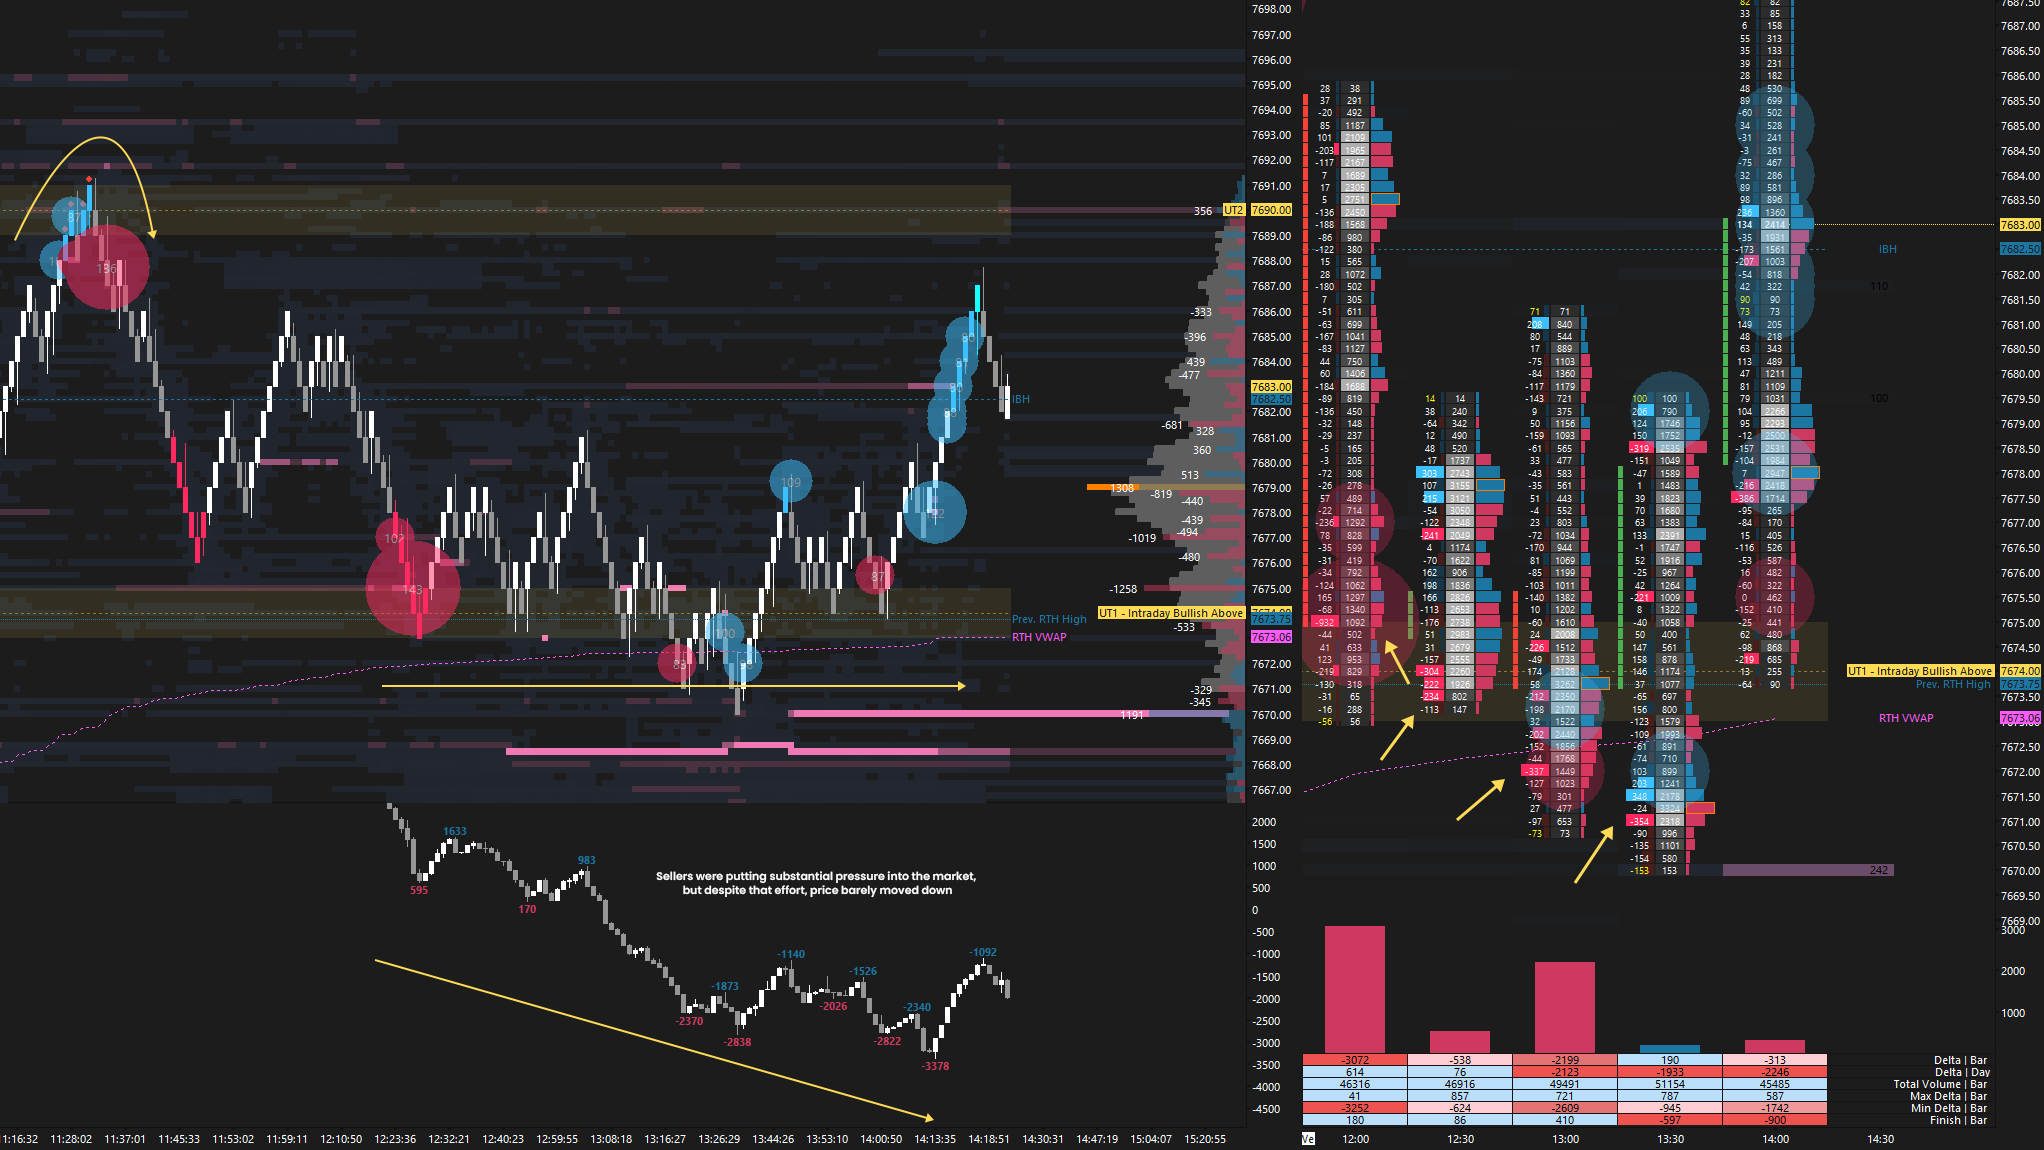
A market that held above 7674 was bullish intraday, which made the significant absorption of aggressive sellers around 7674 a particularly interesting sequence today. Despite big effort, sellers were not able to meaningfully move price lower (see Figure 4). The RTH VWAP was there as confluence, and the VIX held below its support level at 15.52 from the B-period onward. Contextually, it was not a good location to press shorts regardless of what happened next. The market popped higher, but ultimately rotated back to 7674 into the close. Note how both the 5D and 20D VPOCs, representing short-term and medium-term value, have converged within today’s range.
Session Recap
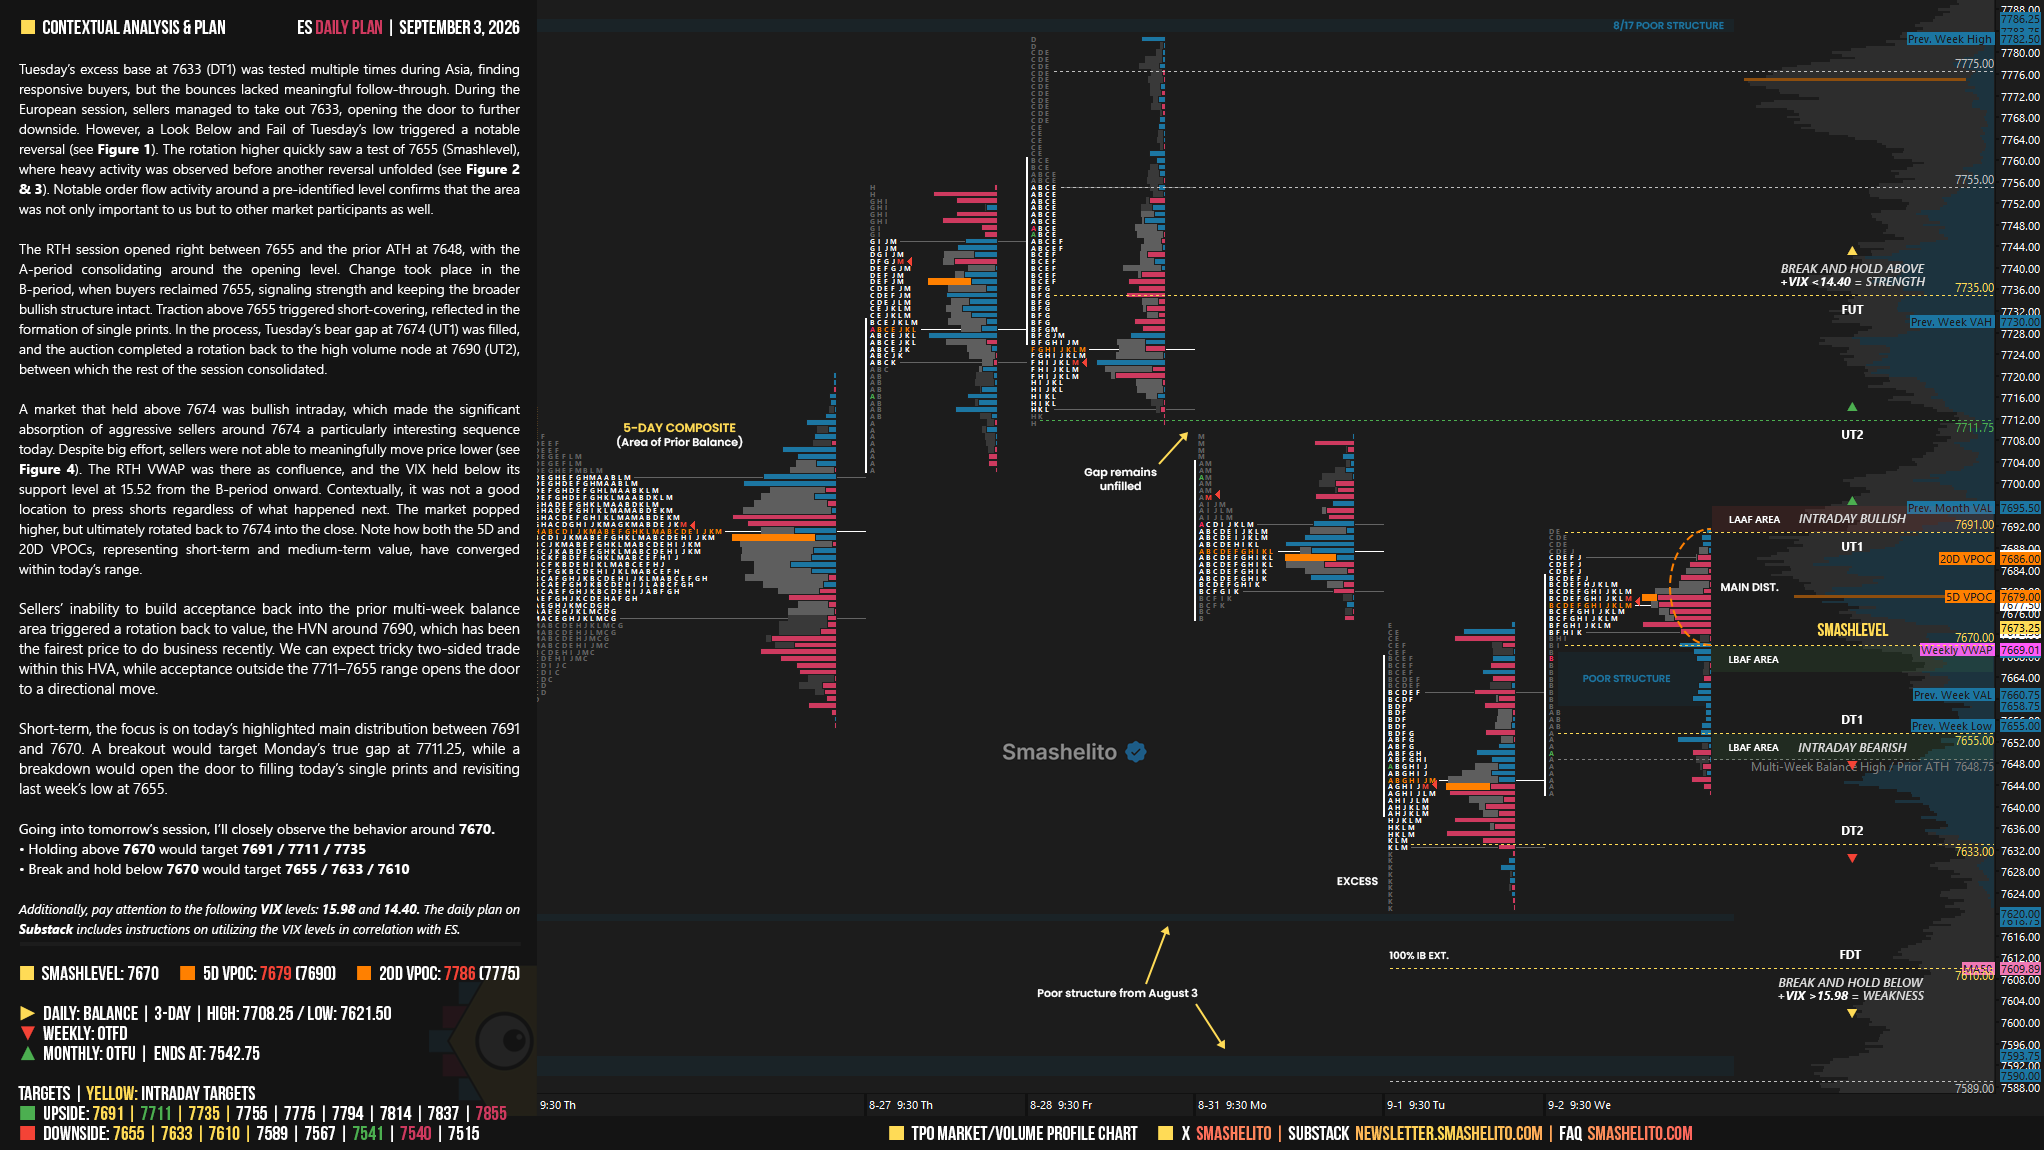
Sellers’ inability to build acceptance back into the prior multi-week balance area triggered a rotation back to value, the HVN around 7690, which has been the fairest price to do business recently. We can expect tricky two-sided trade within this HVA, while acceptance outside the 7711–7655 range opens the door to a directional move.
Short-term, the focus is on today’s highlighted main distribution between 7691 and 7670. A breakout would target Monday’s true gap at 7711.25, while a breakdown would open the door to filling today’s single prints and revisiting last week’s low at 7655.
In terms of levels, the Smashlevel is at 7670, the lower end of today’s main distribution. Holding above 7670 signals stability and targets today’s poor high at 7691 (UT1). Acceptance above 7691 would signal intraday strength, targeting Monday’s bear gap at 7711 (UT2), with 7735 (FUT) serving as the final upside target under sustained buying pressure.
On the flip side, failure to hold 7670 shifts focus to last week’s low at 7655 (DT1). Acceptance below 7655 would signal intraday weakness, targeting Tuesday’s excess base at 7633 (DT2), with 7610 (FDT) serving as the final downside target under sustained selling pressure.
Visual Representation
Levels of Interest
Going into tomorrow’s session, I’ll closely observe the behavior around 7670.
Holding above 7670 would target 7691 / 7711 / 7735
Break and hold below 7670 would target 7655 / 7633 / 7610
Additionally, pay attention to the following VIX levels: 15.98 and 14.40. These levels can provide confirmation of strength or weakness.
Break and hold above 7735 with VIX below 14.40 would confirm strength.
Break and hold below 7610 with VIX above 15.98 would confirm weakness.
Overall, it's important to exercise caution when trading outside of the highlighted yellow levels. A non-cooperative VIX may suggest possible reversals i.e trade setups.
Thanks smash
Great job
You are making better traders out of your follower
Fantastic work Smash! Thank you!