

— For new subscribers
The yellow levels highlighted at the bottom left of the chart are the primary intraday levels I focus on. To avoid impulsive decisions at poor trade locations, I follow a simple but effective rule: exercise caution when initiating trades outside of these yellow levels.
This means I’m cautious about chasing longs above the Final Upside Target (FUT) and shorts below the Final Downside Target (FDT). It’s important to understand that not chasing does not imply initiating a trade in the opposite direction. Discipline over impulse.
Be sure to review the Weekly Plan for a broader perspective, key levels, and market expectations for the week ahead.

Contextual Analysis & Plan
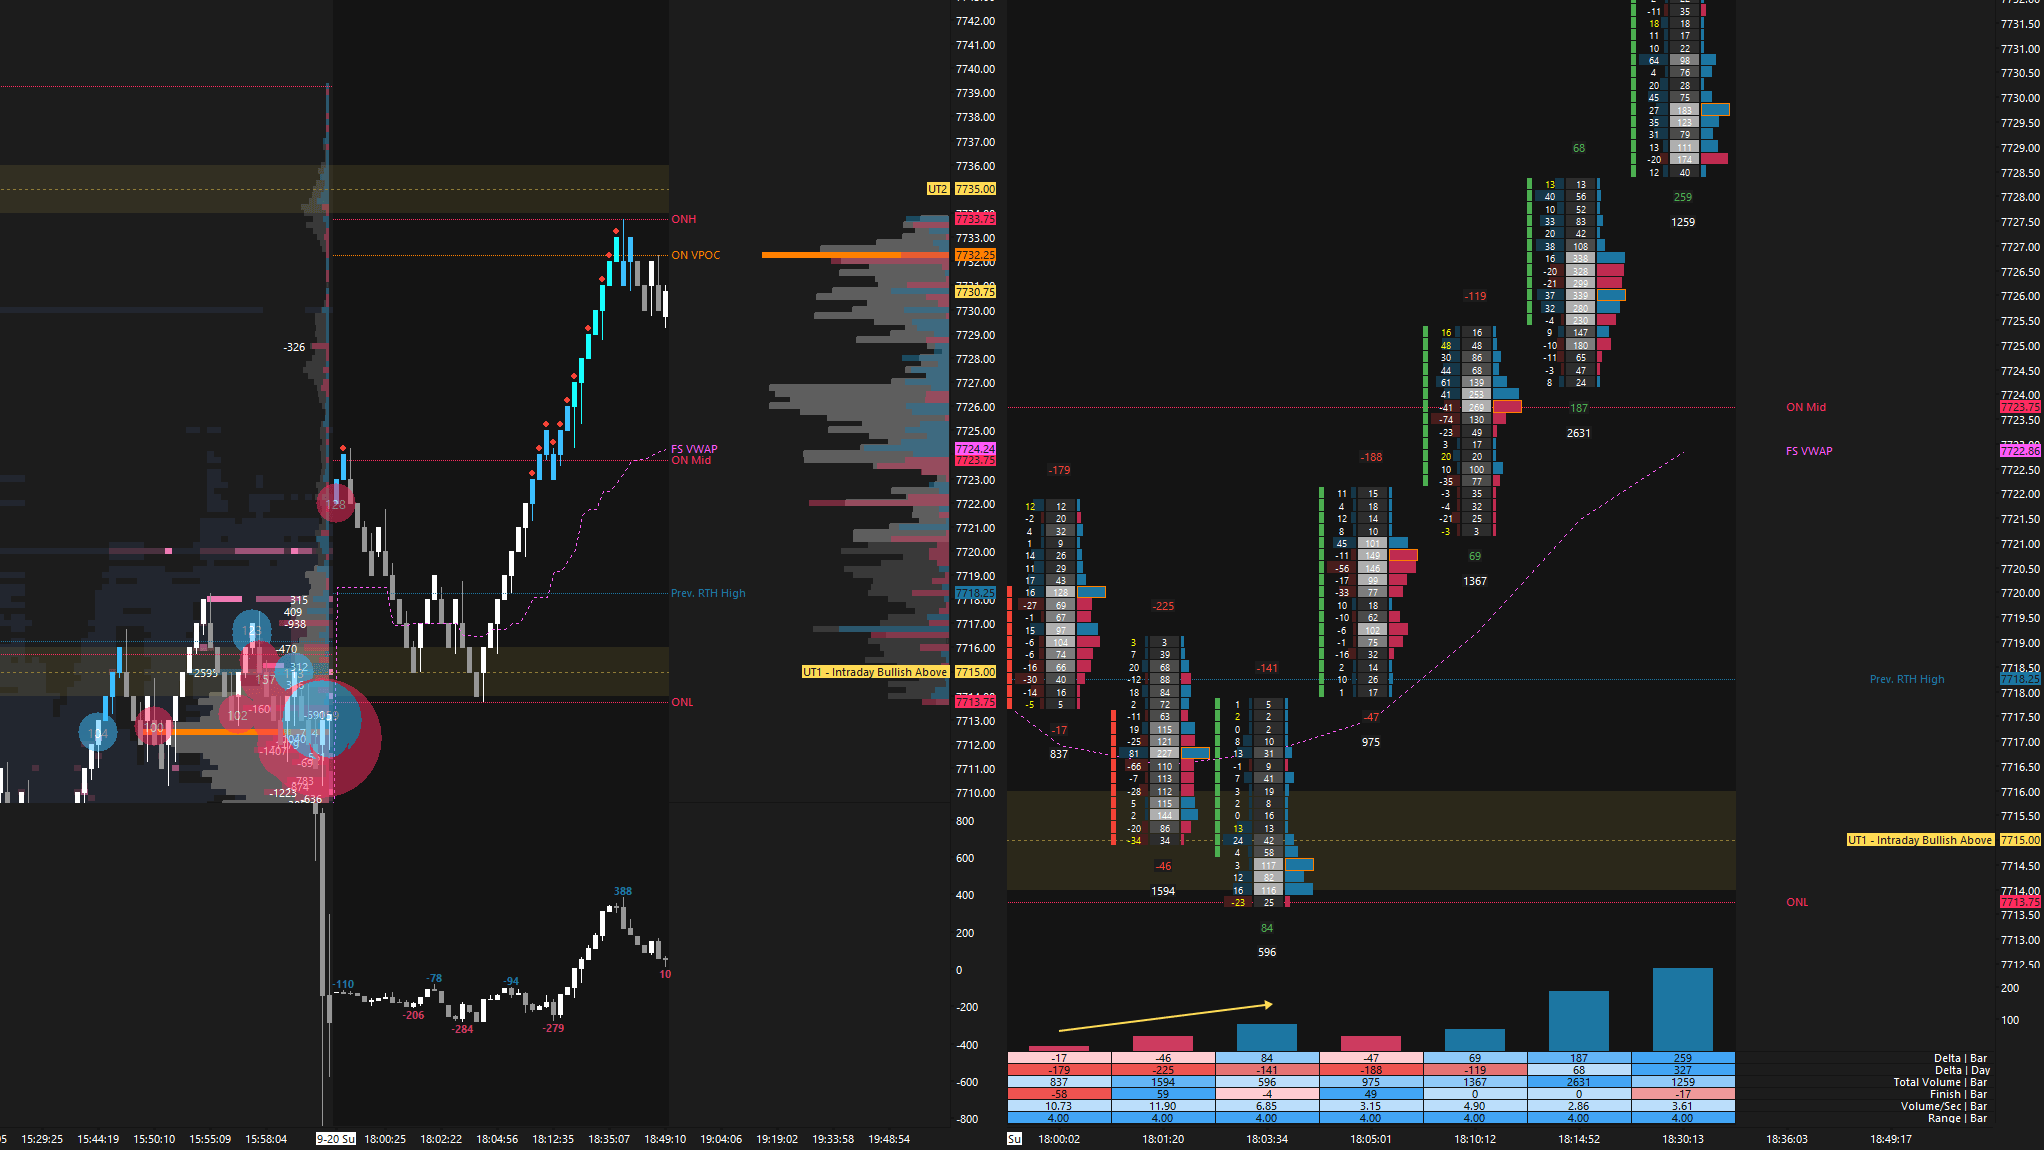
The overnight session opened above last week’s high at 7720, and buyers immediately defended 7715 (UT1) on the early pullback, signaling strength (see Figure 1). This sequence ultimately marked the low of the day. The main objective for buyers was to break the pattern of lower highs on the weekly timeframe, making the early defense of 7715 an important sign of strength. The final upside target at 7757 (FUT) was reached shortly after the Euro session opened, where price briefly paused before pushing higher.
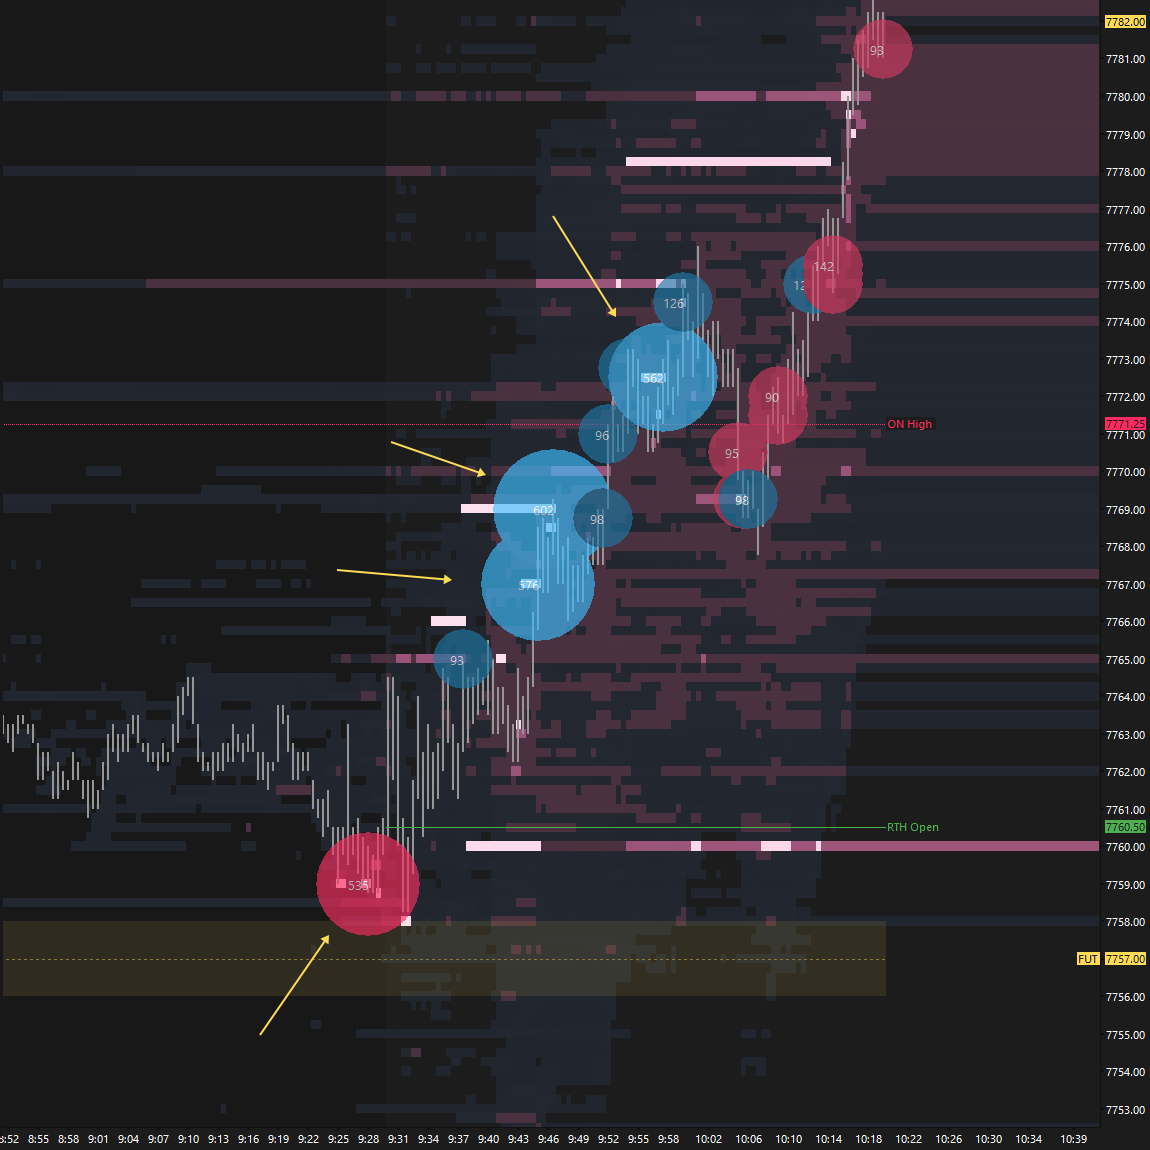
The overnight strength led the RTH session to open with a notable true gap higher, above 7757 (FUT). With overnight inventory 100% net long, the expectation was for a counter-auction (pullback) after the open. Failure to see one would have signaled extreme strength, as we have discussed before. The auction spent a few seconds below the opening level, finding buyers where aggressive sellers were trapped pre-open. This was followed by notable aggressive buying on the tape (see Figure 2).
I’m typically not involved in sessions that are trading above FUT if I don’t have a position already. The VIX was not on board with today’s strength, but as we discussed in the Weekly Plan, failure to find sellers at 7757 opened the door to a revisit of the all-time highs, which was ultimately accomplished during the afternoon session.
Today’s session came a few handles shy of tagging the Weekly Extreme High at 7855, our target for the week. This potentially makes the rest of the week tricky to trade. Acceptance above 7855, meaning value building above the prior ATH, would not provide favorable context for fading, while failure to do so would open the door to a potentially sizable pullback or two-sided trade without necessarily implying meaningful bearishness. It’s not uncommon for price action to become uneventful after a move like today’s, which can be frustrating for traders who were not part of it. Mind your step for the rest of the week.
Session Recap
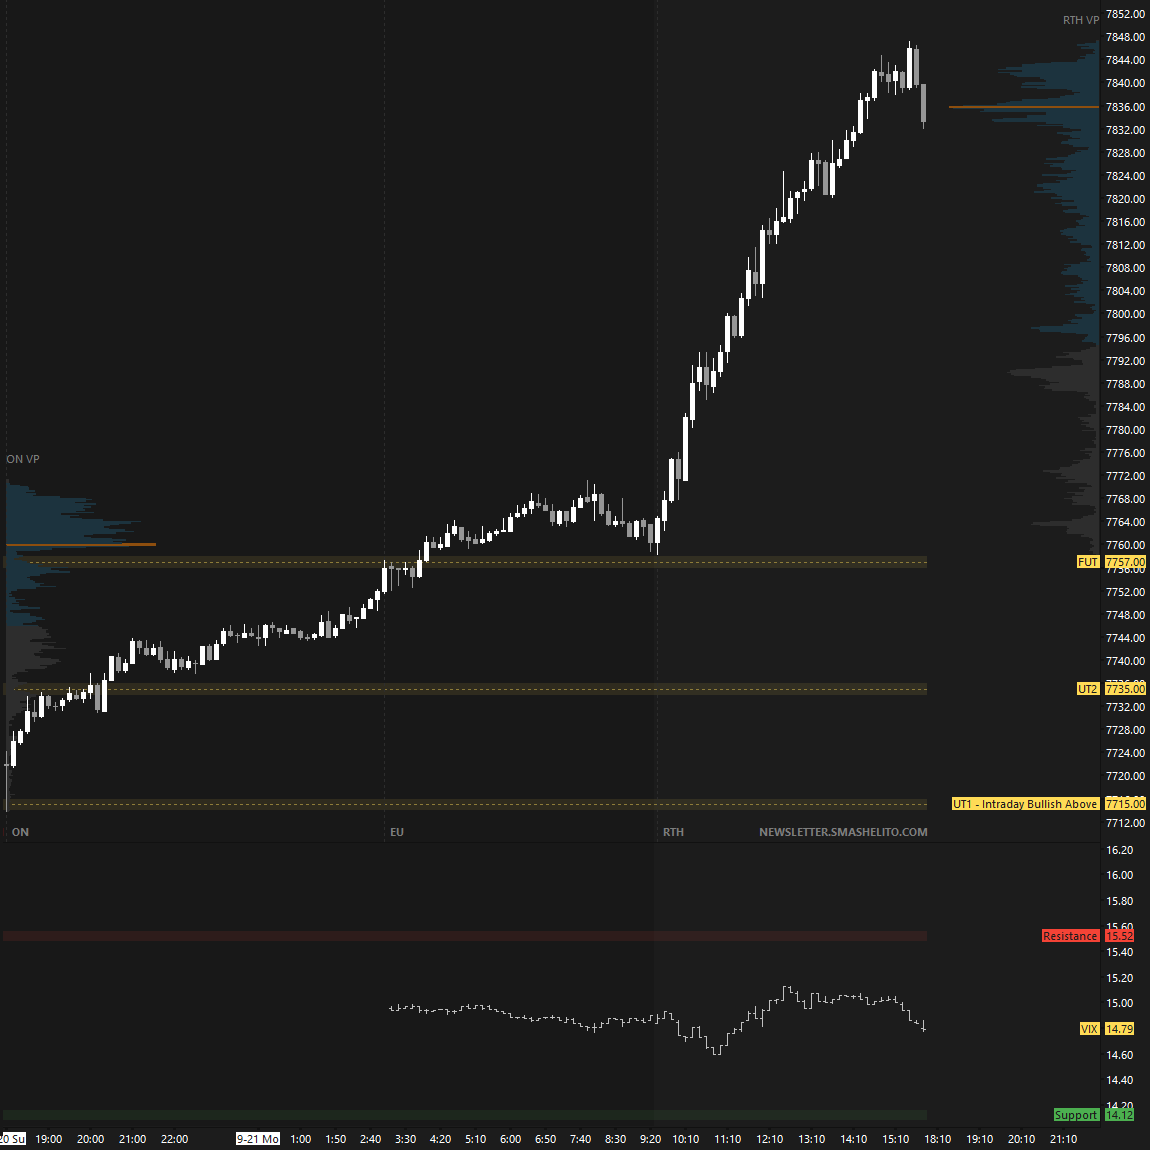
Breaking the pattern of lower highs on the weekly chart opened the door to a revisit of the all-time highs—a scenario that ultimately played out today.
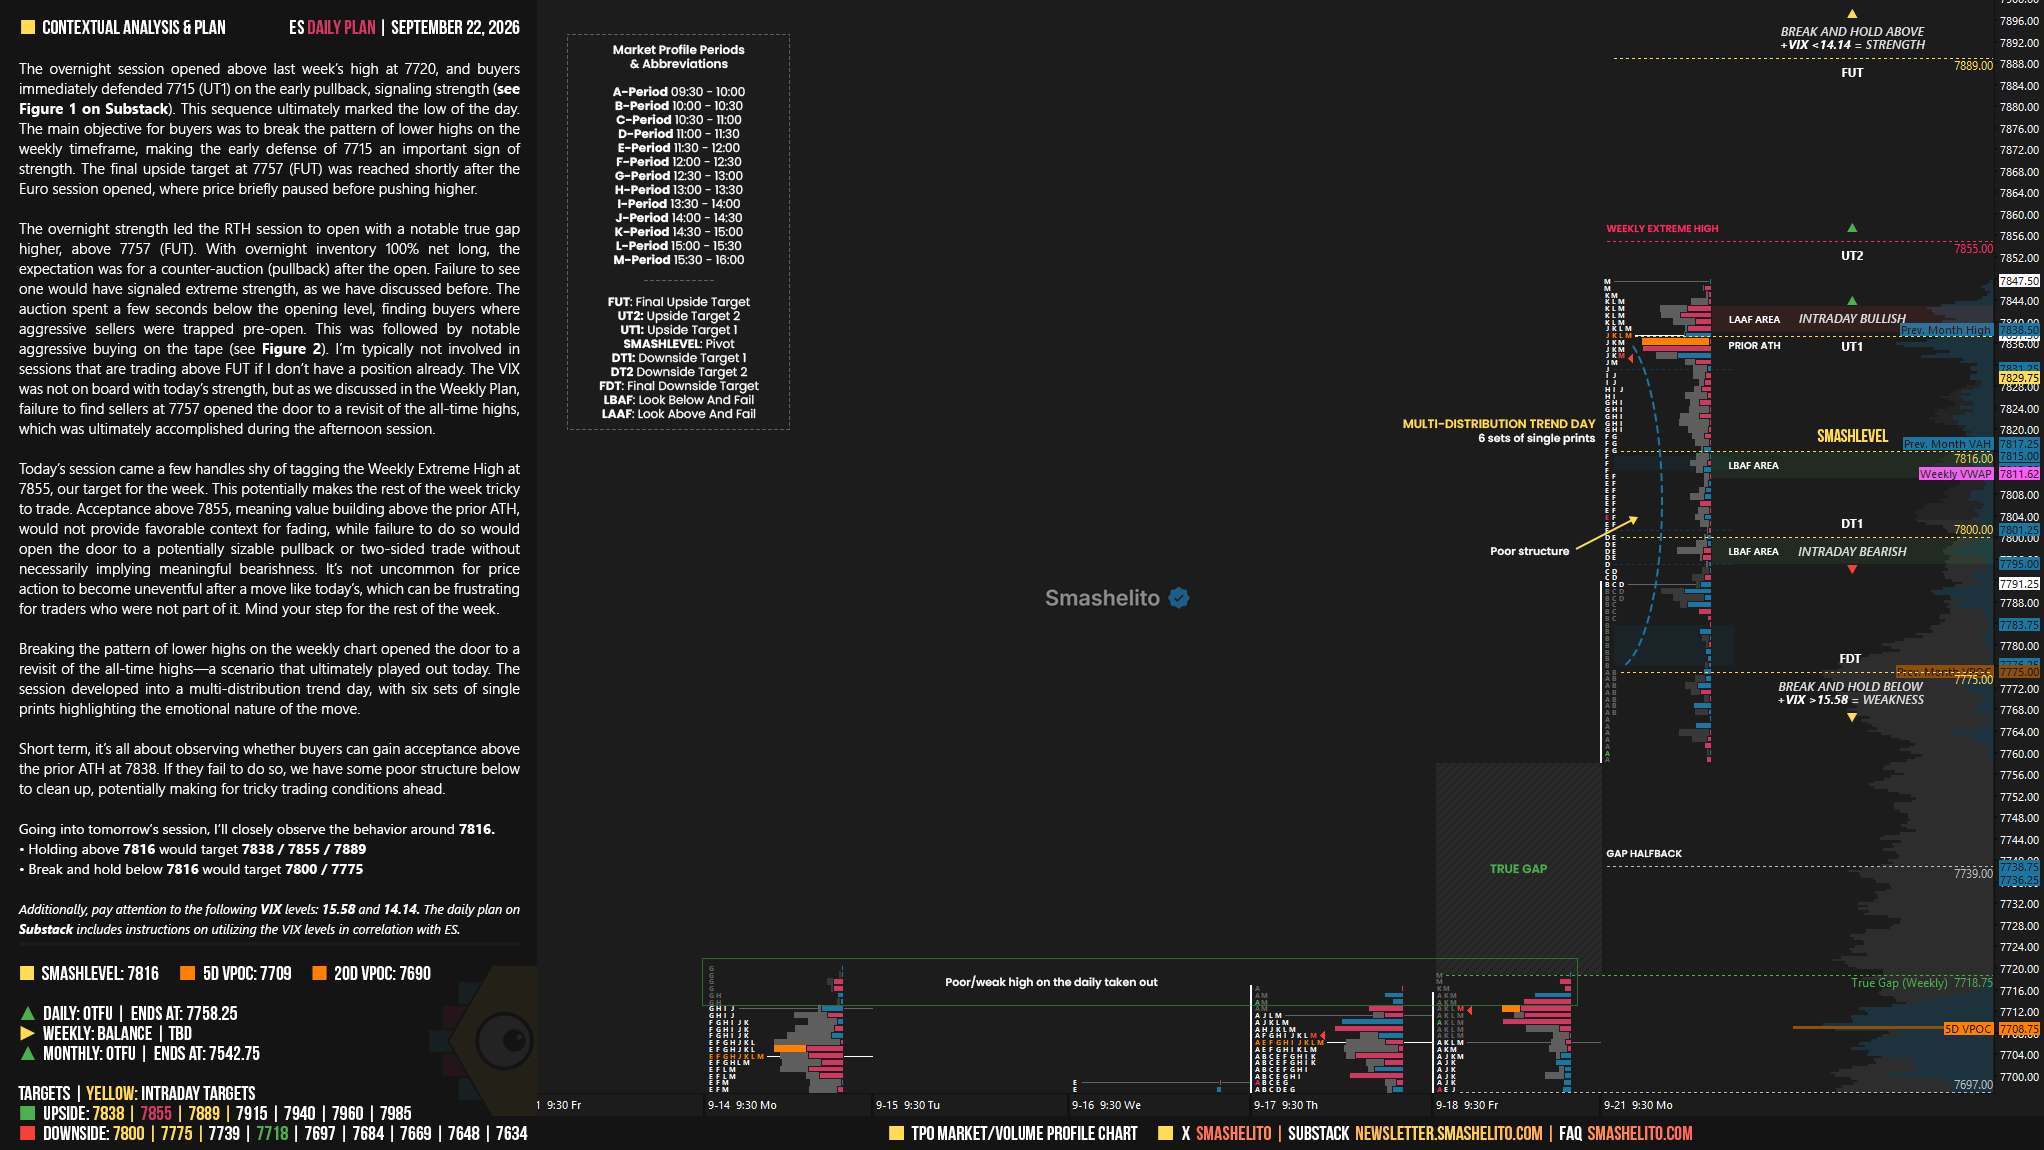
The session developed into a multi-distribution trend day, with six sets of single prints highlighting the emotional nature of the move.
Short term, it’s all about observing whether buyers can gain acceptance above the prior ATH at 7838. If they fail to do so, we have some poor structure below to clean up, potentially making for tricky trading conditions ahead.
In terms of levels, the Smashlevel is at 7816, the top of the F-period single prints, which aligns with last month’s VAH. Holding above 7816 would target the prior ATH at 7838 (UT1), where a potential LAAF is of interest. Acceptance above 7838 would signal intraday strength, targeting the Weekly Extreme High at 7855 (UT2), with 7889 (FUT), the 300% IB extension, serving as the final upside target under sustained buying pressure.
On the flip side, failure to hold 7816 would shift focus to 7800 (DT1), where a potential LBAF is of interest, with 7775 (FDT), the HVN, serving as the final downside target under sustained selling pressure.
Visual Representation
Levels of Interest
Going into tomorrow’s session, I’ll closely observe the behavior around 7816.
Holding above 7816 would target 7838 / 7855 / 7889
Break and hold below 7816 would target 7800 / 7775
Additionally, pay attention to the following VIX levels: 15.58 and 14.14. These levels can provide confirmation of strength or weakness.
Break and hold above 7889 with VIX below 14.14 would confirm strength.
Break and hold below 7775 with VIX above 15.58 would confirm weakness.
Overall, it's important to exercise caution when trading outside of the highlighted yellow levels. A non-cooperative VIX may suggest possible reversals i.e trade setups.
Thanks Smash! Not gonna lie, I don't like days like this even if I was in the move. Makes confusing trading in the coming days more likely.
Seems like a lot of Franks follow you
😂😂😂