

— For new subscribers
The yellow levels highlighted at the bottom left of the chart are the primary intraday levels I focus on. To avoid impulsive decisions at poor trade locations, I follow a simple but effective rule: exercise caution when initiating trades outside of these yellow levels.
This means I’m cautious about chasing longs above the Final Upside Target (FUT) and shorts below the Final Downside Target (FDT). It’s important to understand that not chasing does not imply initiating a trade in the opposite direction. Discipline over impulse.
Be sure to review the Weekly Plan for a broader perspective, key levels, and market expectations for the week ahead.

Contextual Analysis & Plan
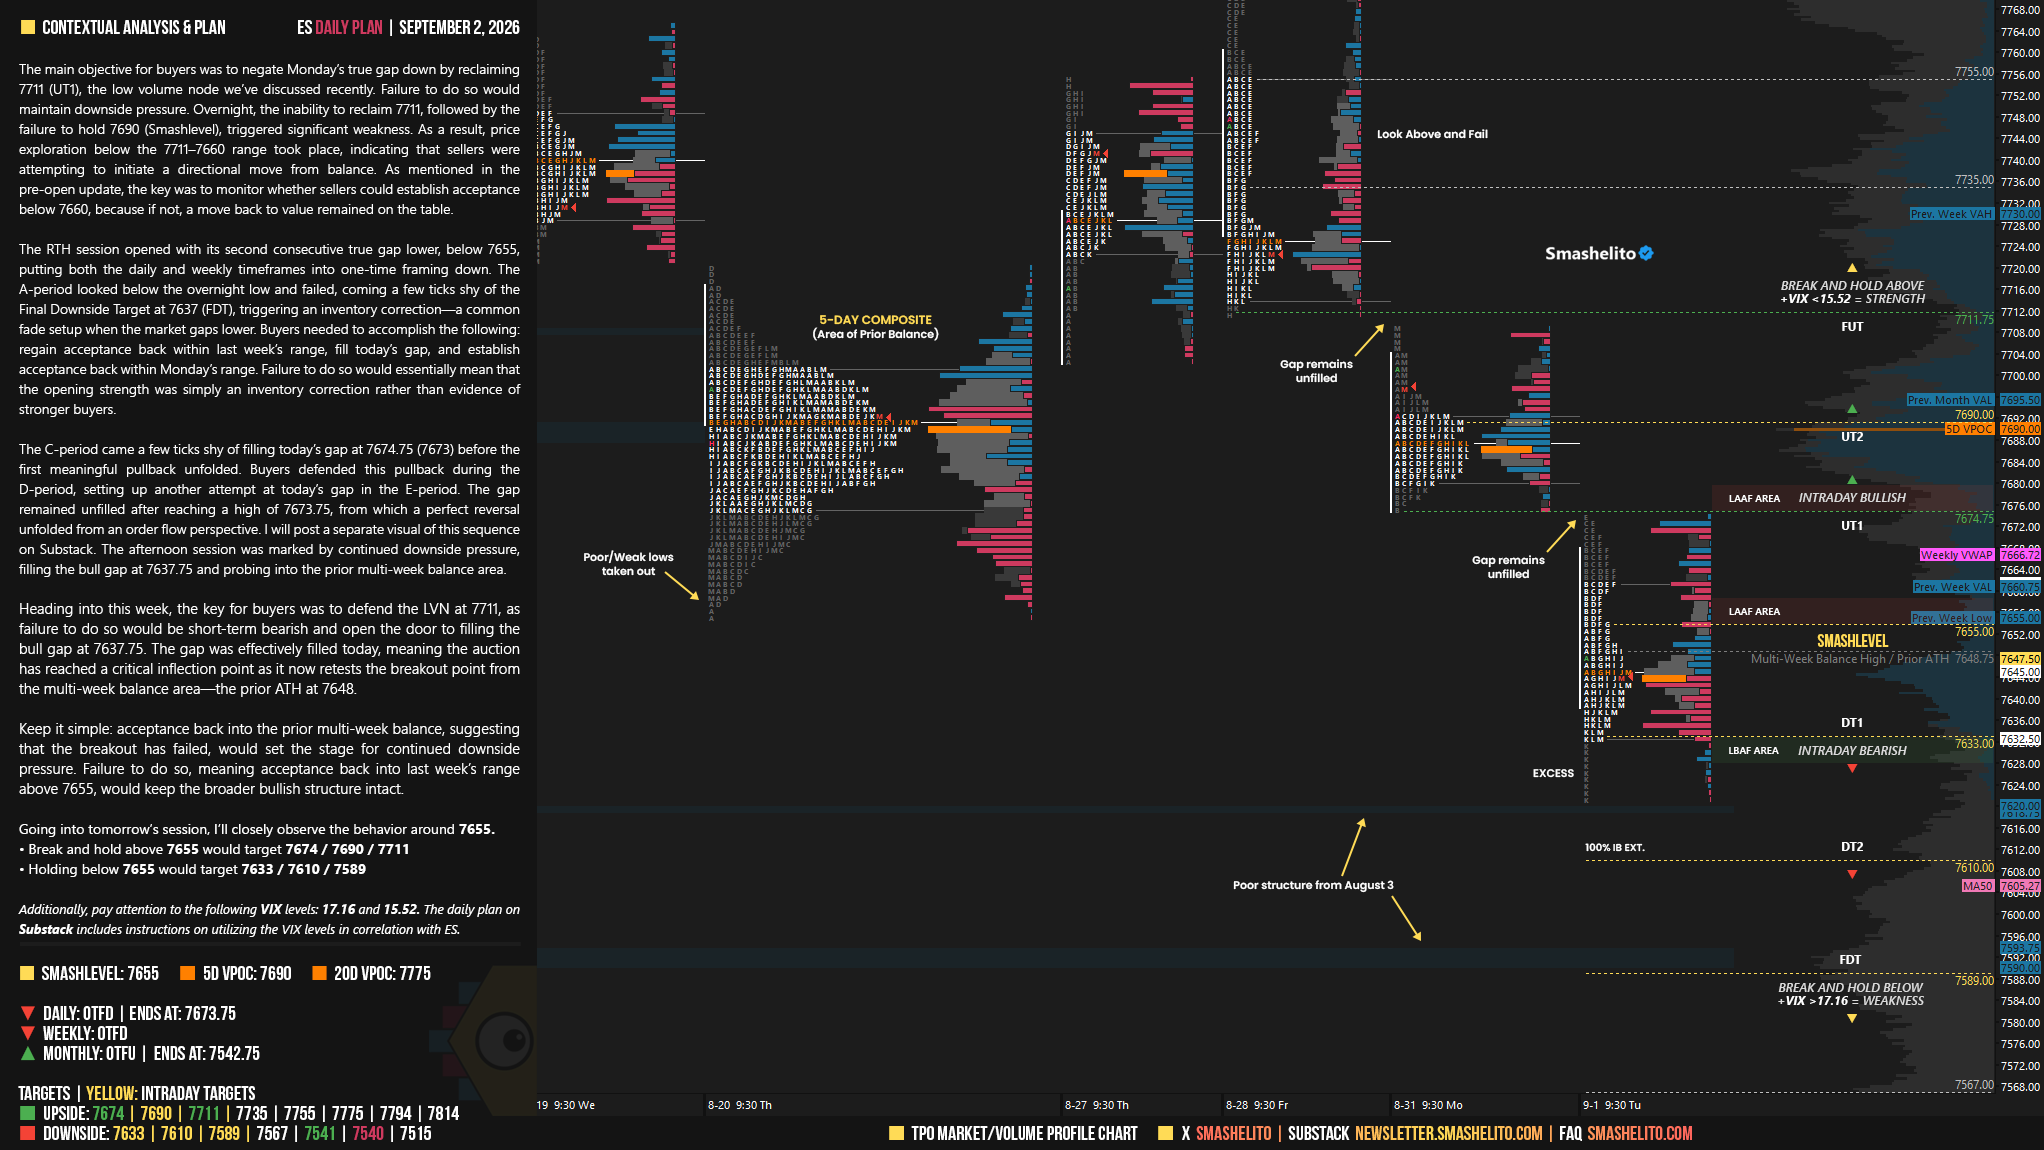
The main objective for buyers was to negate Monday’s true gap down by reclaiming 7711 (UT1), the low volume node we’ve discussed recently. Failure to do so would maintain downside pressure. Overnight, the inability to reclaim 7711, followed by the failure to hold 7690 (Smashlevel), triggered significant weakness. As a result, price exploration below the 7711–7660 range took place, indicating that sellers were attempting to initiate a directional move from balance. As mentioned in the pre-open update, the key was to monitor whether sellers could establish acceptance below 7660, because if not, a move back to value remained on the table.
The RTH session opened with its second consecutive true gap lower, below 7655, putting both the daily and weekly timeframes into one-time framing down. The A-period looked below the overnight low and failed, coming a few ticks shy of the Final Downside Target at 7637 (FDT), triggering an inventory correction—a common fade setup when the market gaps lower. Buyers needed to accomplish the following: regain acceptance back within last week’s range, fill today’s gap, and establish acceptance back within Monday’s range. Failure to do so would essentially mean that the opening strength was simply an inventory correction rather than evidence of stronger buyers.
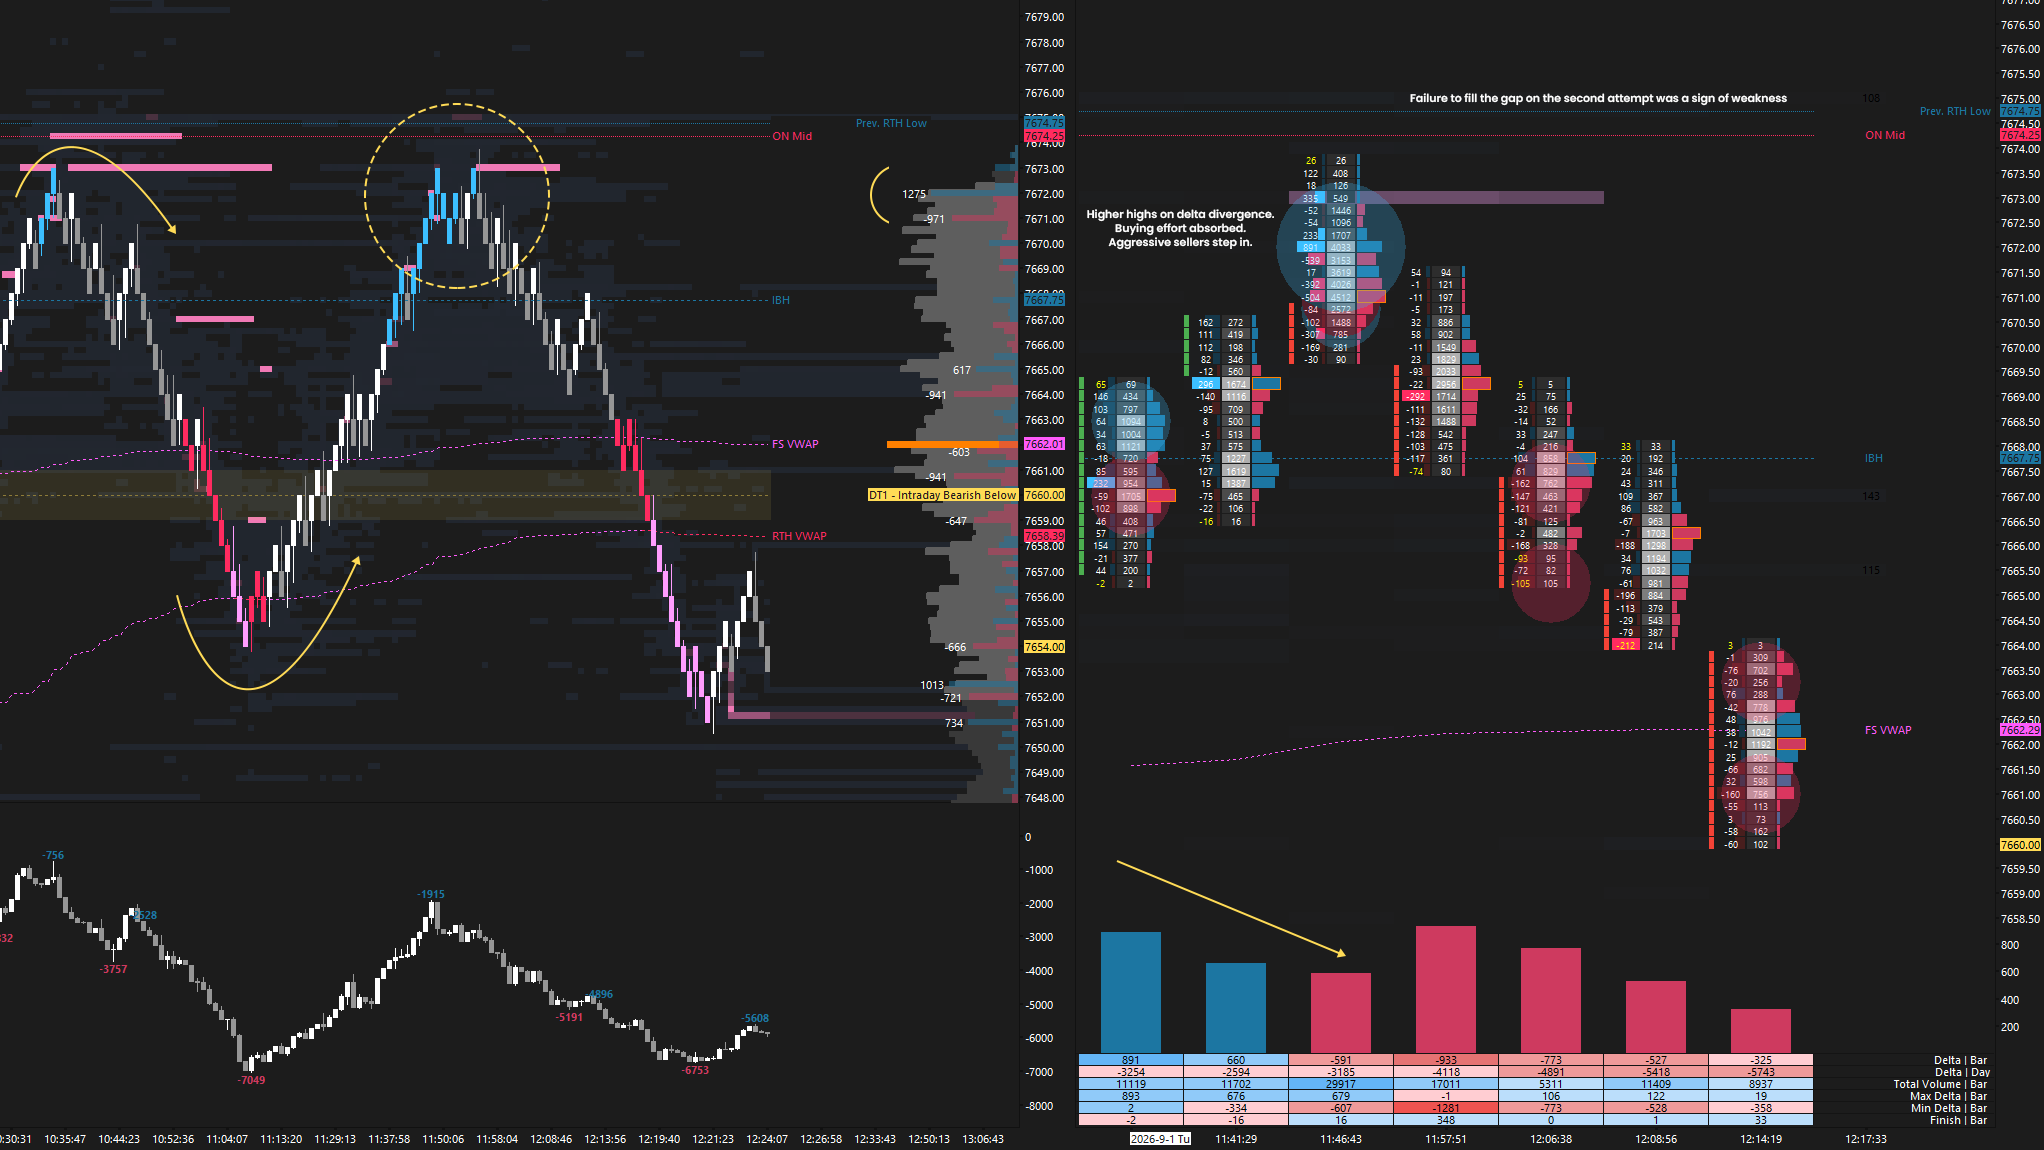
The C-period came a few ticks shy of filling today’s gap at 7674.75 (7673) before the first meaningful pullback unfolded. Buyers defended this pullback during the D-period, setting up another attempt at today’s gap in the E-period. The gap remained unfilled after reaching a high of 7673.75, from which a perfect reversal unfolded from an order flow perspective (see Figure 1). The afternoon session was marked by continued downside pressure, filling the bull gap at 7637.75 and probing into the prior multi-week balance area.
Session Recap
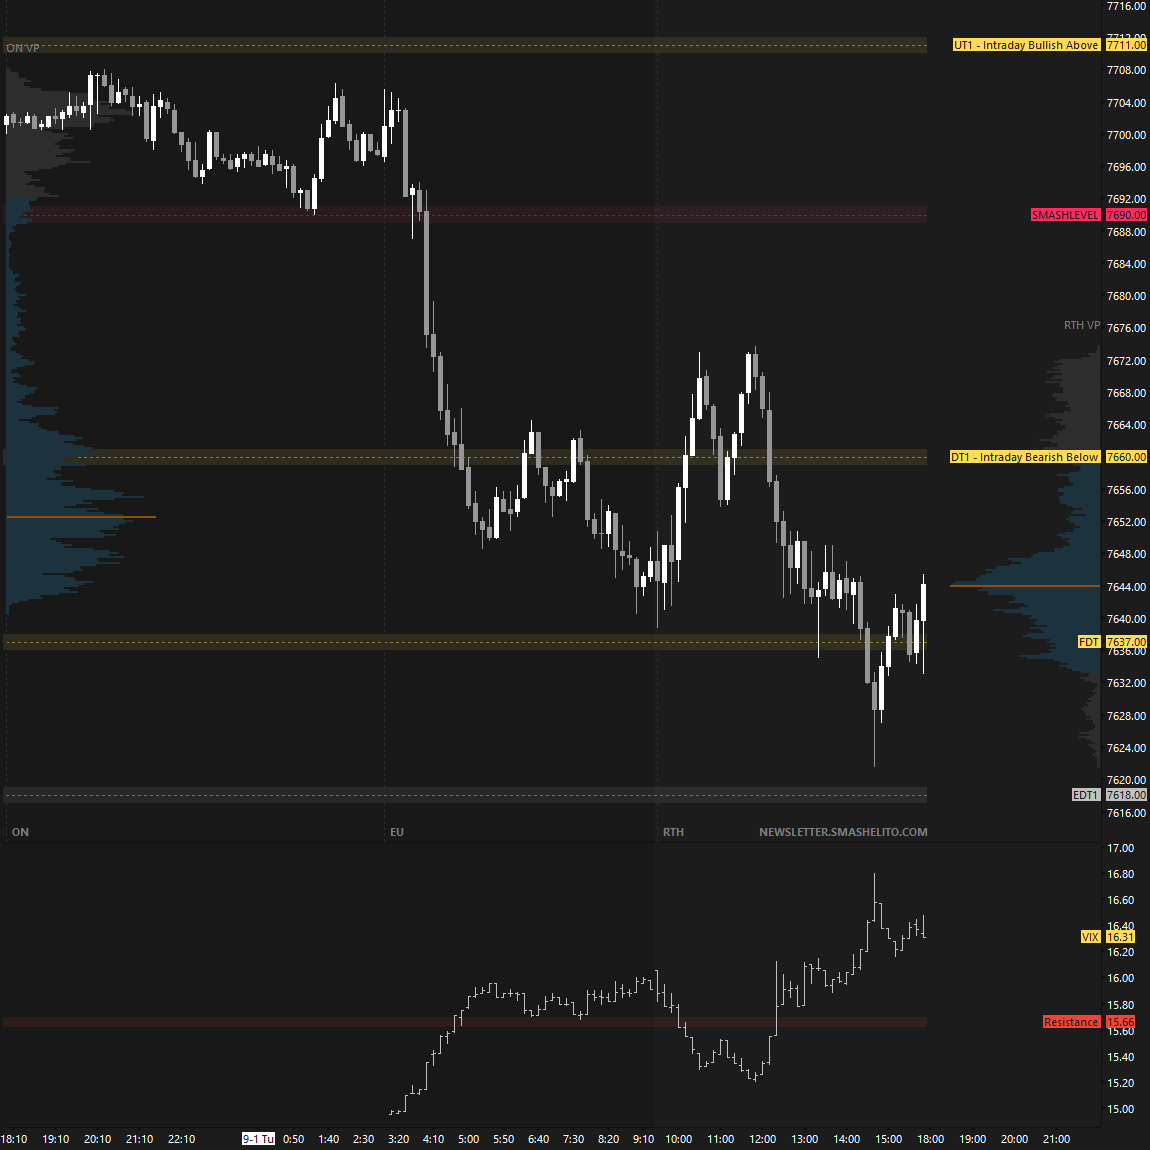
Heading into this week, the key for buyers was to defend the LVN at 7711, as failure to do so would be short-term bearish and open the door to filling the bull gap at 7637.75. The gap was effectively filled today, meaning the auction has reached a critical inflection point as it now retests the breakout point from the multi-week balance area—the prior ATH at 7648.
Keep it simple: acceptance back into the prior multi-week balance, suggesting that the breakout has failed, would set the stage for continued downside pressure. Failure to do so, meaning acceptance back into last week’s range above 7655, would keep the broader bullish structure intact.
In terms of levels, the Smashlevel is at 7655, last week’s low. Holding below 7655 would maintain downside pressure, targeting today’s excess base at 7633 (DT1). Acceptance below 7633 would signal intraday weakness, targeting 7610 (DT2), with 7589 (FDT) serving as the final downside target under sustained selling pressure.
On the flip side, reclaiming 7655 shifts focus to the bear gap at 7674 (UT1). Acceptance above 7674 would signal intraday strength, targeting the HVN at 7690 (UT2), with 7711 (FUT), Monday’s bear gap, serving as the final upside target under sustained buying pressure.
Visual Representation
Levels of Interest
Going into tomorrow’s session, I’ll closely observe the behavior around 7655.
Break and hold above 7655 would target 7674 / 7690 / 7711
Holding below 7655 would target 7633 / 7610 / 7589
Additionally, pay attention to the following VIX levels: 17.16 and 15.52. These levels can provide confirmation of strength or weakness.
Break and hold above 7711 with VIX below 15.52 would confirm strength.
Break and hold below 7589 with VIX above 17.16 would confirm weakness.
Overall, it's important to exercise caution when trading outside of the highlighted yellow levels. A non-cooperative VIX may suggest possible reversals i.e trade setups.
Smash
Reading your explanation to Matteo
It is a great explanation very direct informative
Really appreciate all you do
Best wishes you are a true professional and gentleman
Thanks!!