

— For new subscribers
The yellow levels highlighted at the bottom left of the chart are the primary intraday levels I focus on. To avoid impulsive decisions at poor trade locations, I follow a simple but effective rule: exercise caution when initiating trades outside of these yellow levels.
This means I’m cautious about chasing longs above the Final Upside Target (FUT) and shorts below the Final Downside Target (FDT). It’s important to understand that not chasing does not imply initiating a trade in the opposite direction. Discipline over impulse.
Be sure to review the Weekly Plan for a broader perspective, key levels, and market expectations for the week ahead.

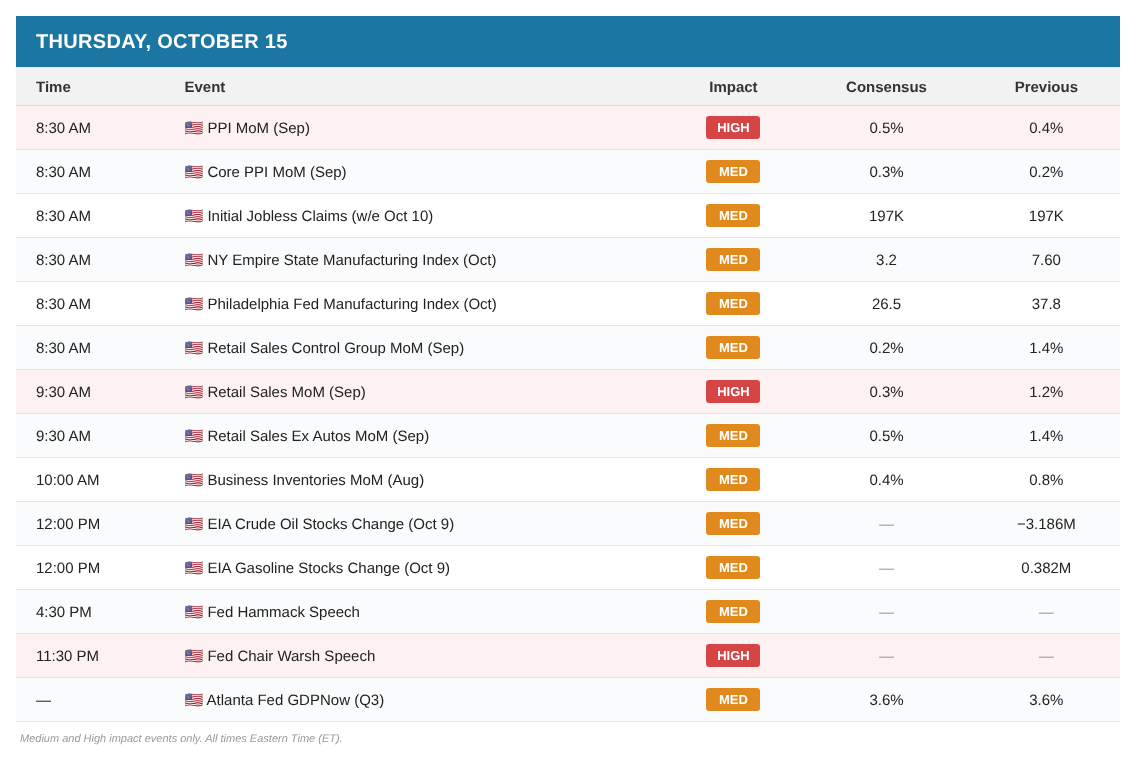
Catalysts
Contextual Analysis & Plan
In contrast to Monday and Tuesday, we saw some volatility today. Overnight, buyers initially defended 7848 (DT1) before reclaiming 7866 (Smashlevel) ahead of the release. However, the tone shifted significantly after CPI, with sellers taking control and setting the stage for the RTH session to open with a true gap down.
A True Gap in Market Profile occurs when the new session opens completely above or below the prior day’s entire trading range, meaning there is no overlap in traded prices between the two sessions.
A Normal (settlement) gap is when price opens away from the prior day’s close, but can still overlap or trade within the prior day’s range, meaning there is no structural separation in the auction.
A true gap is generally considered more significant, as it reflects a clearer shift in market tone and a potential transition into a new auction area.
When the auction opens with a true gap in either direction, it signals a shift in tone relative to the prior session. Our job is then to assess whether that shift will be accepted or rejected. Buyers initially defended the opening level, allowing the auction to fill today’s gap at 7834.50, where sellers stepped in. This classic gap-fill reversal provided an early clue of weakness, as the potential shift in tone remained intact. Subsequently, sellers broke below the overnight low, providing a second clue of weakness.
The final downside target at 7807 (FDT) was already tagged in the B-period. At the time, the VIX was still holding below its resistance at 15.94. However, value was building below 7807, negating the potential for a reversal. A quick LBAF at 7807 would have been a different story. The Initial Balance was then extended to the downside in the C-period, with the VIX breaking above its resistance later in the session, which typically signals the potential for continued weakness.
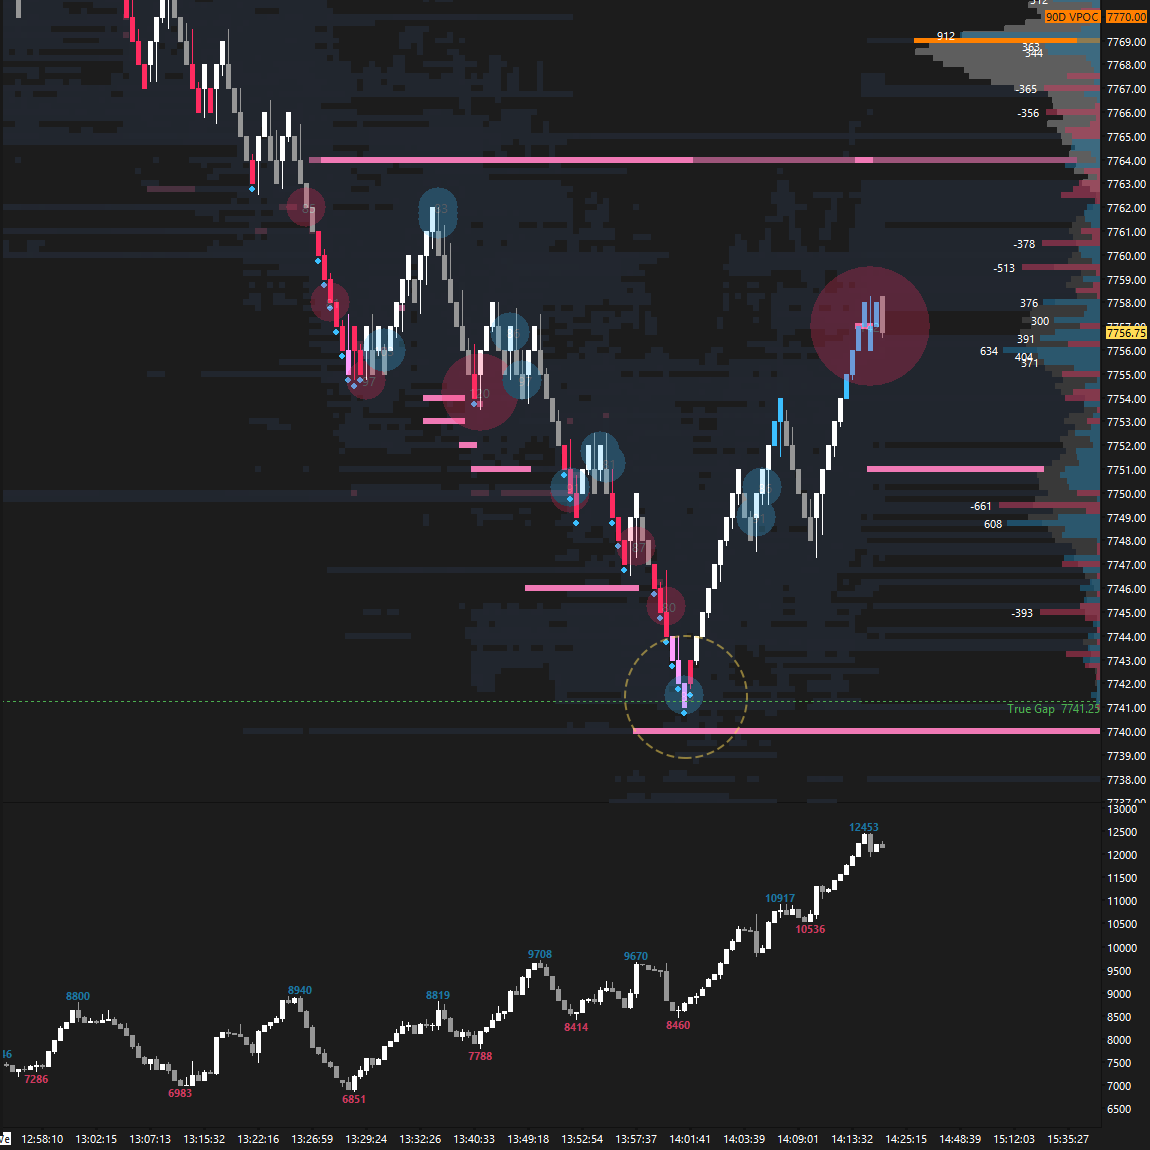
The true gap at 7741.25 was filled almost to the tick in the J-period, marking the session low in confluence with the MA50 (see Figure 1). If you have reviewed the Weekly Plan, you know that weekly support lies between 7740 and 7710, meaning we are now at a critical area for buyers to defend. Failure to hold this area would open the door to a rotation down to the multi-week balance low, following the failed breakout.
Session Recap
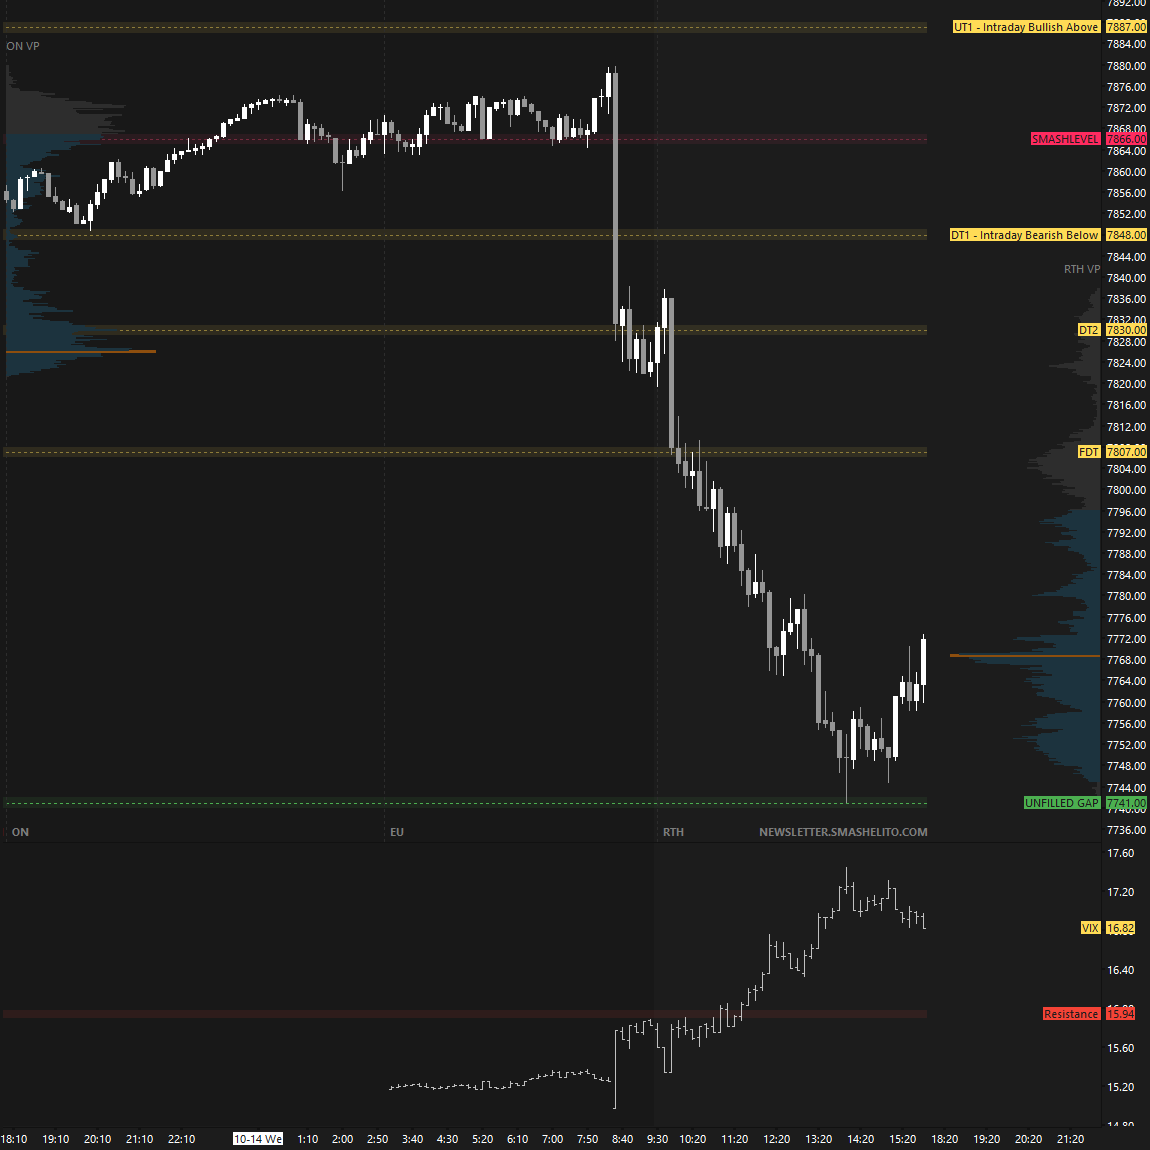
The market was coiling for a directional move, and today’s CPI release ultimately served as a catalyst for a move lower. The auction has now rotated back toward the high volume node at 7770, making the behavior around this HVN key to monitor in the short term.
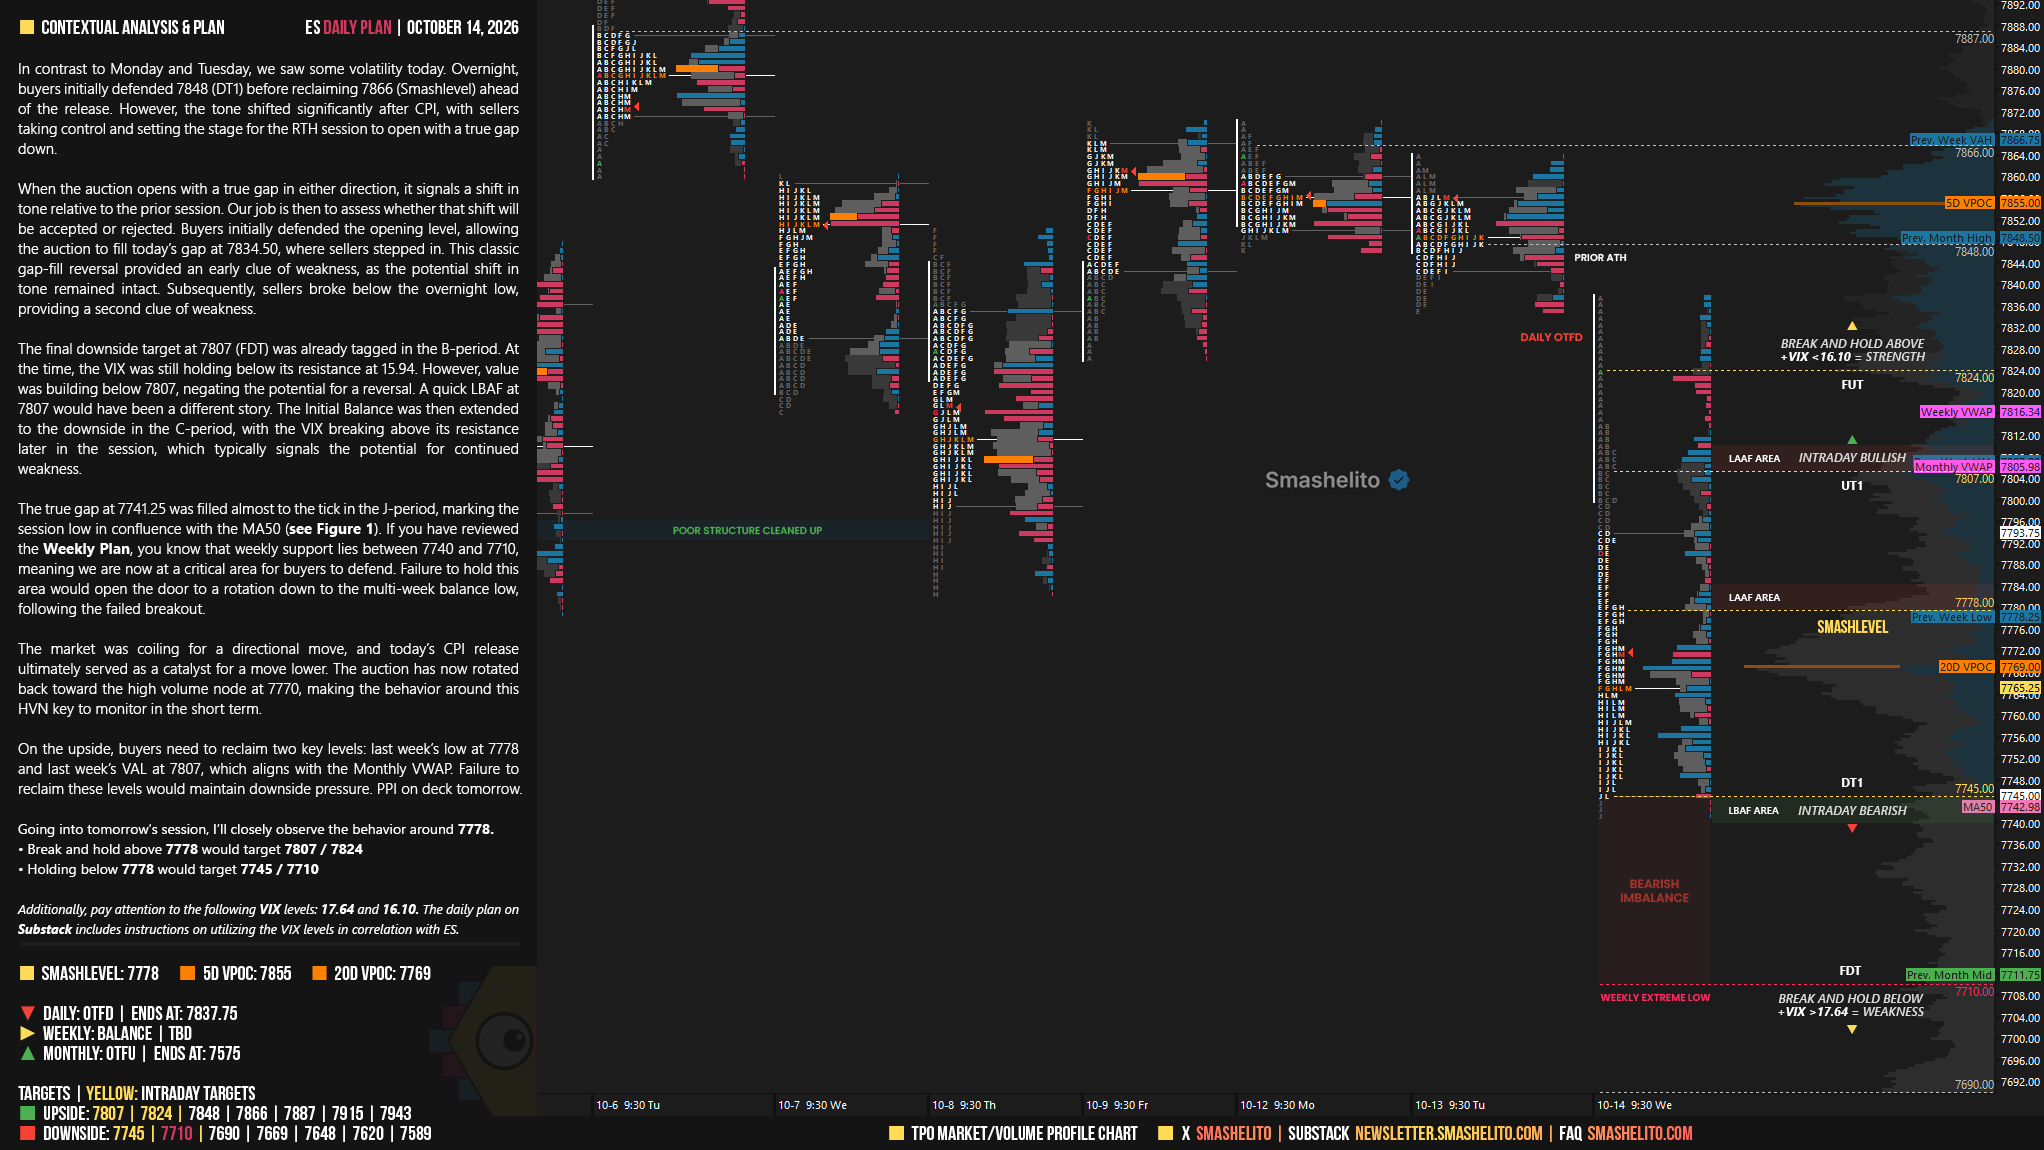
On the upside, buyers need to reclaim two key levels: last week’s low at 7778 and last week’s VAL at 7807, which aligns with the Monthly VWAP. Failure to reclaim these levels would maintain downside pressure. PPI on deck tomorrow.
In terms of levels, the Smashlevel is at 7778, last week’s low. Holding below 7778 would maintain downside pressure and target 7745 (DT1), where a potential LBAF is of interest, with 7710 (FDT), the Weekly Extreme Low, serving as the final downside target under sustained selling pressure.
On the flip side, reclaiming and holding above 7778 would shift focus to last week’s VAL at 7807 (UT1), where a potential LAAF is of interest, with 7824 (FUT), today’s opening level, serving as the final upside target under sustained buying pressure.
Visual Representation
Levels of Interest
Going into tomorrow’s session, I’ll closely observe the behavior around 7778.
Break and hold above 7778 would target 7807 / 7824
Holding below 7778 would target 7745 / 7710
Additionally, pay attention to the following VIX levels: 17.64 and 16.10. These levels can provide confirmation of strength or weakness.
Break and hold above 7824 with VIX below 16.10 would confirm strength.
Break and hold below 7710 with VIX above 17.64 would confirm weakness.
Overall, it's important to exercise caution when trading outside of the highlighted yellow levels. A non-cooperative VIX may suggest possible reversals i.e trade setups.
Thanks Smash!
Mega bull fumble. 50 SMA held for today but futures are already drilling. This was the excuse to sell the AI trade.